Research Journal
Volume 10, No. 31, Sept. 2016, pages 94–101
DOI: 10.12913/22998624/64073 Research Article
ANALYSIS OF DECREASE MACHINABILITY POSSIBLE CAUSES
FOR CLAIMED ALLOY
Nataša Náprstková1, Sylvia Kuśmierczak2
1 Faculty of Production Technology and Management, Jan Evangelista Purkyně University in Ústí nad Labem,
Pasteurova 1, 400 96, Ústí nad Labem, Czech Republic, e-mail: [email protected]
2 Faculty of Production Technology and Management, Jan Evangelista Purkyně University in Ústí nad Labem,
Pasteurova 1, 400 96, Ústí nad Labem, Czech Republic, e-mail: [email protected]
ABSTRACT
The Faculty of Production Technology and Management is often asked by companies
with a request to solve a specific technical task. One of these tasks was the analysis
of aluminum alloy worsened machinability when the rods from this alloy exhibited
against assumption significantly worse (longer) chips during machining. The alloy was complaint and, of course, it created economic damage. Obviously, the company
was interested in the causes of this alloy behavior change that could possibly generate future complaints procedures to defend itself better, or to avoid mistakes in the
pro-duction of the material. At the faculty analysis that could contribute to identifying the cause of the worsened machinability were done.
Keywords: alloy, structure, machinability, cutting conditions.
INTRODUCTION
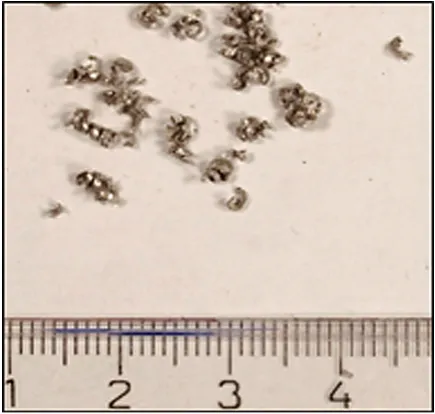
Aluminum alloys are frequently subjected to machining process and for this process their machinability is important. Machinability de -pends on many factors. The main factors are working material,(its chemical composition and microstructure) tool, lubrication or cooling etc. appropriate choice of cutting conditions, in which we machine the material is also important. The result should be reaching the surface with desired properties which are characterized by the inte-grity of the component surface. In the machining process there a delicate crumbly chip is generally required, which facilitates not only the handling, but also affects the costs of waste management. From the above, it is evident that the formation and shape of chips affects a wide variety of fac -tors, wherein the resulting chip in adverse cases (Fig. 1) may adversely affect the quality of the surface after machining [1, 2, 3, 4].
This article was created at the request of one company to determine the reason for
change in machinability aluminum alloy EN AW 6064, when part of one production batch has been returned under the complaint procedure, when this batch during machin-ing showed just a schip in Figure 1. The aim of the analysis was to analyze the possible cause of a change in machinability of aluminum alloy using light and electron microscopy and selected mechanical tests. [5, 6].
EXPERIMENT
The subject of research were two aluminum rods with a diameter of 14 mm and a length of about 1 m (Fig. 2). Both rods were from EN AW 6064. The problem was the poor machinability of one of the rods, which the contracting authority jus
-Received: 2016.06.04 Accepted: 2016.07.05 Published: 2016.09.01
tified by a very long spiral chip (Fig. 1), which was formed during machining. the rods were de -scribed by the contracting authority as rod GOOD (OK) and rod BAD (NOK).
Within the solution differences between rods were compared. samples were made from the rods, which were then subjected to the following analyzes [7, 8, 9, 10, 11, 12, 13]:
• chemical analysis,
• static tensile test according to EN 10 002-1 • microscopic analysis without chemical
etch-ing condition usetch-ing light microscopy,
• microscopic analysis with chemical etching condition using light microscopy,
• microscopic analysis using electron micros-copy,
• evaluation of hardness according to EN ISO 6507-1,
• evaluation of chip according to ISO 3685, • evaluation of surface roughness after
machin-ing accordmachin-ing to EN ISO 4287.
Chemical analysis was realized on the opti-cal emission spectrometer BAS Q4 Tasman. The analysis results are shown in Table 1.
The measured values were then compared with the content elements in the standard EN 573-3. The chemical composition is given in Table 2.
When comparing Table 1 and Table 2, it was found that the chemical composition of individual
elements (for samples OK and NOK) is within the tolerance values of the standard CSN EN 573-3, which means that the chemical composition cor-responds to this standard.
Important elements with regard to the ma -chining process are lead and bismuth. The quan -tity of these elements in samples of OK and NOK is similar, differing only in thousandths of %. Important is, however, the exclusion of these ele -ments in the intermetallic phases.
To determine the mechanical characteristics of the material the static tensile test was performed. The results of this experiment are shown in Table 3. When comparing the mechanical properties for the sample OK and NOK, there were found the higher breaking strength for the sample OK, and higher ductility on the same sample. The measured the strength was also higher. Sample OK thus exhibits better mechanical properties than the NOK sample. For microscopic analysis were prepared four samples from the rods OK and NOK in longitudinal and cross section. The prepared samples are shown in Figure 3. Samples were analyzed by light microscope Olympus LEXT OLS 3100.
First, the structure was analyzed in unetched condition. The structure of the analyzed samples in the unetched state contains α phase and the amount of intermetallic phases which are in solid solution, which is partially doped with alloying elements, depending on their solu-bility in aluminum. This solid solution pic-turing white areas. For samples OK (Fig. 4), we can observe uneven distribution of these. In cross section it is possible to observe two Fig. 2 Analyzed rods
Table 1. The chemical composition of the samples OK and NOK
Measured values [wt. %]
Si Fe Cu Mn Mg Cr Ni Zn
OK 0.644 0.348 0.289 0.115 0.96 0.114 0.0037 0.0204
NOK 0.675 0.386 0.268 0.119 1.01 0.119 0.0048 0.0817
Ti Bi Pb
OK 0.0223 0.664 0.324
NOK 0.0213 0.663 0.326
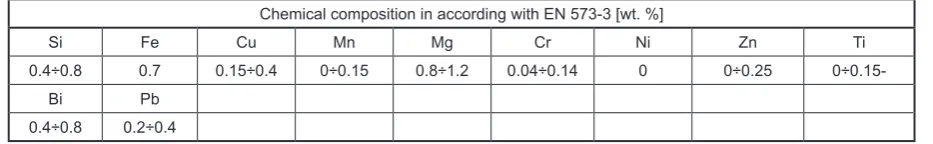
Table 2. The chemical composition of the alloy EN AW 6064
Chemical composition in according with EN 573-3 [wt. %]
Si Fe Cu Mn Mg Cr Ni Zn Ti
0.4÷0.8 0.7 0.15÷0.4 0÷0.15 0.8÷1.2 0.04÷0.14 0 0÷0.25
0÷0.15-Bi Pb
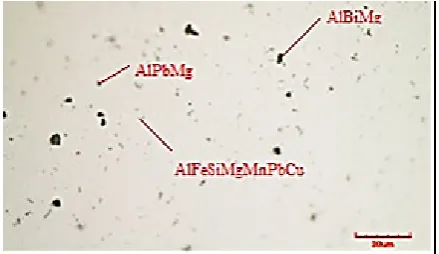
types of phases that differ in size. Larger particles are intermetallic phases of the type BiAlMg, which have a positive effect on the machinability due to the low melting point of Bi. Furthermore, there are the multicomponent polycomponent phases containing most of the alloying elements. These are the phases based on AlFeSiMg (Fig. 4). In sample NOK in cross section we can observe uneven distribution of different phases (Fig. 5). In comparison with the sample OK (Fig. 4) the structure contains
a smaller proportion of larger phases based on BiAlMg. Large particles are intermetallic phases AlBiMg, wherein the proportion of Bi in this phase is lower than the proportion in sample OK. Because the incidence and distri -bution of those phases affect machinability of alloys significantly, it can be assumed that the smaller quantity of these has influence on the formation and, in particular, on the shape of the chip. Further, in the the sample NOK the inter -metallic phases AlPbMg were found. These are small particles of about 2 µm. In sample NOK it was also possible to observe complex poly-component phases with representation of most alloying elements (Fig. 5). These are the phas -es based on AlFeSiMgMnPbCu. In sampl-es NOK (Fig. 5) there found a smaller number of phases based on BiAlMg, it can be assumed that for this reason, this alloy will have a worse machinability than the sample OK (Fig. 4).
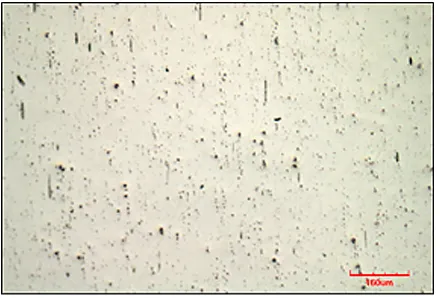
In sample OK in longitudinal section there were observed directed intermetallic phases in the forming direction (Fig. 6). In Figure 7 there is a longitudinal sectional structure of the sample NOK. When comparing a sample OK and NOK in longitudinal section, diversity can be observed in the size of intermetallic phases. In sample OK (Fig. 6) large intermetallic phases can be ob -served, which are uniformly spaced and are ap-proximately 50 µm. In sample NOK (Fig. 7), the phases are smaller and irregularly distributed. Their size is about 30 µm.
Further, an analysis of the microscopic struc-ture was realized in etched state. This analysis was performed in order to investigate grain size. Samples of material were etching by mixtures of acids and observed in polarized light with a light microscope Olympus BX51M.
When comparing the grain size on samples OK and NOK there was possible to observe the Table 3. Mechanical values of alloysEN AW 6064A
Sample Rm Rp0,2 A5
[MPa] [MPa] [%]
OK 376 369 12,6
NOK 365 357 10,6
Fig. 3 Samples OK and NOK for microscopic
analysis
difference in grain size. In sample OK (Fig. 8) could be observed finer grains than in sample NOK (Fig. 9). This analysis confirms the ob -served mechanical properties (Tab. 3), when in the sample NOK was measured higher strength of given aluminum alloy. Because the grain size also affects the machinability of aluminum alloys may be assumed that the sample OK is better ma -chinable.
Further phases were analyzed in both sam-ples. Phase analysis was performed on an electron microscope Tescan Vega 3 using EDX analyzer BRUCKER 16. For the analysis of the chemical composition of selected phases using EDX analy -sis two samples from bars OK were prepared and NOK for observation in cross section. The sur -face was grinded, polished and etched. Selection of particles proceeded according to their charac-teristic size and shape.
In sample OK three particles were analyzed. Fig. 10 shows an illustration of one of them.
According to the results of EDX analysis, there was an intermetallic phase based on BiAlMg with major share of Bi. Oxygen and carbon in this particle were found as impurities. Due to the small proportion of Si may be assumed that this element was at first particles transil -luminated from the matrix α phase. Due to the large proportion of Bi we can say that these par-ticles could have a significant positive effect on the machinability of this alloy. The size of this particle was about 10 µm. The particle has a rounded shape with no sharp edges. The second particle was analyzed by chemical composition, size and shape similar to the first particle but it had a higher proportion of Bi. Oxygen and carbon are also found as impurities. Also here the same beneficial effect of these particles on the machinability of the alloy can be assumed (as the first particle). The size of this particle was also about 10 µm. The third particle was by EDX analysis characterized as polycomponent Fig. 6. Sample OK, longitudinal section, mgn. 100x Fig. 7. Sample NOK, longitudinal section, mgn. 100x
phases based on AlFeSiMg, in which were rep -resented most alloying elements.
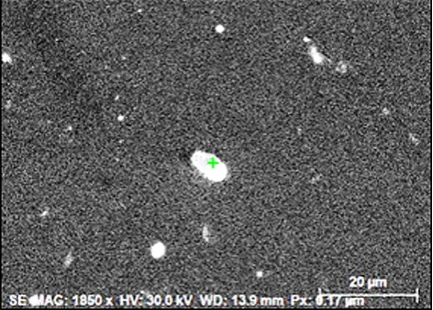
In sample NOK were analyzed four particles. Figure 11 shows an example of one of them (the first particles). For the first part, according to the chemical composition it has been possible to say that this is an intermetallic phase based on AlPbMg. Lead is added to the alloy because of their better machinability, it melts at the point of cutting and reduce the friction between tool and workpiece, also increases the brittleness of the chip. Carbon in this part of was the impurity. The contamination of surface by carbon can occur during grinding, polishing, or other manipulation with the sample. Oxygen was also identified, which was also the impurity, into the surface typically obtained by reacting with the environment, in which Al2O3 is formed. The size of the first particles was ap -proximately 4 µm.
The second analyzed particle was identified as an intermetallic phase based on AlBiMg. Ac -cording to the EDX analysis at this phase a small amount of Si was situated. Due to the small pro -portion of Si may be assumed that this element was transilluminated from the matrix α phase. Again, oxygen and carbon were identified as im -purities. There was also identified bismuth that is added to the alloy as a substitute of lead. It helps
to lubricate the cutting tool and reduces abrasive wear of the cutting tool. This particle was also great about 4 µm.
Third particle had a similar chemical com-position as the second particle. This was accor -ding to analysis the intermetallic phase based on AlBiMg. The difference, however, was on its size. This particle was approximately half the size, was about 2 µm.
The fourth analyzed particle was complex, highly polycomponent phase in which all alloy-ing elements were represented. It was possible to observe the binding of Fe and Mn, which come into favorable intermetallic phases without nee-dles, which would impair the mechanical proper-ties and machinability.
By comparing samples OK and NOK, it was found that in both samples large particles con-taining Bi were found. In samples OK there was a higher proportion of Bi in individual phases. There were also phases more uniformly distrib-uted and in greater quantity.
Like a further test was performed machin-ing of both samples under the cuttmachin-ing conditions (Table 4).
As a first was evaluated the obtained surface roughness Ra, Rz and Rt. Figures 12 and 13 shows examples of created graphs. On this basis, it is Fig. 10.Particle 1, sample OK Fig. 11.Particle 1, sample NOK
Table 4. Choice of cutting conditions and marking of samples
Cutting conditions Roughing Finishing
Mashining diameter [mm] 14 14 11 11
Cutting depth ap [mm] 1.5 1.5 0.5 0.5
Feed f [mm/ot] 0.25 0.25 0.25 0.25
Cutting speed vc [m/min] 140 125 140 125
Marking od samples OK OK1 OK2 OK3 OK4
possible to conclude that for the individual cut-ting conditions there were small and inconclusive differences in the roughness. It was not therefore possible to conclude which from the alloys exhib-its worse machinability according to this aspect. During roughing roughness was slightly better for the alloy NOK, when finish machining the surface roughness was either the same or slightly better for the alloy OK.
A chip which was obtained by machining un -der cutting conditions was also evaluated, see Ta-ble 4. Splinter was evaluated visually, according to the quantity of chips per 100 g and according to the stamping chips coefficient.
Figures 14 and 15 show samples of the chips after machining alloys OK and NOK, particularly after finishing machining. Generally speaking, all the chips for the roughing and finishing of both alloys were completely satisfactory in terms of machining. The chip was always small, crumbly, arched. There were observed only small differ
-ences in the size of the chip for each cutting con-ditions. It can also be stated that the alloy NOK exhibited in some cases noticeably smaller chip compared with chip of alloy OK, which was inter -esting due to the reason of claim of this material.
Evaluation according to the number of chips per 100 g according to the company’s internal pro -cess was carried out in a laboratory balance AND GF-200, which is measured with an accuracy of 0.001 g. The chips were selected according to their varying characteristic length. Figures 16 and 17 show graphs obtained by measurements. The graphs are confirming the fact gathering already in evaluating the shape of chips. Better in this mea -surement strangely again based alloy NOK.
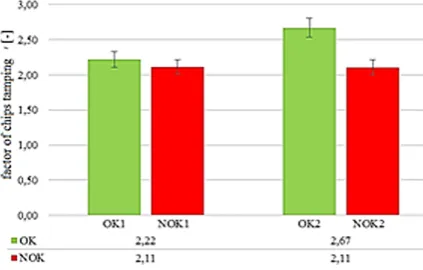
Another measurement was the determin -ing stamp-ing chips coefficient. This has been implemented only for the roughing operations, because the finish machining originated chip which was difficult to measure. Figure 18 shows a graph with obtained results. This results from Fig. 12. Comparison of surface roughness for samples
OK1 and NOK1 – roughing Fig. 13. Comparison of surface roughness for samplesOK3 and NOK3 – finishing
both cutting speeds occurred in samples OK to higher stamping chip, thus a higher plastic de-formation of the chips.
The last measurements carried out in the evaluation irons OK and NOK were hardness measurement. Hardness test was chosen Vickers according to DIN EN ISO 6507-1. For measure -ments two sets of samples were prepared (OK, NOK). Sample surface was ground and then polished. Was carried out ten measurements for each sample. The places of individual stitches were chosen randomly. From the individual mea -surements were calculated arithmetic mean and determined standard deviation. The measured values as in the graph in Figure 19. For sample OK the average value of hardness was measured (124 ± 1.2) HV1, which is higher than for sample NOK, where the measured hardness value was (121 ± 1.1) HV1. This difference in hardness val -ues may be due to lower copper content in sample NOK. The hardness difference between samples is insignificant and therefore it would not have a significant effect on machinability of both sam -ples OK and NOK.
CONCLUSIONS
Based on demand two batches of one alloys were assessed, and one of them was returned in the complaint, because when it machining created very long and therefore unsuitable chip. Several analyzes to determine the possible causes of mak-ing inappropriate chips were carried out.
The first was the analysis of the chemical composition of samples and comparison of the chemical composition according to DIN EN 573-3 for these alloys. It was found that individual ele -ments for the samples OK and NOK correspond to the chemical composition which determines this standard.
Further analysis was to evaluate the microstructure using light and electron microsco-py, where differences were found between sam -ples OK and NOK structure. The principal diffe -rence was the size of grains in the samples, and the size and chemical composition of individual intermetallic phases between samples. In sample OK occurred larger particles based on Al Mg, which have a positive effect on the machinability Fig. 16. Quantity of chips per 100g while turning
roughing Fig. 17. Quantity of chips per 100g while turning finishing
Fig. 18. Comparison of stamping chip coefficient for
of the alloy. The size of these phases was approxi -mately 10 µm. Sample NOK contained interme -tallic phases based on AlBiMg that were smaller in size (approximately 4 µm). These intermetallic phases have a lower content of Bi. In sample OK these phases were more uniformly spaced than in sample NOK. In terms of the microstructure can be concluded that the sample OK has better machinability due to the smaller grain size, more uniform spacing of intermetallic phases, prefera-bly, the chemical composition of these phases be-cause of the higher content of Bi and a larger size of these phases.
Although the shown difference in microstruc -ture, during roughness measurement and evalua-tion of the chips after the machining has not been demonstrated, different machinability of the alloy at the laboratory selected cutting conditions. The findings, which were found to show that changing the cutting parameters good machinability can be achieved as well as for NOK sample, although there has been some change of microstructural parameters. Another recommendation is from the customer to specify further requirements on the microstructure of alloys machined as e.g. grain size, phase separation etc.
Acknowledgements
Authors are grateful for the support of grant SGS 2016 UJEP and of grant OP 2.2 No. CZ.1.07/2.2.00/28.0296.
REFERENCES
1. Michna S., Lukac I., Ocenasek V., Koreny R., Drapala J., Schneider H., Miskufova A.. at al.: Encyclopedia of aluminum. Adin, Prešov, 2005. 2. Vojtech D.: Metallic materials. VSCHT Pra
-ha, Pra-ha, 2006, pp. 140.
3. Michna S., Kusmierczak S.: Technology and processing of aluminum material. UJEP. Usti nad Labem, 2008.
4. Michna S., Kusmierczak S.: Practical metal -lography OPTYS, FVTM UJEP, Ústí nad Labem, 2012, pp. 245.
5. Valicek J., Rusnak J., Muller M., Hrabe P., Kadnar M., Hloch S., Kusnerova M.: Geomet -ric aspects of surface roughness of classic and non-traditional technologies. Jemna mechani -ka a opti-ka, 53(9), 2008, 249-253.
6. Kalincová, D Testing of mechanical properties of materials - overview of metering methods and equipment. In: Increasing the efficiency of the educational process through inovacnzch funds. KEGA 3/6370/08., TU vo Zvolene, Zvolen., 2010, 13-26.
7. Madl. J.: Surface properties in Precise and Hard Machining. Manufacturing Technology, 12(13), 2012, 158-166.
8. Michna S., Naprstkova N.: The Mechanical Properties Optimizing of of Al - Si Alloys Precipitation Hardening and the Effect on the Character of the Chip. Acta Metallurgica Slo -vaca, 3, 2011.
9. Weiss V. 2012. Hodnoceni vlivu teploty a doby homogenizačniho žihani slitiny Al -Cu4MgMnz hlediska mikrostruktury, obra-zove analyzy a metody EDX. In Strojirenska technologie, 17(5-6), 2012, 348-355.
10. ISO 3685 1993. Tool-life testing with single-point turning tools.
11. Hricová J.: Influence of Cutting Tool Material on the Surface Roughness of AlMgSi Alu -minium Alloy. In Manufacturing Technology, 13(3), 2013, 324-329.
12. Weiss V., Strihavkova E.: Influence of the ho -mogenization annealing on microstructure and mechanical properties of AlZn5,5Mg2,5Cu1,5 alloy. Manufacturing Technology, 12(12), 2012, 297-302.