CODEN (USA): IAJPBB ISSN: 2349-7750
I
I
N
N
D
D
O
O
A
A
M
M
E
E
R
R
I
I
C
C
A
A
N
N
J
J
O
O
U
U
R
R
N
N
A
A
L
L
O
O
F
F
P
P
H
H
A
A
R
R
M
M
A
A
C
C
E
E
U
U
T
T
I
I
C
C
A
A
L
L
S
S
C
C
I
I
E
E
N
N
C
C
E
E
S
S
Available online at: http://www.iajps.com Research Article
DEVELOPMENT AND VALIDATION OF TLC
DENSITOMETRIC METHOD FOR THE STABILITY
INDICATING STUDY OF METOPROLOL SUCCINATE AND
HYDROCHLOROTHIAZIDE IN TABLET DOSAGE FORM
Kolhe Mahesh Hari*, Bhusal Ramesh Dattatraya, Hajare Pranit Pandurang.
Department of Pharmaceutics, Pravara Rural College of Pharmacy, Pravaranagar,
A/P. Loni – 413736, Tal. Rahata, Dist. Ahmednagar, Maharashtra, India.
Abstract:
Accurate, specific, precise and robust TLC Densitometric method have been developed for simultaneous estimation of Metoprolol Succinate (METO) and Hydrochlorothiazide (HCTZ) in tablet dosage form. The chromatographic separation was performed on precoated silica gel TLC 60 F254 plates using Toluene: Methanol: Ethyl acetate:
Glacial acetic acid (7: 1.5: 1: 0.5 v/v/v/v) as mobile phase. This system was found to give compact bands for Metoprolol Succinate and Hydrochlorothiazide (RF values 0.15 and 0.35 respectively). Densitometric analysis of
Metoprolol Succinate and Hydrochlorothiazide were performed at 230 nm. Regression analysis data for the calibration plots were indicative of good linear relationships between response and concentration over the range 1000-5000 ng/band for Metoprolol Succinate and 500-2500 ng/band for Hydrochlorothiazide. An approach of forced degradation study was successfully applied for the development of a stability-indicating method for estimation of Metoprolol Succinate and Hydrochlorothiazide in the presence of its degradation products. The method was validated as per ICH guidelines for accuracy, precision, LOD, LOQ and robustness.
Keywords: Metoprolol Succinate (METO), Hydrochlorothiazide (HCTZ), TLC Densitometric.
Corresponding author:
Kolhe M.H.
Department of Pharmaceutics.
Pravara Rural College of pharmacy, Pravaranagar, Loni.
Mob- +91 9890300878
E-Mail:
[email protected]
Please cite this article in press as Kolhe M.H et al, Development and Validation of TLC Densitometric Method for
The Stability Indicating Study of Metoprolol Succinate and Hydrochlorothiazide in Tablet Dosage Form, Indo
Am. J. Pharm. Sci, 2016; 3(5).
INTRODUCTION:
Metoprolol Succinate is a beta-blocker and Hydrochlorothiazide is a potent thiazide diuretic that enhances natriuresis, leading to reduction in plasma volume and cardiac output. Therefore, it is used widely alone or in combination with other antihypertensive drugs for the treatment of cardiovascular disorders, viz, hypertension, angina and Congestive cardiac failure.
Chemically, Metoprolol Succinate is (±) 1-(isopropylamino)-3-[p-(2-methoxyethyl) phenoxy]-2-propanol succinate and Hydrochlorothiazide is 6-chloro-1, 1-dioxo-3, 4-dihydro-2H-1, 2, 4-benzothiadiazine-7-sulfonamide. Both the drugs are official in Indian Pharmacopoeia.
Detailed survey of literature for METO alone or in combination with other drugs is reported to be estimated by several methods based on different techniques such as UV spectrophotometry, HPLC, and HPTLC for its determination from pharmaceuticals. Similarly literature survey for HCTZ alone or in combination with other drugs is reported to be estimated by UV spectrophotometry, HPLC and HPTLC method. But no methods have been reported for simultaneous determination of METO and HCTZ. Hence in the present work a successful attempt has been made to estimate both these drugs simultaneously by TLC densitometric method. Currently TLC densitometric is becoming a routine technique for analysis of drug. To establish stability indicating nature of the HPTLC method, forced degradation of drug substances were performed under stress conditions (oxidation, acid and base hydrolysis). The proposed methods were optimized and validated as per ICH guidelines.
EXPERIMENTAL:
Chemicals and Reagents
Metoprolol Succinate and Hydrochlorothiazide Active Pharmaceutical Ingredient (API) were kindly gifted by Emcure Pharmaceuticals, Bhosari, Pune. Marketed tablet formulation of Metoprolol Succinate (25 mg) and Hydrochlorothiazide (12.5 mg), brand name METPURE-H, manufactured by Emcure Pharmaceuticals, Bhosari, Pune. AR grade Methanol, Concentrated Hydrochloric acid AR grade, Sodium hydroxide pellets purified was procured from Merck specialities Pvt. Ltd. Goa. Hydrogen Peroxide 30% AR grade was obtained from Universal laboratories Pvt. Ltd.Mumbai.
HPTLC Instrumentation and Chromatographic Conditions
Aluminium plates precoated with silica gel 60 F254 plates (Merck, Mumbai, India).Camag TLC scanner III (Densitometer) with WinCAT’s software version
1.4.3.6336 used for scanning and documentation. Camag Linomat V sample applicator with 100µl syringe. Camag hightec UV cabinet fitted with dual wavelength 254/366 nm, 8 volt UV lamp used for inspection of HPTLC plates. Camag twin trough glass chamber with stainless steel lid used for chromatographic development. Source of radiation was deuterium lamp emitting a continuous UV spectrum between 200nm and 400nm. Slit dimension 5 X 0.45 mm.
Chamber had been pre-saturated with mobile phase vapors. The optimized chamber saturation time was 30 min at room temperature. Densitometric scanning was performed at 230 nm.
Preparation of Standards and Sample Solutions Preparation of standard stock solution
Standard stock solution of METO and HCTZ were prepared by transferring accurately weighed METO (10 mg) and HCTZ (10 mg) to a 10 mL volumetric flask separately. Dissolved and diluted to a mark with methanol to obtain a standard solution of METO (1000 μg/mL) and HCTZ (1000 μg/mL). For linearity study from the stock solution appropriate volumes were spotted to obtain final concentration of 1000-5000 ng/spot for METO and 500-2500 ng/spot for HCTZ.
Preparation of sample solution
Twenty tablets were weighed and average weight was calculated. The tablets were crushed to obtain fine powder. Tablet powder equivalent to 25 mg of METO and 12.5 mg of HCTZ was transferred to 25 mL volumetric flask; diluted to a mark with methanol and sonicated for 10 min. The resulting solution was filtered through Whatmann filter paper. From these appropriate volumes were spotted to obtain final concentration of 2000 ng/spot for METO and 1000 ng/spot for HCTZ.
Procedure for Forced Degradation Study
Degradation studies were performed in tablet solutions containing 200 µg/mL of METO and 100 µg/mL of HCTZ. For acid, alkali and H2O2 induced degradation 1mL of 1 M HCl, 1 M NaOH and 3% v/v H2O2 was added to final drug solution respectively, and it was refluxed for 1 h. at 80° C. After 1 h. from this solution 10 μL was spoted on TLC plate.
Method Validation
Linearity
For linearity study from the stock solution appropriate volumes were spotted to obtain final concentration of 1000-5000 ng/spot for METO and 500-2500 ng/spot for HCTZ. The plate was developed, dried, and scanned. The linear regression data for the calibration curve for the two samples METO and HCTZ showed good linear relationship over the concentration with respect to peak area (Table 1.)
Analysis Of Marketed Formulation Drug bands at RF 0.15 and 0.35 corresponding to METO and HCTZ respectively were observed in chromatograms obtained from tablet extracts. There was no interference from excipients present in the tablets. The result of analysis of marketed formulation was given in (Table.2)
Sensitivity
The sensitivity of measurement of METO and HCTZ using the proposed method was estimated as the limit of quantification (LOQ) and the lowest concentration detected under these chromatographic conditions as the limit of detection (LOD). The LOQ and LOD were calculated by using the equations LOD = 3.3 × N/B and LOQ = 10 × N/B, where N is the standard deviation of the peak areas of the drug (n = 3), taken as a measure of noise, and B is the slops of the
corresponding calibration plot. Results for LOD, LOQ are shown in (Table 1.)
Accuracy
The accuracy of the method was determined by analysis of standard additions at three levels, i.e. multiple-level recovery studies. Reference standard at three different concentrations (80, 100, and 120 %) was added to a fixed amount of pre-analyzed sample and the amounts of the drug were analyzed by the proposed method. Results from the recovery studies are given in (Table 3.)
Precision
Precision was measured by analysis of sample solutions at three different concentrations. The precision of the method, as intraday variation (% RSD) was determined by analysis of METO and HCTZ in the range 1000–5000 ng/band and 500– 2500 ng/band three times on the same day respectively. Interday precision (% RSD) was assessed by analysis of the same solution on three different days. The results from study of precision are shown in (Table 4.)
Specificity
Robustness
Statistical analysis showed no significant difference between results obtained by applying the analytical conditions established for the method and those obtained in experiments in which some of the conditions were varied slightly. Results from the
robustness studies are given in
(Table 5.)
Stability Study
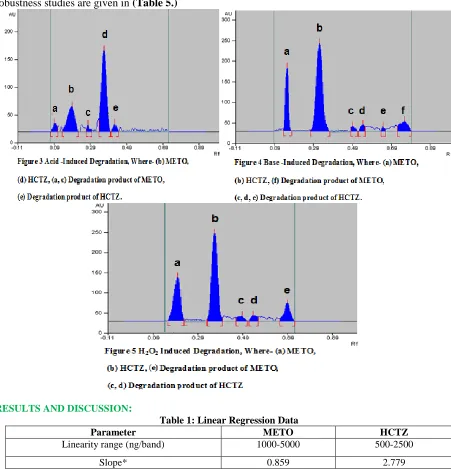
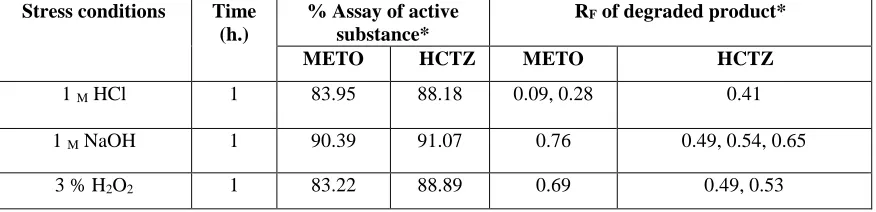
Both the drugs were degraded in 1 M HCl, 1 M NaOH and 3% v/v H2O2 shown in Figures 3, 4 and 5. The percent amount of drug recovered after degradation studies and the RF of degradation products are given in (Table 6.)
RESULTS AND DISCUSSION
:
Table 1: Linear Regression Data
Parameter METO HCTZ
Linearity range (ng/band) 1000-5000 500-2500
Slope* 0.859 2.779
Intercept* 320.6 1623
LOD (ng/band) 14.24 5.35 LOQ (ng/band) 43.15 16.22
r2* 0.993 0.993
Table 2: Result of Analysis of Marketed Formulation
Tablet Content
Label claim (mg/tab)
Amount found (mg/tab)
Label claim* (%)
RSD (%) SE
METO 25 24.81 99.24 1.1054 0.4480
HCTZ 12.5 12.42 99.40 0.6886 0.2794
a) *Mean of six estimation b) SE – Standard error of mean.
Table 3: Result for Recovery Studies
Level of % recovery
*% Recovery % RSD SE
METO HCTZ METO HCTZ METO HCTZ
80 100 120
99.98 99.75 100.47
99.88 100.39
99.83
1.3721 0.5967 0.6978
1.1693 0.8181 0.2448
0.7919 0.3437 0.4048
0.6746 0.472 0.1411
a) *Mean of three estimation.
Table 4: Intra-day and Inter-day Precision
Conc. of METO (ng/band)
% R.S.D. Intraday
% R.S.D. Interday
Conc. of HCTZ (ng/band)
% R.S.D. Intraday
% R.S.D. Interday
1000 1.0519 0.9619 500 0.6435 0.2613
3000 0.6833 0.6836 1500 0.8453 0.9427
5000 0.4472 0.5791 2500 0.5240 0.6482
Table 5: Result for Robustness Studies
Factor Level Rf value*
Mobile phase composition [(Toluene: Methanol: Ethyl acetate: Glacial acetic acid v/v/v/v)(± 0.1 mL)]
METO HCTZ
6.9:1.6:1:0.5 – 0.1 0.16 0.34
7:1.5:1:0.5 0 0.15 0.35
7.1:1.4:1:0.5 + 0.1 0.14 0.35
Band size (± 1 mm) METO HCTZ
5 – 1.0 0.15 0.36
6 0 0.15 0.35
7 +1.0 0.14 0.35
Duration for chamber saturation (± 2 min) METO HCTZ
28 - 2 0.14 0.36
30 0 0.15 0.35
32 + 2 0.15 0.34
Table 6: Result for Forced Degradation Studies.
Stress conditions Time (h.)
% Assay of active substance*
RF of degraded product*
METO HCTZ METO HCTZ
1 M HCl 1 83.95 88.18 0.09, 0.28 0.41
1 M NaOH 1 90.39 91.07 0.76 0.49, 0.54, 0.65
3 % H2O2 1 83.22 88.89 0.69 0.49, 0.53
a) *Mean of three estimation.
CONCLUSION:
The TLC Densitometric method was developed and validated as per ICH guidelines. The standard deviation and % RSD calculated for the proposed methods are low, indicating high degree of precision of the methods. The results of the recovery studies performed show the high degree of accuracy for the proposed methods. The TLC densitometric method could selectively quantitate METO and HCTZ in presence of its degradation products it can be employed as a stability indicating method. Hence, it can be concluded that the developed HPTLC method was accurate, specific precise and robust can be employed successfully for the estimation of METO and HCTZ in tablet dosage form.
REFERENCES:
1.Christian GD. 1995. Analytical Chemistry. New Delhi, Wiley India Pvt. Ltd.
2.Skoog DA, Holler FJ, Crouch SR. 2007. Fundamental of Instrumental Analysis. India: Thomson Books/Cole Publication.
3.Gennaro AR, Remington. 2000. The Science and Practice of Pharmacy. Philadelphia: Lippincott Williams and Wilkin Publication.
4.Anjeneyulu Y, Chandrasekhar K, Manikam V. 2008. A Textbook of Analytical Chemistry. Pharmamed Press BSP Book Publiaction.
5.Somenath M. 2003. Sample Preparation Techniques in Analytical Chemistry. New York: Wiley Interscience Publisher.
6.Sharma BK. 1991. Instrumental Methods of Chemical Analysis. Meerut: Goel Publishing House. 7.Willard HH, Meritt LL, Dean JA, Settle F. 2001. Instrumental Method of Analysis. Delhi: CBS Publishers and Distributors.
8.Skoog DA, Holler FJ, Crouch SR. 2007. Principle of Instrumental Analysis. India: Thomson Books/Cole publication.
9.Raynord P. 1994. Liquid Chromatography for the Analyst. New York: Marcel Dekker Inc.
10.Izmailov NA, Shraiber MS. 1903. Introduction and History of HPTLC. Farmatisiya.
11.Tswett M. Introduction and History of HPTLC. Soc. Nat. Sci. Biol. Section, 1903:14.
12. Halpaap H. Introduction and History of HPTLC. Journal of Chromatography, 1973:77-78.
13.Gunther KJ. Introduction and History of HPTLC. Journal of Chromatography, 1988:11-30
14.ICH, (Q2R1), Harmonized Tripartite Guideline, Validation of Analytical Procedures: Text and Methodology, IFPMA. Geneva; 2005: 1-13.
15.ICH, (Q2A), Harmonized Tripartite Guideline, Text on Validation of Analytical Procedures, IFPMA. Geneva; 1994: 1-5.