R E S E A R C H
Open Access
Evaluation of the robusticity of mutual fund
performance in Ghana using Enhanced
Resilient Backpropagation Neural Network
(ERBPNN) and Fast Adaptive Neural
Network Classifier (FANNC)
Yushen Kong
1*, Micheal Owusu-Akomeah
1, Henry Asante Antwi
2, Xuhua Hu
1and Patrick Acheampong
1* Correspondence: [email protected]
1School of Finance and Economics,
Jiangsu University, 301 Xuefu Road, Zhenjiang, Jiangsu, People’s Republic of China
Full list of author information is available at the end of the article
Abstract
Mutual fund investment continues to play a very important role in the world financial markets especially in developing economies where the capital market is not very matured and tolerant of small scale investors. The total mutual fund asset globally as at the end of 2016 was in excess of $40.4 trillion. Despite its success there are uncertainties as to whether mutual funds in Ghana obtain optimal performance relative to their counterparts in United States, Luxembourg, Ireland, France, Australia, United Kingdom, Japan, China and Brazil. We contribute to the extant literature on mutual fund performance evaluation using a collection of more sophisticated econometric models. We selected six continuous historical years that is 2010–2011, 2012–2013 and 2014–2015 to construct a mutual fund performance evaluation model utilizing the fast adaptive neural network classifier (FANNC), and to compare our results with those from an enhanced resilient back propagation neural networks (ERBPNN) model. Our FANNC model outperformed the existing models in terms of processing time and error rate. This makes it ideal for financial application that involves large volume of data and routine updates.
Keywords:Mutual fund performance, Artificial Neural Network, Fast Adaptive Neural Network Classifier
Introduction
Mutual fund investment has played a very important role in the world financial mar-kets especially in developing economies where the capital market is not very matured and tolerant of small scale investors (Song et al.2017). For example, according to the Investment Company Institute, the total mutual fund asset globally as at the end of 2016 was in excess of $40.4 trillion. To date the largest mutual fund markets are located in United States ($18.9 trillion), Luxembourg ($3.9 trillion), Ireland ($2.2 tril-lion), Germany ($1.9 triltril-lion), France ($1.9 triltril-lion), Australia ($1.6 triltril-lion), United Kingdom ($1.5 trillion), Japan ($1.5 trillion), China ($1.3 trillion) and Brazil ($1.1 tril-lion) (Chattopadhyay et al.2018). In the United States, mutual funds play an important role in U.S. household finances. At the end of 2016, 22% of household financial assets
were held in mutual funds. Their role in retirement savings was even more significant, since mutual funds accounted for roughly half of the assets in individual retirement ac-counts, 401(k) s and other similar retirement plans (Song et al. 2017). In total, mutual funds are large investors in stocks and bonds. Luxembourg and Ireland are the primary jurisdictions for the registration of UCITS funds. These funds may be sold throughout the European Union and in other countries that have adopted mutual recognition re-gimes (El Ghoul and Karoui2017).
Quarshie (2017) reveals that the mutual fund industry in Ghana dates back to pre-colonial times with the traditional “Susu” system still practiced among rural dwellers in Ghana. In this traditional capital market setup, a group of locals (market women, hawkers, farmers, drivers, artisans, and mostly low and informal income earners etc., contributes periodic amounts of money into a savings fund. This fund is managed by a designated individual or group of individuals who in turn return the ac-cumulated total contributions to the member at the end of a pre-determined period. The challenge of dishonest stewards increased the reconstitution of these informal groups into formalized groups such as cooperative unions.
These cooperative unions adopted the same modus operandi as the traditional“Susu” saving clubs but their operations were more formalized and offered opportunities for members to take loans in from the contribution. Further cooperative unions were also trained to invest the resources of their members through the now defunct Cooperative Bank. In the early 1990s the Government of Ghana promulgated the Security Industry Law (PNDCL-333) which has subsequently been amended in Security Industry Law (2016) to allow legal framework and government led institution to overseas and ensure transparency in the market due to its susceptibility to abuse. Since then the mutual fund industry as an alternative capital market has witnessed tremendous growth. By the end of 2010, the mutual fund industry in Ghana had become a highly regarded per-forming investment market in Africa in particular and developing markets as a whole. Among the notable mutual fund in Ghana with international appeals include the Data Bank EPACK (first mutual fund in Ghana). Despite its success there are uncertainties as to whether mutual funds in Ghana obtain optimal performance relative to their counterparts in United States, Luxembourg, Ireland, France, Australia, United King-dom, Japan, China and Brazil (Xu et al.2018).).
be used in forecasting superior mutual funds. To be able to deal with such situation, in-terested researchers have adopted and employed various approaches to get predictive variables in order to make forecasting of superior mutual funds.
One of the evaluation methods which have been the focus of a valuable development is Artificial Neural Networks (ANN) since forecasting and calculating abilities of ANN are superior to native algorithms in several angles (Omer et al.,2015). Originally, Back-propagation Neural Networks (BPNN) is an ANN model widely used in finance with a supervised neural network which can analyse continuous data (Pan et al. 2017). En-hanced resilient back propagation neural networks (ERBPNN) are emerging models better in bankruptcy classification than other statistical instruments because it gives an accurate response (Siddiqui et al. 2018). Rezaee et al. 2018) used ERBPNN to predict the bankruptcy risk of major US carriers. ERBPNN was also used by Han et al. (2018) to improve bond rating in the stock market.
Multi-layer perceptron (MLP) is a feedforward neural network with one or more layers between input and output layer. Feed-forward means that data flows in one dir-ection from input to output layer. This type of network is trained with the back-propagation learning algorithm. MLPs are widely used for pattern classification, recognition, prediction and approximation. This was applied in a work done by Afroz et al. (2017) to predict mutual fund performance where they obtain good forecasting results in blended funds, but not for growth funds. Krauss et al. (2017) suggested a hy-brid intelligent system that predicts the failure of firms based on past financial perform-ance data by combining a rough set approach with MLP. There is a positivity of enhanced resilient backpropagation neural networks to integrate fundamental and tech-nical analysis for financial performance prediction et al., 2018).
Aside the fact that ERBPNN is commonly applied in financial literatures, it has its own limitations thus, the cost of training is mostly high, local factors often mislead the results, and its online learning is highly impossible. Other forms of Artificial Neural Network models are designed for classification problems that helps eliminate the chal-lenges of Backpropagation Neural Network, Example is the Self Organization Map (SOM) Pun and Shahi (2018) and Adaptive Resonance Theory (ART) (Kaffash and Marra 2017; Majhi et al. 2018) families. These types of neural model unlike the ERBPNN, can be trained quickly and be put in an unknown pattern without accurate information. However, most of these neural models are unsupervised models features which limit their application in financial fields.
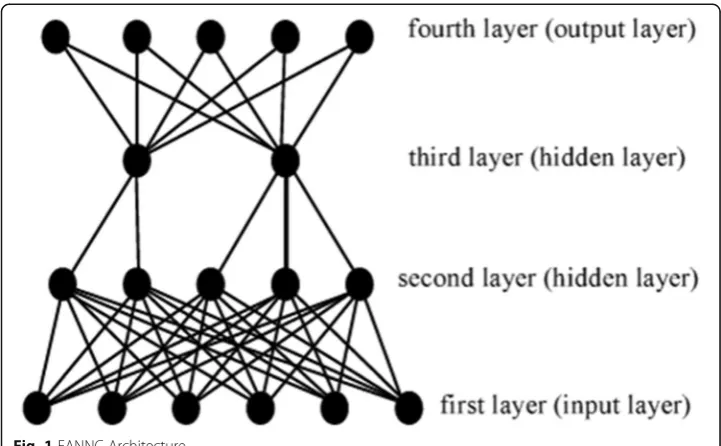
Ding et al. (2018), developed a new approach called FANNC to neural networks. It is suitable in its algorithm particularly when it comes to giving fast and instant response to the continually changing financial market conditions. The method used by Mustafa et al. (2017) is based on adaptive resonance theory (ART) and field theory (FT). ART can per-form online learning and work under a non-stationary world. To enable one-pass learning and perform real-time supervised learning at high speed, Coulomb potential model for electrostatic forces provided the basis for field theory approach to artificial neural net-work. The feedback connections function is to transfer an active signal to each successive layer within the four-layer structured neural network called FANNC to implement com-petition and resonance. This can be seen in illustration below (Fig.1).
second-layer unit defines an attracting basin by a certain responsive centers and the re-sponsive characteristics widths of the Gaussian weights connected with them. The second-layer units are normally used to internally classify inputs, whereas the third-layer units are used internally for output classification. This study is necessary in light of doubtful analytical techniques on financial sector performance in Ghana with the closure and liquidation of several leading Ghanaian institutions within the last year and the need to reclaim customer confidence in the financial sector. We contribute to the current literature by testing an ensemble of more sophisticated, novel, enhanced re-silient analytical neural networks tools to evaluate the performance of mutual funds listed on the Ghana Stock Exchange to obtain robustness of inference. The inputs and outputs instances are discussed in section 2, results and training processes are then provided in section 3, section 4 discussion is based on comparing and analyzing results and finally section 5 is the conclusion of the study.
Materials and Methods Raw Data Preparation
The mutual funds listed on the Ghana Stock Exchange are used for the input instances for our experiment. For accuracy of information from our sample funds and their re-spective fund managers, we selected six continuous historical years that is 2010–2011, 2012–2013 and 2014–2015. The raw data was collected from the Ghana Stock Ex-change database for the selected funds and then calculated to provide the input vari-ables for the models. The following section processed the data on year by year bases for all the selected funds which data is accurate.
Inputs Instances
This study focuses on the fund manager’s momentum strategies and herding behavior as the input variables applied in FANNC and ERBPNN. These variables are used
because many factors that affect mutual fund performance such as the size of the fund and other features of the fund managers have been studied in earlier researches (Anish et al.2018).
Momentum Strategies
Momentum is the best known anomaly in equities. It comes with the premise that, past winners will continue to have a strong return in future, while past losers will also con-tinue to have a weak return in the future. For this reason, it is always the best to pick the future best performing mutual funds. Momentum investors will buy stocks or equi-ties that were past winners and sell those stocks that were past losers (Lang et al. 2018).). Chen and Xu (2018) suggest the following equation:
M¼ 1 T
XT
t¼1
XN
s¼1
~
ωs;t−~ws;t−1
~
Rs;t−kþ1 ð1Þ
Whereω~s;t is the portfolio weight on security s at time t,
~
Rs;t−kþ1 is the return of security s (s = 1,… …,N) from time t-k to time t-k + 1, with k
as the lag index.
The two benchmarks that are most recent times are represented by k = 1 and k = 2. They may be the major facts that affect the momentum of the fund. The study refer M1as lag-1 momentum (L1M) and M2as lag-2 momentum (L2M).
Again, the study crumble the L1M into“buy”and“sell”parts. The equations are:
M1 B¼ 1
T
XT
s¼1
XN
s¼1
X
~ ωs;t>~ωs;t−1
~
ωs;t−~ws;t−1
~
Rs;t−Rs
ð2Þ
M1 S¼ 1
T
XT
s¼1
XN
s¼1
X
~ ωs;t<~ωs;t−1
~
ωs;t−~ws;t−1
~
Rs;t−Rs
ð3Þ
The mean is then subtracted from the return so as to have measures that will be close to zero under no momentum investing. Closely to the lag-1 momentum mea-sures, the‘buy’and‘sell’parts of the lag-2 momentum measure are:
M2 B¼ 1
T
XT
s¼1
XN
s¼1
X
~ ωs;t>~ωs;t−1
~
ωs;t−~ws;t−1
~
Rs;t−Rs
ð4Þ
M2 S¼ 1
T
XT
s¼1
XN
s¼1
X
~ ωs;t<~ωs;t−1
~
ωs;t−~ws;t−1
~
Rs;t−Rs
ð5Þ
Herding Behaviour
take a decision on whether to buy or to sell a particular stock at the same time. It is mathematically presented as:
UHMst¼Ps;t−Pt− E P s;t−Pt ð6Þ
Where Ps,t equals the proportion of the mutual funds that purchase stocks during quarter t, and pt, the expected value of Ps,t is the mean of Ps,t over all stocks during
quartert. UHM has it challenges and among which is that, it cannot most often differ-entiate a manager’s herding between selling and buying the stocks. The second herding measure was introduce and propose by Grinblatt, Sheridan and Wemers (1995) and they named it signed herding measure (SHM) which provides an indication of whether a fund is“following the crowd”or“going against the crowd”for a particular stock dur-ing the specified period. SHM is presented mathematically as:
SHMst¼IstUHMs;t−E IstUHMs;t
ð7Þ
WhereIstis an indicator for‘buy’or‘sell’herding.Istis defined as follows:
Ist= 0 IfjPs;t−Ptj< EjPs;t−Pt:j Ist= 0 IfjPs;t−Ptj> EjPs;t−Ptj
and the mutual fund is a buyer of stock s during quartert,or If−ðPs;t−PtÞ> EjPs;t−Ptj and the fund is a seller of stocks.
Ist=−1 If Ps;t−Pt < EjPs;t−Ptj and the mutual fund is a seller of stock s during quartert,Or If−ðPs;t−PtÞ> EjPs;t−Ptjand the fund is a buyer:
SHM s,t, is set to be zero if fewer than 10 funds trade stock s during time t. If the
number of funds trading stock sis small, no meaningful way can indicate whether the
fund is herding or not. Finally, the herding measure of a mutual fund (FHM) is then calculated by substituting the signed herding measure in place of the stock return in eq. (1).
FHM¼ 1 T
XT
s¼1
Xn
s¼1
~
ωs;t−~ws;t−1
SHMs;t ð8Þ
where ω~s;t is the proportion of the funds trading stocksduring quarter t.
Output Instances
Two sets of output cases were used as performance evaluation models to identify the classification capability and the predictive power of FANNC. The first instance used the Sharpe Index to calculate the output for the same period in where the momentum and herding measures are resolute. This is denoted as the“classification case”. The last instance used the Sharpe Index to calculate the output for the next month right after the period for momentum and herding measures. It is named the “prediction case”. The output instances are calculated as follows:
Classification Sharpe Index
Sharpe Index¼QSσ−Qf
s ð
9Þ
Sharpe Index¼Q
þ
s−Qf
σs ð
10Þ
Where:
QS: The average monthly return for fundSin the calculation period. Qþs: The return of fundSfor the month after the calculation period.
Qf: The average monthly risk-free rate represented by the 1-year CD rate of
commer-cial bank.
σs: The standard deviation of the return of the fundSover the calculation period.
Training and Testing Process
The output and input instance combined which is discussed in the later section are grouped into two parts. Four-fifth of them are used for training and one-fifth are for testing.
Backpropagation Neural Networks
The enhanced resilient back propagation neural networks (ERBPNN) algorithm was programmed first in Matlab and then in C++ to compare consistency of results. Stop criterion, learning coefficient and momentum coefficient was set first before the net-work training. We limited the maximum epochs to 3000 times for the stop criterion as per the experiment it indicated the root mean square error (RMSE) been stabilize by this time. In order for us to determine the learning and momentum coefficients, several pairs were test and the most effective and efficient one amongst the pairs were chosen spontaneously after training. The study reveals an optimization process results in a value of 0.1 for the learning coefficient and a value of 0.9 for the momentum coeffi-cient. The next thing we did was to decide on the activation function. Two choices was offered the software thus the sigmoid function or hyperbolic tangent function. There were no significant differences between the two functions after training and testing but we decided on the sigmoid function since most literatures on ERBPNN have signifi-cantly used it to provide a concrete result for their discussions. Normalization of the in-put and outin-put instances through normalization method was done to improve the accuracy of ERERBPNN.
f Xð Þ ¼s Xs−σ>μ ð11Þ
Where
FANNC
The extant literature does not offer any specific, robust and agreeable commercial package to model FANNC implementation due the distinctiveness of every research variables, its parameterisation and country or industry context. Following earlier works of Ali et al. (2018), Paradi et al. (2018) (that shares closer relationship with the objec-tives of this research), we used C++ to program the FANNC variables. Next we deter-mined and denoted the seven desirable FANNC variables as follows:
θsj- denotes responsive centre,
αsj- denotes responsive characteristic width
δ,−denotes responsive centre adjustment step
Err- denotes bias, the leakage competition threshold in the second layer, the outer layer similarity control coefficient
Errcu- denotes the inner layer similarity control coefficient
As soon as there is a new node generation in the second layer, its related responsive centre is agreed to input component value in current instance beneath training, and the responsive feature measurement is set to be the default value, 0.25. Immediately there is a slight increase in the value, there will also be an increase in the predictive ability of the network; however, excessive increase in the responsive feature measure-ments will decrease the predictive ability. The responsive centre adjustment value step,
δ, touches the learning speed of the network and normally adopts a value between 0 and 1.0. We decided to choose the value to be 0.01 for this study.
The second layer which has the leakage competition thresholds, Err andErrcuhas a similar role played by them, as they all set to determine the number of new nodes that has to be generated in a trained network. When there is an increase in Err, the network tends to adjust its θsj andαsj when rather, it’s supposed to generate new nodes in the second and the third layers. An increase in Errcuwill increase the probability that only
one new node is appended to the second layer and decrease the probability that two new nodes are appended to the second and the third layers simultaneously. The pre-dictability of the model with its ability to have in mind the trained instances is deter-mine by the number of the nodes in the second and the third layers. The predictability in general will decrease and the error from memorizing increases when the node num-ber increases. Kumar (2017) suggests that the leakage competition threshold be 0.8 and the maximum permissible error 0.11. The composition of FANNC is made of seven in-put units and one outin-put unit. The hidden layer units are generated energetically. The study then utilizes the regression function of FANNC to evaluate the performance of the mutual fund. Just as in ERBPNN, input and output instances are regularized by the
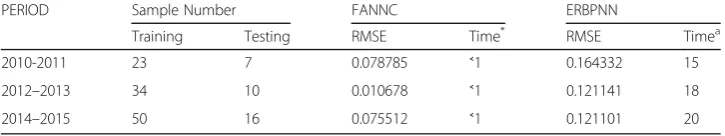
Table 1The Results of Classification test
PERIOD Sample Number FANNC ERBPNN
Training Testing RMSE Time* RMSE Timea
2010-2011 23 7 0.078785 ˂1 0.164332 15
2012–2013 34 10 0.010678 ˂1 0.121141 18
2014–2015 50 16 0.075512 ˂1 0.121101 20
a
standard procedure. In the interim, the selection of testing instances and feeding se-quence are randomly arranged.
Results
The tables below, thus Table1 and2shows the comparison of RMSE and the process-ing time that exist between the FANNC approach and the ERBPNN approach. The classification case and the prediction case, FANNC indicate a clear superiority to ERBPNN.
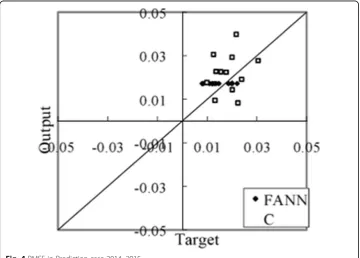
From the tables above, it can be seen that RMSE from FANNC is significantly lower than those from ERBPNN, indicating the significant difference by a factor of two or three. FANNC consume less than 1 second in terms of processing time, whereas ERBPNN in terms of processing time requires at least a minimum of 15 s. The differ-ence in process time will only become more significant if only there will be an increase in the number of samples. The Fig. 2 below shows a scatter diagram of classification RMSE. The points are mostly distributed around the 45 degree line. On the other hand, the points from FANNC are more focus and closer to 45 degree line comparatively to the results generated by ERBPNN. This means that the FANNC approach is highly
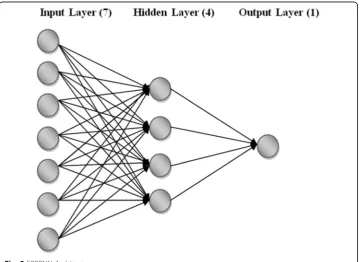
Fig. 2ERBPNN Architecture
Table 2The Results of Prediction Test
PERIOD Sample Number FANNC ERBPNN
Training Testing RMSE Time* RMSE Timea
2010-2011 23 7 0.004062 ˂1 0.006721 15
2012–2013 34 10 0.004188 ˂1 0.012112 18
2014–2015 50 16 0.004204 ˂1 0.021030 20
a
accurate within the Sharpe Index classification than the ERBPNN approach. The results prove similar to the one in the prediction case, as shown in Fig.3and Fig.4. As already indicated, points from FANNC are highly focused and closer to 45 degree line. Adding to the benefits in time consumption and RMSE accuracy, FANNC mostly shows super-iority to ERBPNN for financial presentations in other facets as well. Primarily, FANNC is highly equipped with a real-time learning capability. When a new instance is obtain,
re-training becomes unnecessary, so in practical terms, algorithm can be used to moni-tor a dynamic database. As soon as there is a change in the database, the network has to monitor if the new instance can be classified by any of the existing attraction basin otherwise it will has to manufacture a new one. However, as soon as the trained net-work fails to classify a new input, it will then memorize and reclassify it later after more instances are available.
Conclusion
The idea behind the paper is to do evaluation of mutual fund performance base on it flexibility and responsiveness utilizing FANNC, after which the results is compared with those from ERBPNN based model. FANNC is a subset of neural network which is newly developed and it combines the characteristics of ART and field theory. In our test, apart from the fact that FANNC does not only require significantly lesser time in evaluating mutual fund performance than the ERBPNN approach but it also has super-iority in terms of RMSE record. The results holds for both classification problems and prediction problems. Additionally, the algorithm nature of the FANNC guarantees fast processing time and it makes on-line learning much easier thus making the FANNC motive for financial presentations connecting enormous volumes of data and a repeti-tive updates.
Abbreviations
ART:Adaptive Resonance Theory; ERBPNN: Enhanced Resilient Backpropagation Neural Network; FANNC: Fast Adaptive Neural Network Classifier; GSE: Ghana Stock Exchange; MLP: Multi Layer Perception; RMS: Root Mean Square
Acknowledgements
We are grateful to the National Natural Science Foundation of China Number 71371087 for their support for the project.
Funding
Not Applicable
Availability of data and materials
Ten mutual funds registered and operating on the Ghana Stock Exchange (GSE) were purposively selected; comprising four categories, with four balanced funds, two money market funds and four equity funds.
Secondary data on the funds were collected and collated from the asset management companies’websites and on Annual Report Ghana.
Funds selected had been in operation for at least 5 years, with a total asset under management (AUM) of about 39.8 million Ghana cedis as at the end of the 2015 financial year.
Authors’contributions
YK He Supervised the Project and Sequentially aligned the parts of research paper. MOA Drafted the full manuscript after the other authors have completed their work. HAA Collected Data and Conducted the Data Analysis. XH Edited the paper and realigned inconsistent parts of the paper. PA Designed the Econometric Model and Conducted Data Analysis. All Authors read and approved the final draft of the paper.
Competing interests
The authors declare that they have no competing interests.
Publisher’s Note
Springer Nature remains neutral with regard to jurisdictional claims in published maps and institutional affiliations.
Author details
1
School of Finance and Economics, Jiangsu University, 301 Xuefu Road, Zhenjiang, Jiangsu, People’s Republic of China.
Received: 6 May 2018 Accepted: 21 January 2019
References
Afroz Z, Das SR, Mishra D, Patnaik S (2017) Mutual Fund Performance Analysis Using Nature Inspired Optimization Techniques: A Critical Review. In: International Conference on Intelligent and Interactive Systems and Applications. Springer, Cham, pp 734–745
Ali SS, Mubeen M, Hussain A (2018) Prediction of stock performance by using logistic regression model: evidence from Pakistan stock exchange (PSX). In: Patron of the Conference, p 15
Anish CM, Majhi B, Majhi R (2018) A Novel Hybrid Model Using RBF and PSO for Net Asset Value Prediction. In: Intelligent Systems: Concepts, Methodologies, Tools, and Applications. IGI Global, pp 1031–1049
Chattopadhyay M, Garg AK, Mitra SK (2018) Herding by Foreign Institutional Investors: An Evidential Exploration for Persistence and Predictability. J Behav Finance 19(1):73–88
Chen T, Xu W (2018) Post-evaluation on financial support highway traffic project based on BP neural network algorithm. J Discret Math Sci Cryptogr 21(4):869–879
Ding Y, Liu W, Bian J, Zhang D, Liu TY (2018) Investor-Imitator: A Framework for Trading Knowledge Extraction. In: Proceedings of the 24th ACM SIGKDD International Conference on Knowledge Discovery & Data Mining. ACM, pp 1310–1319
El Ghoul S, Karoui A (2017) Does corporate social responsibility affect mutual fund performance and flows? J Bank Financ 77:53–63 Eldering CA, Igoe PT (2010) U.S. Patent No. 7,689,682. U.S. Patent and Trademark Office, Washington, DC
Grinblatt M, Titman S, Wermers R (1995) Momentum investment strategies, portfolio performance, and herding: A study of mutual fund behavior. Am Econ Rev:1088–1105
Han SZ, Huang LH, Zhou YY, Liu ZL (2018) Mixed chaotic FOA with GRNN to construction of a mutual fund forecasting model. Cogn Syst Res 52:380–386
Ibikunle G, Steffen T (2017) European green mutual fund performance: A comparative analysis with their conventional and black peers. J Bus Ethics 145(2):337–355
Kaffash S, Marra M (2017) Data envelopment analysis in financial services: a citations network analysis of banks, insurance companies and money market funds. Ann Oper Res 253(1):307–344
Krauss C, Do XA, Huck N (2017) Deep neural networks, gradient-boosted trees, random forests: Statistical arbitrage on the S&P 500. Eur J Oper Res 259(2):689–702
Kumar M (2017) Exploring a Risk Adjusted Return on Capital Model for the Performance and Persistence of the Indian Equity Mutual Funds. Int J Risk Contingency Manag 6(2):18–34
Lakonishok J, Shleifer A, Vishny RW (1992) The impact of institutional trading on stock prices. J Financial Econ 32(1):23–43 Lang K, Zhang M, Yuan Y, Yue X (2018) Short-term load forecasting based on multivariate time series prediction and
weighted neural network with random weights and kernels. Clust Comput:1–9
Majhi B, Anish CM, Majhi R (2018) On development of novel hybrid and robust adaptive models for net asset value prediction. J King Saud Univ Comput Inf Sci
Mustafa T, Zhou L, Abdullahi ZJ, Nisar N (2017) Stimulating Work Ethics among Healthcare Professionals: A Challenge to Healthcare Human Resource Development in Pakistan. Can J Appl Sci Technol 5(2)
Omer G, Mutanga O, Abdel-Rahman EM, Adam E (2015) Performance of support vector machines and artificial neural network for mapping endangered tree species using WorldView-2 data in Dukuduku forest, South Africa. IEEE J Sel Top Appl Earth Obs Remote Sens 8(10):4825–4840
Pan WT, Shao YM, Yang TT, Luo SH, Li XW (2017) Prediction of mutual fund net value using Backpropagation Neural Network. In: Big Data Analysis (ICBDA), 2017 IEEE 2nd International Conference on (pp. 198–201). IEEE
Paradi JC, Sherman HD, Tam FK (2018) Survey of Other Financial Services Literature. In: Data Envelopment Analysis in the Financial Services Industry. Springer, Cham, pp 51–67
Pun TB, Shahi TB (2018) Nepal Stock Exchange Prediction Using Support Vector Regression and Neural Networks. In: 2018 Second International Conference on Advances in Electronics, Computers and Communications (ICAECC). IEEE, pp 1–6 Rezaee MJ, Jozmaleki M, Valipour M (2018) Integrating dynamic fuzzy C-means, data envelopment analysis and artificial
neural network to online prediction performance of companies in stock exchange. Physica A 489:78–93
Siddiqui MU, Abbas A, AbdurRehman SM, Jawed A, Rafi M (2018) Comparison of garch model and artificial neural network for mutual fund's growth prediction. In: Computing, Mathematics and Engineering Technologies (iCoMET), 2018 International Conference on (pp. 1–7). IEEE
Song Q, Liu A, Yang SY (2017) Stock portfolio selection using learning-to-rank algorithms with news sentiment. Neurocomputing 264:20–28
Xu W, Chen Y, Coleman C, Coleman TF (2018) Moment matching machine learning methods for risk management of large variable annuity portfolios. J Econ Dyn Control 87:1–20