O R I G I N A L A R T I C L E
Open Access
Optimization of pulmonary emphysema
quantification on CT scans of COPD
patients using hybrid iterative and post
processing techniques: correlation with
pulmonary function tests
E. de Boer
1, I. M. Nijholt
1, S. Jansen
1, M. A. Edens
2, S. Walen
3, J. W. K. van den Berg
3and M. F. Boomsma
1*Abstract
Objectives:The aim of this study was to assess the effect of hybrid iterative reconstruction and post processing on emphysema quantification in low-dose CT scans of COPD patients using pulmonary function tests (PFT) as a reference.
Methods:CT scans of 23 COPD patients diagnosed with GOLD I or higher were reconstructed with iDose4level 1
to 7 in IntelliSpace Portal (ISP) 6 and 7. ISP7 was used with and without specific denoising filter for COPD. The extent of emphysema was measured as percentage of lung voxels with attenuation <−950 Hounsfield units (%LAA-950). The correlation between %LAA-950 and PFT, age, BMI, pack years, and the Clinical COPD Questionnaire (CCQ) and Medical Research Council dyspnea scale (MRC) was determined.
Results:Denoising significantly reduced %LAA-950 as was demonstrated by lower %LAA-950 in ISP7 with
denoising filter and a significant reduction in %LAA-950 with higher iDose4levels. All PFT except forced vital capacity (FVC) were significantly inversely correlated with %LAA-950. There was a trend toward a stronger correlation at higher iDose4levels. %LAA-950 was also significantly correlated with BMI, GOLD class, and CCQ scores.
Conclusions:Our study showed that hybrid iterative reconstruction and use of post processing denoising can optimize the use of emphysema quantification in CT scans as a complimentary diagnostic tool to stage COPD in addition to PFT.
Keywords:Chronic Obstructive Pulmonary Disease, Emphysema, Respiratory function tests, Computed
Tomography, Computer assisted image processing
Key points
Denoising reduces the extent of emphysema
measured on CT scans.
Correlation between emphysema and pulmonary
function tests increases with higher iDose4levels.
Emphysema is also significantly correlated with
BMI, GOLD class, and CCQ scores.
Introduction
Chronic obstructive pulmonary disease (COPD) is glo-bally one of the main causes of death. The amount of people suffering from the disease is often underesti-mated because not all patients with airway symptoms seek medical attention [1]. More attention for early diag-nosis of COPD is needed, especially because there is a higher prevalence of pulmonary cancer in COPD
© The Author(s). 2019Open AccessThis article is distributed under the terms of the Creative Commons Attribution 4.0 International License (http://creativecommons.org/licenses/by/4.0/), which permits unrestricted use, distribution, and reproduction in any medium, provided you give appropriate credit to the original author(s) and the source, provide a link to the Creative Commons license, and indicate if changes were made.
* Correspondence:[email protected]
1Department of Radiology, Isala hospital, Dr. van Heesweg 2, 8025 AB Zwolle, The Netherlands
patients than in patients without COPD [2]. Moreover, timely treatment may delay disease progression [3].
Currently, COPD is mainly diagnosed based on detec-tion of irreversible airflow limitadetec-tion in pulmonary func-tion tests (PFT). Airflow limitafunc-tion is caused by airway narrowing (through inflammation or mucus) and/or em-physema (loss of recoil). Clinically, most if not all COPD patients have combined features of emphysema and chronic bronchitis. Very rarely one encounters a patient with emphysema but little or no airflow limitation [4]. It was shown that the extent of emphysema correlates strongly and significantly with spirometry in quantitative computed tomography (CT) measurements [5]. There-fore, emphysema quantification on CT scans may be an important complimentary tool for the diagnosis and sta-ging of COPD.
To reduce the radiation burden related to CT imaging, advanced iterative reconstruction (IR) techniques during image processing became available that can maintain CT image quality at lower radiation doses compared to fil-tered back projection (FBP), the standard of reference for reconstruction of CT images. These advanced IR techniques improve subjective as well as objective image quality by reducing noise and artifacts.
In our hospital, we use the hybrid IR algorithm‘iDose4’ (Philips Medical Systems, Best, the Netherlands). This al-gorithm first identifies and corrects the noisiest raw CT data. These corrected raw data are reconstructed, and
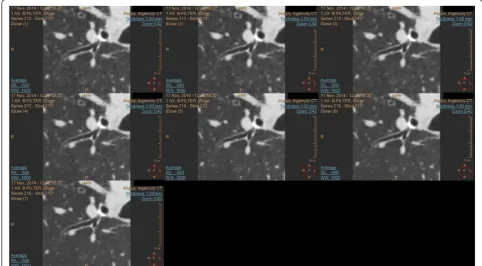
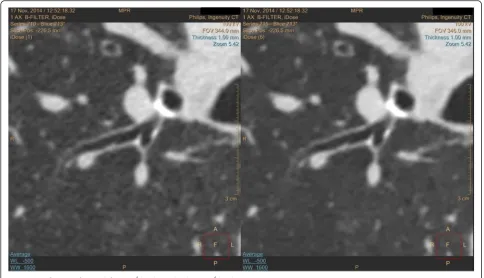
subsequently uncorrelated noise in the image domain is it-eratively decreased. The level of noise reduction can be adjusted by choosing one of the seven levels (with level 1 corresponding to the least noise reduction, and level 7 to the strongest noise reduction; Figs.1and2) [6–8].
In this study, we aimed to determine which iDose4 level resulted in better emphysema quantification in COPD patients using the advanced visualization plat-form IntelliSpace Portal (ISP) version 6 and 7 (Philips). The correlation with PFT was used as measure of better emphysema quantification.
In ISP7, the COPD advanced visualization application has an optional denoising filter. We also investigated whether this filter could further optimize emphysema quantification in COPD patients.
Materials and methods Study population
We included 23 patients (15 males and 8 females) over 45 years of age that visited the Pulmonary department of our hospital between October 2014 and January 2015. These patients were diagnosed with COPD on the basis of a complete diagnostic path for new COPD patients. This diagnostic path consisted of PFT, questionnaires, and a CT scan. In all patients, the interval between the CT scan and the pulmonary function tests was not more than 6 months. All subjects were asked to fill in the vali-dated Clinical COPD Questionnaire (CCQ). The
10-Fig. 1Magnification of the lung parenchyma in a CT scan with the seven different iDose4levels in ISP6: upper row iDose4level 1 to 3; middle
row: iDose4level 4 to 6; bottom: iDose4level 7
items of the CCQ comprise three subdomains: symp-toms, functional state, and mental state. Items are scored on a Likert scale (range 0–6). The final score is calcu-lated by dividing the sum of all items by 10. Higher scores indicate a worse health status. The Medical Re-search Council (MRC) dyspnea scale was used to assess the level of disability. It consists of five statements (grades 0–4). The patient is asked which statement de-scribes his/her condition best. Grade 4 represents the most severe category [9]. In addition, the body mass index (BMI), the pack years of smoking, and the number of packages weekly (pack years/52) were assessed. The number of pack years is defined as packs smoked per day × years as a smoker. A pack is considered to contain 20 cigarettes.
CT data acquisition and image reconstruction
CT examinations were performed using a 64-detector CT (Brilliance iCT, Philips Medical Systems, Best, The Netherlands). All scans were made in supine position with full inspiration breath-hold without spirometric gating. Imaging parameters were kept constant in helical imaging mode: collimation 64 × 0.625 mm (with flying focal spot), 0.5 s rotation time, tube voltage of 100 kVp, tube current of 150 mAs, and pitch 0.798. The effective dose was 1.98 mSv, DLP was 165 mGy/cm, and CTDIvol was 4.2 mGy. Contrast enhancement was not performed and tube current modulation was not used and images
were reconstructed at 0.9 mm thickness with 0.45-mm increment using a standard kernel in a 512 × 512-pixel matrix.
Raw CT data of the study objects were reconstructed using iterative reconstruction (IR; iDose4level 1–7; Phi-lips Medical Systems , Best, the Netherlands).
Quantification of emphysema
Images were analyzed with the COPD advanced visualization application in ISP version 6 and 7 (Philips Medical Systems, Best, The Netherlands). We used ISP7 with and without de-noising filter. The extent of emphy-sema of the entire lung was in all batches quantified by the percent of lung voxels with attenuation < −950 Hounsfield units (HU) (%LAA-950). We used specialized software to automatically divide the lungs from the chest wall, mediastinum diaphragm, and airways in the CT im-ages of reconstructed algorithms [10].
Pulmonary function tests
Global Lung Initiative equations 2012 (GLI) as reference values [14]. FEV1/FVC ratios were calculated and expressed as percentages.
Statistical analysis
Statistical analysis was performed using statistical soft-ware (IBM SPSS Statistics, Release 22.0: IBM Corp, Armonk NY). Categorical data were presented asn (%). Continuous data were checked for normality. Normally distributed data were reported as mean ± standard devi-ation (SD), data with a skewed distribution as median (25th and 75th percentile). Repeated measures ANOVA with ISP (three levels) and iDose4(seven levels) as within subject factors was used to determine whether %LAA-950 was significantly different between the ISP versions and the seven iDose4levels.
Spearman correlation analysis for nonparametric data was performed for each iDose4level in ISP6 and 7 with and without denoising filter to determine the correlation between %LAA-950 and age, BMI, GOLD, pulmonary function tests, or scores on the CCQ and MRC.Pvalues < 0.05 were considered statistically significant.
Results
The 23 COPD patients (15 males and eight females) in-cluded in this study had an average age of 67.8 ± 9.9 years (Table 1). Median body mass index (BMI) was 27.7 kg/ m2 (21.8–29.6). The majority of the patients was classi-fied as GOLD II (n= 10, 43.6%; Table 1). Fifteen of the 23 patients (65.2%) were smokers. The median pack years of all smokers was 30 (20–40) and the median number of packages weekly 0.58 (0.38–0.77). The me-dian pack years of the complete study population was 20.0 (0.0–38.0) and the median number of packages weekly 0.38 (0–0.78). PFT showed impaired lung func-tion as indicated by a mean FEV1% predicted of 54.2% (± 22.5), and mean FEV1/FVC ratio of 0.47 (± 0.15) (Table1). The median interval between the CT scan and the pulmonary function tests was 13 days (0–31).
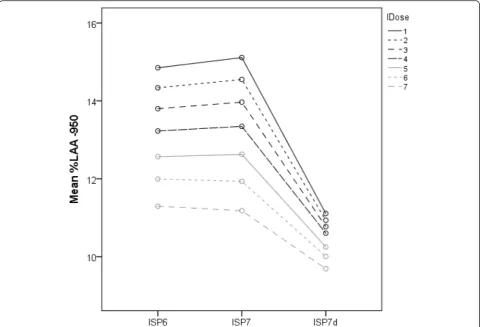
We compared the %LAA-950 at several iDose4levels of two ISP software versions: ISP6 and ISP7. ISP7 was used with and without denoising filter. Using repeated measures ANOVA, we found a significant difference in %LAA-950 between groups on the level of ISP and iDose4 (ISP p< 0.001, iDose4 p< 0.0001) and a strong interaction effect of these two within subjects factors (p< 0.0001) (Fig.3). %LAA-950 significantly decreased with higher iDose4levels for both ISP6 and 7 (with and without denoising) (p< 0.001; Figs.3and4). In addition, use of the denoising tool in ISP7 resulted in a significantly lower % LAA-950 for all levels when compared to ISP6 and ISP7 without denoising (Figs.3and4).
We did not observe a significant correlation between %LAA-950 and age, pack years, or MRC scores in all ISP
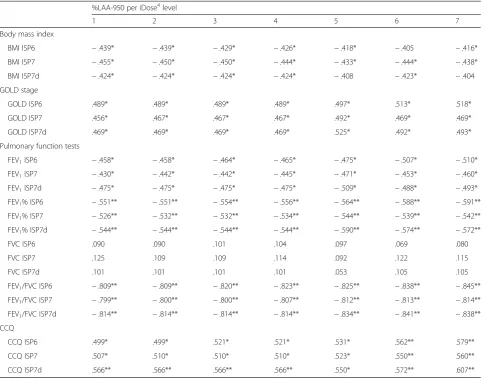
versions. There was a moderate inverse correlation be-tween %LAA-950 and BMI. GOLD stage and CCQ scores were positively correlated with %LAA-950 (Table2).
There was no significant correlation between %LAA-950 and FVC. However, %LAA-%LAA-950 showed significant inverse correlations with the other three spirometry measures; FEV1, FEV1% predicted, and FEV1/FVC. The strongest correlation was found with FEV1/FVC. For all three measures, the negative correlation coefficient slightly increased with higher iDose4levels in all ISP ver-sions. However, there was no difference in correlation coefficients between ISP6, ISP7 with and without denois-ing filter per level (Table2).
Table 1Characteristics and demographics of the study participants
Demographics
Sex (male, %) 15 (65.2%)
Age (mean in years, SD) 67.8 (± 9.9)
Anthropometry
BMI (median in kg/m2, p25–p75) 27.7 (21.8–29.6)
Smoking
Smoker/former smoker (yes, %) 15 (65.2%)
Pack years (median, p25–p75) 20.0 (0.0–38.0)
Packages weekly (median, p25–p75) 0.38 (0–0.78)
Pulmonary function
GOLD stage (n, %)
1 3 (13.0%)
2 10 (43.5%)
3 6 (26.1%)
4 4 (17.4%)
FEV1(mean in L, SD) 1.57 (± 0.72)
FEV1% pred (mean %, SD) 54.2 (± 22.5)
FVC (mean in L, SD) 3.35 (± 1.12)
FEV1/FVC (mean, SD) 0.47 (± 0.15)
Questionnaires
MRCn= 21a
0 3 (14.3%)
1 8 (38.1%)
2 1 (4.8%)
3 5 (23.8%)
4 4 (19.0%)
CCQn= 21a 2.28 (± 1.09)
BMIbody mass index,pack yearspacks smoked per day × years as a smoker, packages weeklypack years/52,GOLDglobal initiative for chronic obstructive pulmonary disease,FEV1forced expiratory volume in 1 s,FEV1%predforced
expiratory volume in the first second as percentage of predicted,FVCforced vital capacity,FEV1/FVCratio of FEV1divided by the forced vital capacity,MRC
Medical Research Council dyspnea scale,CCQClinical COPD Questionnaire
a
Two participants did not fill in the MRC and CCQ
Discussion
In this study, we aimed to optimize emphysema quantifi-cation in CT scans of COPD patients using hybrid itera-tive techniques and post processing. PFT outcomes, which are currently the standard for staging COPD, were used as a reference. We compared the results of two ISP software versions; ISP6 and ISP7 (with and without spe-cific denoising filter for COPD).
Previous studies already showed that dose reduction, post processing, and IR can affect the quantitative meas-urement of emphysema [15, 16]. To the best of our knowledge, this is the first study that showed that the hybrid IR levels of iDose4have a significant influence on the amount of emphysema that is quantified by means of post processing in a low dose scan. The amount of emphysema quantified significantly reduced with higher iDose4levels. The specific denoising filter in the COPD application of the ISP7 module resulted in even lower emphysema quantification at all 7 iDose4 levels when compared to ISP6 and ISP7 without denoising filter. Denoising obtained at higher IR levels may have an ef-fect on the final noise statistics of the data, which in turn
influences the quantification obtained with a fixed threshold. Other studies also tested post processing of all seven iDose4levels on CT scans of phantoms and pa-tients but only looked at technical variables, e.g., subject-ive image quality, the contrast-to-noise ratio (CNR), and signal-to-noise ratio (SNR). They did not investigate the effect on tissue quantification [17, 18]. A study on the effects of iDose4on solid pulmonary nodules did not re-port any differences between iDose4 levels 2, 4, and 6 [19].
reconstruction result in differences in noise reduction which make it difficult to directly compare the amounts of emphysema quantified between studies [21].
In order to determine which hybrid IR iDose4 level would be best for the quantification of emphysema as diagnostic aid for the staging of COPD, the results of the two ISP software versions: ISP6 and ISP7 (with and without denoising filter for COPD) were compared. We correlated the %LAA-950 measured at different iDose4 levels in these two software versions with FEV1, FEV1% predicted, FVC, and FEV1/FVC, which are commonly used in diagnosing and staging COPD. We observed a trend toward a stronger inverse correlation of %LAA-950 with FEV1, FEV1% predicted, and FEV1/FVC at higher iDose4 levels. The strongest inverse correlation was found between %LAA-950 and FEV1/FVC. This is consistent with the findings of D’Anna and colleagues who also reported that percentage of emphysema was in-versely correlated with the FEV1/FVC ratio in patients with stable COPD of different severity [22]. %LAA-950 was not correlated with FVC.
From our finding that the correlations did not differ between ISP6 and ISP7 with and without denoising fil-ter, we conclude that in clinical practice, both software versions would be equally suitable for diagnosing and staging COPD. However, this does not rule out that
other IR techniques and ISP software versions may cor-relate better with PFT and may thus further improve diagnosing and staging of COPD.
Xie and colleagues performed a large meta-analysis in 2012 to determine the correlation between airflow ob-struction and emphysema quantification on CT scans of COPD patients [23]. They also found significant correla-tions between airflow obstruction parameters in PFT and CT measurements of emphysema. The correlation coefficients that we found in our study were comparable to the pooled correlation coefficients reported in this systematic review [23].
In our study, the extent of emphysema was also in-versely correlated with BMI. The finding that COPD pa-tients with the highest emphysema percentages had a slightly lower BMI may be partly explained by the smok-ing behavior of these patients. Nicotine is known to sup-press appetite which can result in lower nutrient intake in smokers. Moreover, smoking increases energy metab-olism at rest which may also contribute to lower BMI in COPD patients [24]. As was expected, the extent of em-physema correlated with respiratory symptoms, scored via CCQ.
Our study is limited by the small patient population of 23 patients. However, it proved to be sufficient to detect significant differences and correlations, although the Fig. 4Boxplot of %LAA-950 for the various iDose4levels of ISP6 and ISP7 with and without denoising (n= 22, one patient had missing values). %LAA-950percentage of lung voxels with attenuation <−950 Hounsfield units,ISPIntelliSpace Portal
spectrum of emphysema amount was limited. Our data should be confirmed in a larger study population. More-over, we did not compare the extent of emphysema with diffusion capacity. Previous studies showed a correlation between these variables [22].
The ISP software is continuously improved and new versions are released. Moreover, other emphysema quantification software has become available. These programs and versions start to find their way into clinical trials and routine care. In general, the final image that is used by a certain post processing quan-tification tool depends on the scanner, radiation dose, and the reconstruction technique. Potential differences in the amount of emphysema measured using various emphysema quantification programs and versions even in CT scans of the same patient may lead to differ-ences in interpretation and ultimately to considerable
differences in patient selection and management. The use of a phantom with known reference values would be one of the best ways to standardize emphysema quantification and make it even more suitable as a complimentary diagnostic tool to stage COPD.
Conclusion
In this within-patients study, we showed that hybrid IR and post processing denoising both affect emphysema quantification in CT scans. The amount of emphysema quantified correlates well with outcomes of PFT inde-pent of the hybrid IR and post processing denoising ap-plied. Thus, CT scans may be used as additional diagnostic tool to stage COPD.
Abbreviations
%LAA-950:Percentage of lung voxels with attenuation <−950 Hounsfield unit; BMI: Body mass index; CCQ: Clinical COPD questionnaire; CNR:
Contrast-Table 2Spearman correlation coefficients
%LAA-950 per iDose4level
1 2 3 4 5 6 7
Body mass index
BMI ISP6 −.439* −.439* −.429* −.426* −.418* −.405 −.416*
BMI ISP7 −.455* −.450* −.450* −.444* −.433* −.444* −.438*
BMI ISP7d −.424* −.424* −.424* −.424* −.408 −.423* −.404
GOLD stage
GOLD ISP6 .489* .489* .489* .489* .497* .513* .518*
GOLD ISP7 .456* .467* .467* .467* .492* .469* .469*
GOLD ISP7d .469* .469* .469* .469* .525* .492* .493*
Pulmonary function tests
FEV1ISP6 −.458* −.458* −.464* −.465* −.475* −.507* −.510*
FEV1ISP7 −.430* −.442* −.442* −.445* −.471* −.453* −.460*
FEV1ISP7d −.475* −.475* −.475* −.475* −.509* −.488* −.493*
FEV1% ISP6 −.551** −.551** −.554** −.556** −.564** −.588** −.591**
FEV1% ISP7 −.526** −.532** −.532** −.534** −.544** −.539** −.542**
FEV1% ISP7d −.544** −.544** −.544** −.544** −.590** −.574** −.572**
FVC ISP6 .090 .090 .101 .104 .097 .069 .080
FVC ISP7 .125 .109 .109 .114 .092 .122 .115
FVC ISP7d .101 .101 .101 .101 .053 .105 .105
FEV1/FVC ISP6 −.809** −.809** −.820** −.823** −.825** −.838** −.845**
FEV1/FVC ISP7 −.799** −.800** −.800** −.807** −.812** −.813** −.814**
FEV1/FVC ISP7d −.814** −.814** −.814** −.814** −.834** −.841** −.838**
CCQ
CCQ ISP6 .499* .499* .521* .521* .531* .562** .579**
CCQ ISP7 .507* .510* .510* .510* .523* .550** .560**
CCQ ISP7d .566** .566** .566** .566** .550* .572** .607**
ISPIntelliSpace Portal,ISP7dISP7 with denoising filter, %LAA-950percentage of lung voxels with attenuation <−950 HU,BMIbody mass index,FEV1forced expiratory volume in 1 s,FEV1%predforced expiratory volume in the first second as percentage of predicted,FVCfunctional vital capacity,CCQClinical COPD Questionnaire scores
to-noise ratio; COPD: Chronic obstructive pulmonary disease; CT: Computed tomography; CTDIvol: Volume CT dose index; DLP: Dose-length-product; ERS: European Respiratory Society; FBP: Filtered back projection; FEV1: Forced
expiratory volume in the first second; FEV1% pred: Forced expiratory volume
in the first second as percentage of predicted; FEV1/FVC: Ratio of the forced
expiratory volume in the first second divided by the forced vital capacity; FVC: Forced vital capacity; GLI: Global lung initiative equations; GOLD: Global initiative for chronic Obstructive Pulmonary Disease; HU: Hounsfield unit; IR: Iterative reconstruction; ISP: IntelliSpace Portal; MRC: Medical Research Council dyspnea scale; Pack years: Calculated as packs per day times years as a smoker; PFT: Pulmonary function tests
Acknowledgements
We would like to thank Robbert Smit, radiological technician with specialization in CT for his help in conducting this study.
Authors’contributions
EB made substantial contribution to design, interpretation of data, and writing of the manuscript. IN analyzed and interpreted the patient data and was a contributor in writing the manuscript. SJ had a major contribution in the collection of data. ME was involved in the analysis and interpretation of data. SW and JB had substantial contribution to the design of the study, facilitated the collection of data, and were involved in interpretation of data. MB was responsible for the design of the study, interpretation of the data, and revised the manuscript. All authors read and approved the final manuscript.
Funding No funding.
Availability of data and materials
The data that support the findings of this study are available from the corresponding author upon reasonable request.
Ethics approval and consent to participate
This study was approved by the local medical ethical committee (reference number 14.10132) and all study participants gave written informed consent.
Consent for publication Not applicable.
Competing interests
The authors declare that they have no competing interests.
Author details
1Department of Radiology, Isala hospital, Dr. van Heesweg 2, 8025 AB Zwolle, The Netherlands.2Department of Innovation and Science, Isala hospital, Zwolle, The Netherlands.3Department of Pulmonology, Isala hospital, Zwolle, The Netherlands.
Received: 13 April 2019 Accepted: 9 August 2019
References
1. Boezen HM, Postma DS, Poos MJJC (2013) Hoe vaak komt COPD voor en hoeveel mensen Kompas Volksgezondheid. Bilthoven: RIVM.
2. de Torres JP, Marin JM, Casanova C et al (2011) Lung cancer in patients with chronic obstructive pulmonary disease—incidence and predicting factors. Am J Respir Crit Care Med 184:913–919
3. Celli BR, Thomas NE, Anderson JA et al (2008) Effect of pharmacotherapy on rate of decline of lung function in chronic obstructive pulmonary disease: results from the TORCH study. Am J Respir Crit Care Med 178:332–338 4. Lutchmedial SM, Creed WG, Moore AJ, Walsh RR, Gentchos GE, Kaminsky
DA (2015) How common is airflow limitation in patients with emphysema on CT scan of the chest? Chest 148:176–184
5. Schroeder JD, McKenzie AS, Zach JA et al (2013) Relationships between airflow obstruction and quantitative CT measurements of emphysema, air trapping, and airways in subjects with and without chronic obstructive pulmonary disease. AJR Am J Roentgenol 201:W460–W470
6. Funama Y, Taguchi K, Utsunomiya D et al (2011) Combination of a low-tube-voltage technique with hybrid iterative reconstruction (iDose4)
algorithm at coronary computed tomographic angiography. J Comput Assist Tomogr 35:480–485
7. Habets J, Symersky P, de Mol BA, Mali WP, Leiner T, Budde RP (2012) A novel iterative reconstruction algorithm allows reduced dose multidetector-row CT imaging of mechanical prosthetic heart valves. Int J Cardiovasc Imaging 28:1567–1575
8. Noel PB, Fingerle AA, Renger B, Münzel D, Rummeny EJ, Dobritz M (2011) Initial performance characterization of a clinical noise-suppressing reconstruction algorithm for MDCT. AJR Am J Roentgenol 197:1404–1409 9. van der Molen T, Willemse BW, Schokker S, ten Hacken NH, Postma DS,
Juniper EF (2003) Development, validity and responsiveness of the clinical COPD questionnaire. Health Qual Life Outcomes 1:13
10. van Rikxoort EM, de Hoop B, Viergever MA, Prokop M, van Ginneken B (2009) Automatic lung segmentation from thoracic computed tomography scans using a hybrid approach with error detection. Med Phys 36:2934–2947 11. Miller MR, Crapo R, Hankinson J et al (2005) General considerations for lung
function testing. Eur Respir J 26:153–161
12. Miller MR, Hankinson J, Brusasco V et al (2005) Standardisation of spirometry. Eur Respir J 26:319–338
13. Wanger J, Clausen JL, Coates A et al (2005) Standardisation of the measurement of lung volumes. Eur Respir J 26:511–522
14. Quanjer PH, Stanojevic S, Cole TJ et al (2012) Multi-ethnic reference values for spirometry for the 3-95-yr age range: the global lung function 2012 equations. Eur Respir J 40:1324–1343
15. Choo JY, Goo JM, Lee CH, Park CM, Park SJ, Shim MS (2014) Quantitative analysis of emphysema and airway measurements according to iterative reconstruction algorithms: comparison of filtered back projection, adaptive statistical iterative reconstruction and model-based iterative reconstruction. Eur Radiol 24:799–806
16. den Harder AM, de Boer E, Lagerweij SJ et al (2018) Emphysema quantification using chest CT: influence of radiation dose reduction and reconstruction technique. Eur Radiol Exp 2:30-018–0064-3
17. Kordolaimi SD, Saradeas I, Ploussi A, Pantos I, Argentos S, Efstathopoulos EP (2014) Introduction of an effective method for the optimization of CT protocols using iterative reconstruction algorithms: comparison with patient data. AJR Am J Roentgenol 203:W434–W439
18. Song JS, Lee JM, Sohn JY, Yoon JH, Han JK, Choi BI (2015) Hybrid iterative reconstruction technique for liver CT scans for image noise reduction and image quality improvement: evaluation of the optimal iterative reconstruction strengths. Radiol Med 120:259–267
19. Willemink MJ, Borstlap J, Takx RA et al (2013) The effects of computed tomography with iterative reconstruction on solid pulmonary nodule volume quantification. PLoS One 8:e58053
20. Hague CJ, Krowchuk N, Alhassan D et al (2014) Qualitative and quantitative assessment of smoking-related lung disease: effect of iterative
reconstruction on low-dose computed tomographic examinations. J Thorac Imaging 29:350–356
21. Willemink MJ, de Jong PA, Leiner T et al (2013) Iterative reconstruction techniques for computed tomography part 1: technical principles. Eur Radiol 23:1623–1631
22. D'Anna SE, Asnaghi R, Caramori G et al (2012) High-resolution computed tomography quantitation of emphysema is correlated with selected lung function values in stable COPD. Respiration 83:383–390
23. Xie X, de Jong PA, Oudkerk M et al (2012) Morphological measurements in computed tomography correlate with airflow obstruction in chronic obstructive pulmonary disease: systematic review and meta-analysis. Eur Radiol 22:2085–2093
24. Vanfleteren LE, Lamprecht B, Studnicka M et al (2016) Body mass index and chronic airflow limitation in a worldwide population-based study. Chron Respir Dis 13:90–101
Publisher’s Note
Springer Nature remains neutral with regard to jurisdictional claims in published maps and institutional affiliations.