http: // www.ijrtsm.com© International Journal of Recent Technology Science & Management 1
IJRTSM
INTERNATIONAL JOURNAL OF RECENT TECHNOLOGY SCIENCE & MANAGEMENT
“Crack Detection In Beams Using Experimental Model Data And Finite Element
Model”
Mayank Sharma
1,
Vishal Soni
21M. Tech Scholar, Mechanical Engineering, Oriental Institute of Science & Technology Bhopal,(M.P.), India 2Assistant Professor, Mechanical Mechanical Engineering, Oriental Institute of Science & Technology Bhopal,(M.P.), India
ABSTRACT
In this paper, an analytical, as well as experimental approach to the crack detection in cantilever beamsby vibration analysis is established. An experimental setup is designed in which a cracked cantilever beam isexcited by a hammer and the response is obtained using an accelerometer attached to the beam. To avoidnon-linearity, it is assumed that the crack is always open. To identify the crack, contours of the normalizedfrequency in terms of the normalized crack depth and location are plotted. The intersection of contourswith the constant modal natural frequency planes is used to relate the crack location and depth.A minimization approach is employed for identifying the cracked element within the cantilever beam. The proposed method is based on measured frequencies and mode shapes of the beam.
KEYWORDS: Crack detection; Vibration analysis; Cantilever beam; Finite element method
I.
I
NTRODUCTIONhttp: // www.ijrtsm.com© International Journal of Recent Technology Science & Management 2
beams with transverse cracks. Modified boundary conditions due to the presence of crack have been used tofind out the theoretical expressions for natural frequencies and mode shape for the beams.
II.CRACK MODEL DESCRIPTION
This section presents the approach adopted to build the theoretical model for measuring the modal characteristics i.e. natural frequencies and mode shapes of the cracked beam containing multiple transverse cracks for different relative crack depths and relative crack positions and undamaged beam structure. During the analysis of the theoretical results, it is observed that a noticeable change in the first three mode shapes have been marked at the vicinity of crack locations. The robustness of the proposed theoretical approach has been established by comparing the results with the experimental results.
2.1 Evaluation of local flexibility of the damaged beam under axial and bending loading
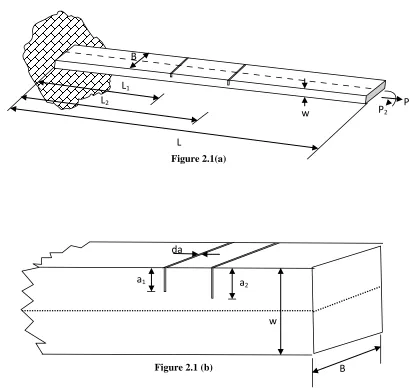
Fig. 2.1(a) presents a multi cracked cantilever beam, subjected to axial load (P1) and bending moment (P2). The loading provides a coupling effect resulting in both longitudinal and transverse motion of the beam. The beam contains two transverse cracks of depth „a1‟ and „a2‟ having width „B‟ and height „W‟. Due to the cracks present in the beam a local
Figure 2.1(a)
P1
B
w
L
L1
L2
P2
Figure 2.1 (b)
w
B
a1
a2
http: // www.ijrtsm.com© International Journal of Recent Technology Science & Management 3
flexibility will be introduced and a 2x2 matrix is considered, which represents the flexibility of the beam. Fig. 2.1(b) represents the cross sectional view of the cantilever beam model.
At the cracked section strain energy release rate can be explained as ;
(2.1a)
=
E
1
(for plane stress condition) (2.1b)
The Stress intensity factors Kl1, Kl2 are of mode I (opening of the crack) for load P1 and P2 respectively. The values of stress intensity factors from earlier studies [46] are;
0.5
1
))
2W
πa
tan(
πa
2W
(
)
W
a
(
F
)
2
/
cos(
))
2
/
sin(
1
(
37
.
0
)
a/W
(
02
.
2
752
.
0
3W
a
W
a
0.5
2
))
2W
πa
tan(
πa
2W
(
)
W
a
(
F
)
2
/
cos(
))
2
/
sin(
1
(
199
.
0
923
.
0
4W
a
W
a
Assuming Utbe the strain energy due to the crack. The additional displacement along the force Pi according to Castigliano‟s theorem is;
(2.4)
2 2 1
)
(
1
I
I
K
K
E
J
E
v
E
2
1
1
I2 2
2 2 I1 1
1
))
K
W
a
(
(F
πa
B
W
6P
,
K
))
W
a
(
(F
πa
WB
P
i
u
P
U
i t
0.00
0.20
0.40
0.60
0.80
1.00
-6
-3
0
3
6
9
C
C =C
C
R
elative Cra
ck D
epth a
1
/W
Dimensionless Compliance
11
12 21
22
http: // www.ijrtsm.com© International Journal of Recent Technology Science & Management 4
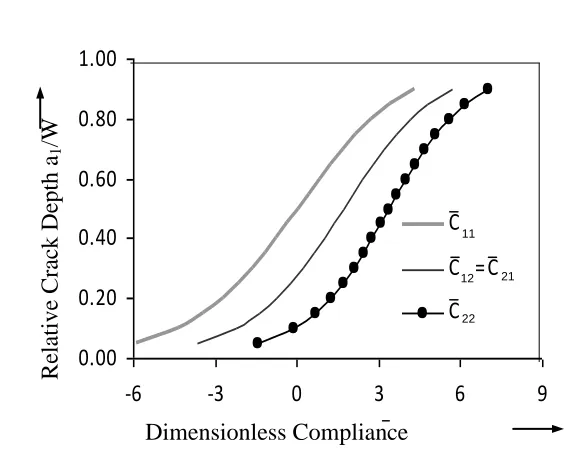
The variations of dimensionless compliances with respect to relative crack depth have been shown in Fig. 2.2 and from the graph it is observed that the dimensionless compliance increases with increase in relative crack depths.
2.2 Vibration analysis of the multi cracked cantilever beam
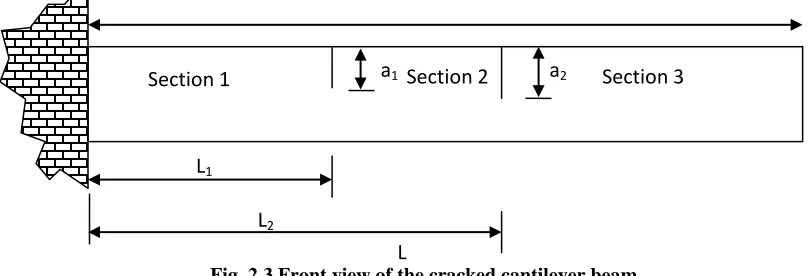
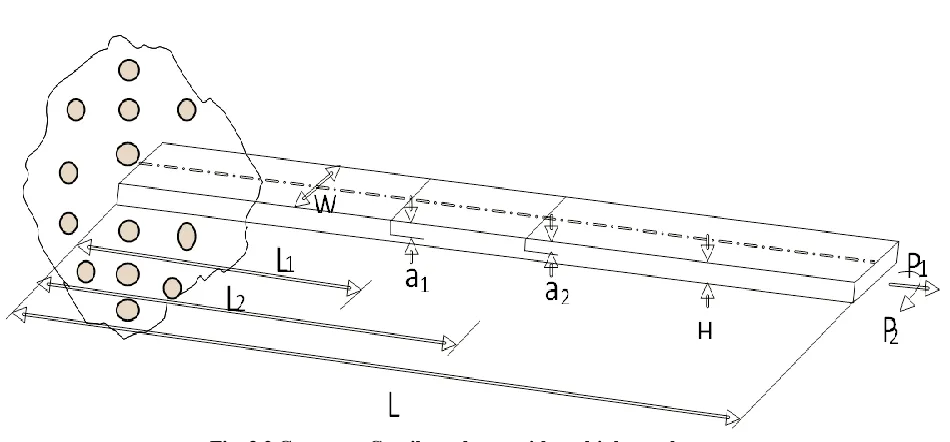
In the present section, a cantilever beam (Fig. 2.3) with multiple crack with length „L‟ width „B‟ and depth „W‟, having cracks at distance „L1‟ and „L2‟ with crack depths „a1‟and „a2‟ respectively from the fixed end has been analyzed. The amplitudes of longitudinal vibration have been taken as u1(x, t), u2(x, t), u3(x, t) and amplitudes of bending vibration have been considered as y1(x, t), y2(x, t), y3(x, t) for the section-1(before 1st crack), section-2 (in between cracks), section-3 (after the 2nd crack) respectively as shown in Fig.3.4.
The following are the expressions of normal functions for the system
)
x
K
sin(
A
)
x
K
(
cos
A
)
x
(
u
1
1 u
2 u (2.14a))
x
K
sin(
A
)
x
K
(
cos
A
)
x
(
u
2
3 u
4 u(2.14b)
)
x
K
sin(
A
)
x
K
(
cos
A
)
x
(
u
3
5 u
6 u (2.14c))
x
K
sin(
A
)
x
K
(
cos
A
)
x
K
sinh(
A
)
x
K
(
cosh
A
)
x
(
y
1
5 y
6 y
7 y
8 y(2.14d)
)
x
K
sin(
A
)
x
K
(
cos
A
)
x
K
sinh(
A
)
x
K
(
cosh
A
)
x
(
y
2
9 y
10 y
11 y
12 y (2.14e))
x
K
sin(
A
)
x
K
(
cos
A
)
x
K
sinh(
A
)
x
K
(
cosh
A
)
x
(
y
3
15 y
16 y
17 y
18 y(2.14f)
Where,
L
x
x
,L
u
u
,L
y
y
,,
L
L
1 1
L
L
2 2
u uC
L
K
; 2 / 1 u
E
C
; 2 / 1 y 2 yC
L
K
; 2 / 1 yEI
C
, = A
Fig. 2.3 Front view of the cracked cantilever beam
L
L1
L2
a2
a1
http: // www.ijrtsm.com© International Journal of Recent Technology Science & Management 5
The constants Ai, (i=1, 18) are to be calculated using the laid down boundary conditions.
The following are the boundary conditions for the cantilever beam;
0
)
0
(
u
1
; 2.15(a)0
)
0
(
1
y
; 2.15(b)0
)
0
(
1
y
; 2.15(c)0
)
1
(
u
3
; 2.15(d)
0
)
1
(
"
y
3
; 2.15(e)0
)
1
(
y
3
2.15(f)At the fractured section:
)
(
'
u
)
(
'
u
1
2
; 2.16(a))
(
y
)
(
y
1
1
2
1; 2.16(b)
)
(
y
)
(
y
1
1
2
1; 2.16(c)
)
(
y
)
(
y
1
1
2
1 ; 2.16(d))
(
'
u
)
(
'
u
2
2
3
2; 2.16(e)
)
(
y
)
(
y
2
2
3
2; 2.16(f)
)
(
y
)
(
y
2
2
3
2; 2.16(g)
)
(
y
)
(
y
2
2
3
2; 2.16(h)
The expression in equation (3.17) can be found out because of the discontinuity of axial deformation to the right and left of the first crack location at the distance L1 from the fixed end of the cantilever beam. Also at the cracked section, we have
)
dx
)
L
(
dy
dx
)
L
(
dy
(
k
))
L
(
u
)
L
(
u
(
k
dx
)
L
(
du
AE
2 1 1 112 1
1 1 2 11 1
1
http: // www.ijrtsm.com© International Journal of Recent Technology Science & Management 6
Multiplying
L
k
11k
12AE
on both sides of equation (3.17) we get ;
))
(
y
)
(
y
(
M
))
(
u
)
(
u
(
M
)
(
u
M
M
1 2 1
1
2 2
1
1
1
1 2
1
1
1(2.18)
The expression in equation (2.19) can be found out because of the discontinuity of slope to the left and right of the crack at the crack section.
)
dx
)
L
(
dy
dx
)
L
(
dy
(
k
))
L
(
u
)
L
(
u
(
k
dx
)
L
(
y
d
EI
2 21 2 1 1 1 22 2 1 1 11 1 2
(2.19)
Multiplying 22 21 2
k
k
L
EI
on both sides of equation (2.19) we get;))
(
u
)
(
u
(
M
))
(
y
)
(
y
(
M
)
(
y
M
M
3 4 1
1
4 2
1
1
1
3 2
1
1
1(2.20)
Similarly considering the second crack we can have;
))
(
u
)
(
u
(
M
)
(
u
M
M
5 6 2 2 6 3 2 2 2M
5(
y
3
(
2)
y
2
(
2))
(2.21)
))
(
y
)
(
y
(
M
)
(
y
M
M
7 8 2 2 8 3 2 2 2M
7(
u
3(
2)
u
2(
2))
(2.22)
Where
M
1
AE
(
L
k
11)
,
M
2
AE
k
12,M
EI
(
L
k
)
,
M
EI
(
L
k
21)
2 422
3
,
k
AE
M
,
)
k
L
(
AE
M
5
22
6
23
M
7
EI
(
L
k
33
),
M
8
EI
(
L
2k
32
)
By using the normal functions, equation (2.14a) to equation (2.14f) with the laid down boundary conditions as mentioned above, the characteristic equation of the system can be expressed as;
0
Q
(2.23)
This determinant is a function of natural frequency (ω), the relative locations of the crack (
1,
2) and the local stiffness matrix (K) which in turn is a function of the relative crack depth (a1/W, a2/W).http: // www.ijrtsm.com© International Journal of Recent Technology Science & Management 7
Where;
u 1
Sin
k
T
,T
2
Cos
k
u,T
3
Cos
(
k
u
2)
,
T
4
Sin
(
k
u
2)
,
T
5
Cos
(
k
u
1)
,T
6
Sin(
k
u
1)
,)
k
(
Cosh
y
1
1G
,G
2
Sinh
(
k
y.
1)
,G
3
Cosh
(
k
y)
,
G
4
Sinh
(
k
y)
, G5 Cos(ky1))
k
(
Sin
y
1
6
G
,
G
7
Cos
(
k
y)
,G
8
Sin
(
k
y)
,G
9
Cosh
(
k
y
2)
,G
10
Sinh
(
k
y
2)
,)
k
(
Cos
G
11
y
2 ,G
12
Sin
(
k
y
2)
,M
1
AE
/(
L
k
11
)
,M
2
AE
/
k
12
,M
3
EI
/(
L
k
22)
,)
k
L
/(
EI
M
21 24
,M
12
M
1/
M
2,M
34
M
3/
M
4,S
1
T
5
M
1k
uT
6,S
2
T
6
M
1k
uT
5, 1112 3
M
S
S
,
S
4
M
12S
12,S
5
M
12S
13,S
6
M
12S
14
1
S
112 y 3 7
M
k
G
S
,
2
S
122 y 3 8
M
k
G
S
,13 9
S
M
k
G
5S
2 y
3
,
S
10
6
S
142 y 3
k
G
M
,
S
11
k
yG
2,S
12
k
yG
1,S
13
k
yG
6,S
14
k
yG
5, 534 15
M
T
S
,S
16
M
34T
6M
5
AE
/(
L
k
22
)
,M
6
AE
/
k
23
,M
7
EI
/(
L
k
33
)
,M
EI
/(
L
k
32)
2 8
,http: // www.ijrtsm.com© International Journal of Recent Technology Science & Management 8
6 5 56
M
/
M
M
,
M
78
M
7/
M
8,V
1
T
3
M
5k
uT
4,V
2
T
4
M
5k
uT
3,V
3
M
56V
11,V
4
M
56V
12,
V
5
M
56V
13,V
6
M
56V
14,V
M
k
G
9V
112 y 7
7
,
10
V
122 y 7 8
M
k
G
V
,
11
V
132 y 7 9
M
k
G
V
,14
V
2 12y 7 10
M
k
G
V
,
V
11
k
yG
10,V
12
k
yG
9,V
13
k
yG
12,V
14
k
yG
11,V
15
M
78T
3, 478 16
M
T
V
III. CRACK DETECTION
Detection of crack in a beam is performed in two steps. First, the finite element model of the cracked cantilever beam is established. The beam is discretized into a number of elements, and the crack position is assumed to be in each of the elements. Next, for each position of the crack in each element, depth of the crack is varied. Modal analysis for each position and depth is then performed to find the natural frequencies of the beam. Using these results, a class of three dimensional surfaces is constructed for the first three modes of vibration, which indicate natural frequencies in terms of the dimensionless crack depth and crack position.
3.1 Finite element Analysis
The finite element analysis is a useful numerical technique that utilizes variation and interpolation methods for modeling and solving boundary value problems such as the one described in this current chapter. The finite element analysis is very systematic and can be useful for model with complex shape. So, the finite element model can be suitably employed for solving vibration based problems with different boundary conditions. Commercial finite element
packages are available to address the practical problems. During finite element analysis, the structure is approximated in two ways. First step devotes to dividing the structure into a number of small parts. The small parts are known as finite elements and the procedure adopted to divide the structure is called as discretization. Each element on the structure has usually associated with equation of motion and that can be easily approximated. The each element on the finite element model has end points, they are known as nodes. The nodes are used to connect one element to other. Collectively the finite element and nodes are called as finite element mesh or finite element grid. In the second stage of approximation the equation of vibration for each finite element is determined and solved. The solution for each finite element brought together to generate the global mass and stiffness matrices describing the vibrational response of the whole structure. The displacement associated with the solution represents the motion of the nodes of the finite element mesh. This global mass and stiffness matrices represent the lumped parameter approximation of the structure and can be analyzed to obtain natural frequencies and mode shapes of damaged vibrating structures.
3.2 Modeling and Simulation in ANSYS
The finite element analysis is brought out for the cracked cantilever beam shown in fig 3.1 to locate the mode shape of transverse vibration at different crack depth and crack location. The dimensions of the cracked beams of the current research are as follows.
Length of the Beam (L) = 800mm; Width of the beam (W) = 38 mm; Thickness of the Beam (H) = 6mm;
Relative crack depth (
1=a1/H) = Varies from 0.25 to 0.5;Relative crack depth (
2=a2/H) = Varies from 0.25 to 0.5;Relative crack location (
1=L1/L) = Varies from 0.625 to 0.875;Relative crack location (
2=L2/L) = Varies from 0.125 to 0.9375.http: // www.ijrtsm.com© International Journal of Recent Technology Science & Management 9
Young‟s modulus=E=70GPa, Poisson‟s ratio=
=0.35, Density=
=2.7gm/ccThe finite element software ANSYS is used to the finite element analysis in the frequency domain and to get natural frequencies, and mode shapes.
A higher order 3-D, 10-node element having 3 degrees of freedom at each node: translations in the nodal x, y, and z directions (Specified as SOLID187 in ANSYS) shown in fig3.1 wasselected based on concurrence study and used throughout the analysis. Each node has three degrees of freedom, making a total thirty degrees of freedom per element. Hexa meshed model, and meshing at vicinity of crack are exposed in fig 3.2, fig 3.3 respectively.
Fig. 3.2 Geometry Cantilever beam with multiple cracks
http: // www.ijrtsm.com© International Journal of Recent Technology Science & Management 10
Table1. Comparison of theoretical and numerical results
S
No
Relative Crack
Location and Position
Relative Natural Frequency
Theoretical Results
Numerical Results
I
II
III
I
II
III
1
1
=0.25;
2=0.25;
1
=0.125;
2=0.1875
0.007327
0.04815
0.1345
0.007687
0.04845
0.1357
2
1=0.25;
2=0.3;
1
=0.25;
2=0.3125
0.00721
0.04811
0.1339
0.007679
0.04844
0.1347
3
1=0.3;
2=0.4;
1
=0.3125;
2=0.375
0.00732
0.04765
0.1336
0.007663
0.04817
0.1341
4
1
=0.3;
2=0.5;
1
=0.4375;
2=0.5
0.00731
0.04672
0.1348
0.007678
0.04729
0.1354
5
1
=0.4;
2=0.3;
1
=0.5625;
2=0.625
0.00726
0.04714
0.1336
0.007716
0.04765
0.1346
6
1=0.5;
2=0.4;
1
=0.625;
2=0.6875
0.00719
0.04713
0.1341
0.007728
0.04771
0.1349
7
1
=0.4;
2=0.3;
1
=0.75;
2=0.8125
0.00721
0.04779
0.1321
0.007744
0.04815
0.1325
8
1
=0.5;
2=0.25;
1
=0.875;
2=0.9375
0.00720
0.04811
0.1345
0.007754
0.04851
0.1353
http: // www.ijrtsm.com© International Journal of Recent Technology Science & Management 11
positioning of it. The slight variations in the values are because of the various assumptions taken during numerical analyses which are slight different from the assumption taken during theoretical analysis by the authors. So the present numerical investigation proofs to be handy for such analysis of cracked beam, and it can be said that for evaluating the relative natural frequency and amplitude of the multi cracked beam numerical investigation gives sufficient information regarding the matter.
IV.CONCLUSION
Following conclusions are based on above discussions supported in the form of graphical and tabular representation.
1. The crack location and its size strongly influence the mode shapes and natural frequencies of the cracked structures. The noteworthy changes in mode shapes are observed near crack location.
2. The positions of the cracks in relation to each other affect significantly the changes in the natural frequencies vibrations in the case of an equal relative depth of the cracks. When the cracks are located near to each other, the change in the natural frequency tends to increase.
3. The natural frequency of the structure having single crack tends to merge when the crack location is shifted toward the free end for the cantilever. And for case having two cracks, when the distance between the cracks increases, the frequencies of the beam natural vibrations also tend to the natural vibration frequencies of a system with a single crack.
4. In the case of two cracks of different depths, the larger crack has the most significant effect on the natural vibration frequencies. This is evident for the first natural vibration of a cantilever beam. For further more modes of vibration this is not so clear, because the influence of a crack location at a node is negligible. These changes in mode shapes and natural frequencies will be advantageous in prediction of crack location and its intensity and can further be extended to any multi crack system.
5. Good agreement between theoretical and numerical results is observed.
REFERENCES
1. A D.Dimarogonas.P.F. Rizos “Identification of Crack location and magnitude in a cantilever beam from the vibration modes” Journal of sound and vibration (1989)138(3) page no. 381-388.
2. R.Ballarini andY.Hsu “Three-dimensional stress intensity factor analysis of a surface crack in a high-speed bearing” International journal of fracture 46,(1989) page no.141-158.
3. R.Ruotolo and D.Storer “Harmonic analysis of the vibrations of a cantilevered beam with a closing Crack” (1995) page no.1057-1074.
4. T.G.Chondros and A.D Dimarogonas “A continuous crack beam vibration theory” Journal of sound and vibration (1998)215(1) page no.17-34.
5. Kisa M. and Brandon J., The Effects of closure of cracks on the dynamics of a cracked cantilever beam, Journal of Sound and Vibration, 238(1), (2000) page no.1-18
6. Patil D.P., Maiti S.K, Detection of multiple cracks using frequency measurements, Engineering Fracture Mechanics 70, (2002), page no.1553–1572
7. M.I.Friswell and J.E.T.Penny “crack modeling for structural health monitoring” sage publications (2002) page no.139-148
8. Kisa M. “Free vibration analysis of a cantilever composite beam with multiple cracks”, Composites Science and Technology 64, (2003),page no.1391-1402.
http: // www.ijrtsm.com© International Journal of Recent Technology Science & Management 12
10. Ertugrul.Cam and SadettinSOrhan “An analysis of cracked beam structure using impact echo method ”(2004)NDT&E International 38, page no.368-373.
11. S. Loutridis, E. Douka and L.J. Hadjileontiadis, Forced vibration behaviour and crack detection of cracked beams using instantaneous frequency”, NDT&E International, 38, (2005), page no. 411–419.
12. BarisBinici, “Vibration of beams with multiple open cracks subjected to axial force”, Journal of Sound and Vibration 287, (2005), page no .277–295.