R E S E A R C H
Open Access
Semitone frequency mapping to improve music
representation for nucleus cochlear implants
Sherif Abdellatif Omran
1,2*, Waikong Lai
1, Michael Büchler
1and Norbert Dillier
1Abstract
The frequency-to-channel mapping for Cochlear implant (CI) signal processors was originally designed to optimize speech perception and generally does not preserve the harmonic structure of music sounds. An algorithm aimed at restoring the harmonic relationship of frequency components based on semitone mapping is presented in this article. Two semitone (Smt) based mappings in different frequency ranges were investigated. The first, Smt-LF, covers a range from 130 to 1502 Hz which encompasses the fundamental frequency of most musical instruments. The second, Smt-MF, covers a range from 440 to 5040 Hz, allocating frequency bands of sounds close to their characteristic tonotopical sites according to Greenwood’s function. Smt-LF, in contrast, transposes the input frequencies onto locations with higher characteristic frequencies. A sequence of 36 synthetic complex tones (C3 to B5), each consisting of a fundamental and 4 harmonic overtones, was processed using the standard (Std), Smt-LF and Smt-MF mappings. The analysis of output signals showed that the harmonic structure between overtones of all complex tones was preserved using Smt mapping. Semitone mapping preserves the harmonic structure and may in turn improve music representation for Nucleus cochlear implants. The proposed semitone mappings incorporate the use of virtual channels to allow frequencies spanning three and a half octaves to be mapped to 43 stimulation channels. A pitch difference limen test was done with normal hearing subjects discriminating pairs of pure tones with different semitone intervals which were processed by a vocoder type simulator of CI sound processing. The results showed better performance with wider semitone intervals. However, no significant difference was found between 22 and 43 channels maps.
Keywords:Semitone mapping, Melody, Music, Nucleus cochlear implant
Introduction
Music can be described as a series of complex acoustic sounds composed of tones with fundamentals and over-tones that are harmonically related to each other [1]. The majority of musical instruments generate funda-mental frequencies below 1 kHz [2]. An important aspect of music is melody [3] which can be defined as a sequence of individual tones that are perceived as a sin-gle entity [4]. Preserving the harmonic structure of indi-vidual tones is important for preserving the melody perception.
Cochlear Implants (CIs) were originally designed to restore speech perception for patients with profound hearing loss [5,6]. The standard ACE (advanced
combination encoder) speech coding strategy used with the Nucleus CI typically encodes signals between 188 and 7980 Hz onto maximally 22 intracochlear electro-des. The frequency range up to 1 kHz is represented by only up to eight electrodes in the standard (Std) ACE frequency to electrode mapping. This is insufficient to preserve the representation of the harmonic structure of musical tones, because the fundamental frequencies as well as overtones of adjacent musical tones will often be mapped onto the same electrode, especially for frequen-cies below 500 Hz. It can be hypothesized therefore that this coding strategy will not be optimal for musical mel-ody representation.
One way to improve tonotopic melody representation would be to ensure that the fundamental frequencies of adjacent tones on the musical scale are assigned to sepa-rate electrodes. Such an approach involves mapping fun-damental frequencies of musical tones to electrodes
* Correspondence: [email protected]
1
ENT Department, University Hospital Zurich, Frauenklinikstrasse 24, CH-8091 Zurich, Switzerland
Full list of author information is available at the end of the article
based on a semitone scale. The idea was initially investi-gated in a study by Kasturi and Loizou [7], using the 12 electrode Clarion CII (Advance Bionics) implant with a limited range of semitone frequencies. They concluded that semitone spacing improved melody recognition with CI recipients. Additionally, music could be further enhanced by increasing the frequency representation in CIs. This may be possible by using virtual channels (VCs) formed by stimulating two adjacent electrodes simultaneously with the same current level. Busby and Plant reported that VCs invoked the perception of an intermediate pitch [8]. VCs on an array of 22 electrodes would yield a total number of 43 channels, which would allow covering three and a half octaves with semitone (Smt) mapping with one-semitone intervals between the characteristic frequencies of successive channels. Note that the middle VC between two adjacent electrodes is the only VC which can be created in present Nucleus CI devices, because they are equipped with only one current source.
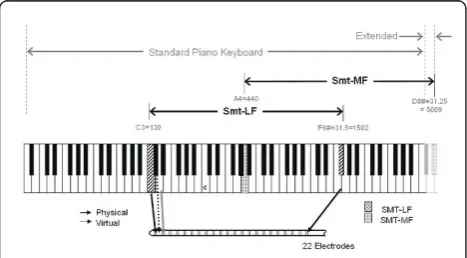
In this study, we extended Kasturi and Loizou’s idea and propose a Smt mapping algorithm incorporating VCs. Two different Smt mapping ranges were consid-ered. The first one, Smt-LF, is restricted to the low and mid frequency range [130 to 1502 Hz] and the second, Smt-MF, maps frequencies in the mid and high fre-quency range [440 to 5009 Hz]. The ranges of Smt-LF and Smt-MF mappings in relation to a piano keyboard are illustrated in Figure 1. Note that at the lower end of the piano scale, the fundamental frequencies of succes-sive tones differ by as little as 3 Hz at A0 (f0 = 27 Hz)
and approx. 8 Hz at C3 (f0 = 130 Hz). This difference
increases as the fundamental frequency of the tone is also increased.
The frequency range of the Smt-LF mapping covers low and mid frequencies. These frequencies are com-mon to most musical instruments [2]. The Smt-LF map-ping has a band-pass filter that filters out the fundamental frequencies and the lower partials lying within the first and second piano octaves (less than 130 Hz) as well partials in the sixth piano octave and above (greater than 1502 Hz). The range of the Smt-MF map-ping covers part of the mid and high frequencies that are common between music and comprehensible speech bands used in telephone lines [9]. The Smt-MF mapping band-pass filters out frequencies lower than 440 Hz (A4) and higher than 5009 Hz. Thus fundamental frequencies and partials in most of the fourth piano octave (261 to 493 Hz) and below will not be represented. Smt-MF mapping also allocates frequency bands of audible sounds to electrodes with similar characteristic frequen-cies according to Greenwood’s formula [10,11] assuming an average cochlear length of 33 mm and electrode insertion depth of 22 mm.
This article is organized as follows:‘Theoretical basis
of semitone mapping’section describes the theoretical
basis of semitone mapping and explains why Smt
map-ping was chosen. ‘Processing and implementation’
sec-tion presents a brief descripsec-tion of the processing technique.‘Semitone mapping frequency ranges’section describes in detail the two Smt-LF and Smt-MF ranges in concern. ‘Frequency time matrix’section describes how the resolution at low frequencies was improved.
‘Channel time matrix’ section describes how the
fre-quency bands were then mapped to their corresponding channels.‘Nucleus Matlab Toolbox’section is a descrip-tion of how an acoustic model could be implemented to resynthesize channel activities into an acoustic sound that will be used in psychoacoustic tests with normal hearing (NH) listeners.‘Analysis’section shows an ana-lysis for the resynthesized sounds. ‘Pilot test’ section describes a pilot pitch ranking test using acoustic simu-lations of CI sounds with NH subjects to investigate the perceptual difference between 43 and 22 channels using the Std ACE mapping. The hypothesis for this test being that 43 Channel mode would increase the fre-quency representation, and as a result enhance synthetic tone discrimination and improve pitch ranking with smaller semitone intervals than with 22 channels using the Std ACE mapping. ‘Procedure’and‘Results’sections describe the experimental procedures and results. This is followed by a discussion and a conclusion section.
Theoretical basis of semitone mapping
Smt mapping assigns fundamental frequencies of succes-sive semitones on the musical scale to individual Figure 1With Smt mapping, consecutive tones on the musical
channels. Note that the harmonic overtones, which are integer multiples of the fundamental frequency, of each musical tone will also be mapped to the center fre-quency of separate channels with Smt mapping. There-fore, different musical tones will correspond to different sets of channels.
The relationship between the fundamental frequencies
fn and fr of two musical tones k semitones apart is
described by Equation 1a below.
fn=fr·2k/12 (1a)
⇒log10
fn
fr
= 0.025k (1b)
where fr is the fundamental frequency of the lower
tone. Equation 1b represents the ratio of characteristic
frequencies of channels in Smt mapping. Substitutingk
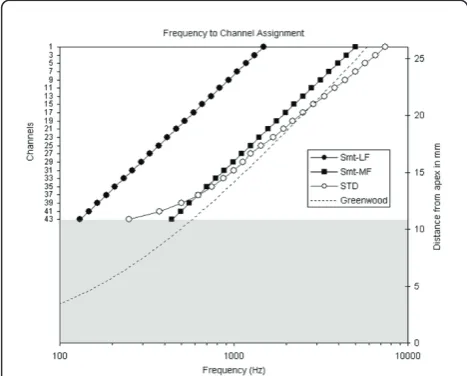
= 1 gives frequency ratios for one-semitone steps. The characteristic frequencies of Smt mapping for 43 channels each 1 semitone apart (k= 1) for the two Smt-LF and Smt-MF ranges (squares and filled circles, respectively) are plotted in Figure 2. Note that higher channel numbers correspond to lower frequencies, to be consistent with the numbering used for Nucleus CIs. The characteristic frequencies of the Std mapping with 43 channels (i.e., including VCs) are also shown in Figure 2 (open circles).
The two Smt mapping functions yield straight lines with a slope corresponding to the value of 0.025 as given in Equation 1b. This value is required to map consecutive semitones to consecutive individual channels. Shallower slopes would result in more than one semitone being mapped to the same channel, distorting the original har-monic structure of the overtones. This would be the case for the Std mapping function, particularly with the first eight channels in the lower frequency range. This distor-tion decreases at higher frequencies as the slope approaches a value corresponding to 0.025.
Since the inner ear resolves frequencies mainly based on a logarithmic function, harmonic overtones with the Smt mapping will be regularly spaced along the basilar membrane as described by the following equations.
Equation 2 below describes the characteristic frequen-cies at distancexmm from the cochlea’s apex according
to Greenwood’s empirically derived function which was
verified against data that correspond to a range of x
from 1 to 26 mm [12].
f(x) = 165.4(100.06.x−1) (2)
⇒x(f) = 1
0.06log
f 165.4+ 1
(3)
The distance (in mm) between two locations with dif-ferent characteristic frequencies f1 and f2 is given by
Equation 4
x=x2−x1=
1 0.06log
f2+ 165.4
f1+ 165.4
(4)
Substituting f2 and f1 by fnand fr, respectively, from
Equation 1 yields:
x= 1
0.06log
2k/12+ 165.4/f
r 1 + 165.4/fr
(5)
Equation 5 shows that the spacing along the basilar membrane between two successive semitones (substitute
k = 1 and fr with the fundamental frequency of the
lower tone) will vary depending on the frequency range, and is smaller at low frequencies, asymptotically approaching 0.4 mm with higher frequencies. For C3 (f0
= 130.8 Hz), the spacing would be about 0.19 mm,
whereas at C8 (f0= 4186 Hz) about 0.4 mm. The
elec-trode spacing between successive elecelec-trodes in the Nucleus 24 implant straight array has a center to center distance of 0.75 mm [13]. For VCs, assuming that the center of stimulation is halfway between the two physi-cal electrodes, the channel spacing would be about 0.38 mm. This corresponds roughly to the tonotopical spa-cing for the tones involved in the Smt-MF mapping. Figure 2The frequency to channel assignments for the Smt-LF
Processing and implementation
The block diagram in Figure 3 shows the Std ACE pro-cessing algorithm. An acoustic signal undergoes fast Fourier transform (FFT), from which the power spectral density (PSD) is calculated. The frequency range of the
PSD is divided into different bands. The n bands with
the highest energies (maximas) are then selected for pre-sentation, wherenis a parameter that can be defined for
each CI recipient’s map. The resulting frequency time
matrix (FTM) is then processed as follows: The energy within each selected band is used to determine the cor-responding stimulation level according to a loudness growth function (LGF). Using a mapping function, the respective bands are then assigned to channels, which can be physical electrodes or VCs, to produce the chan-nel time matrix (CTM).
Semitone mapping frequency ranges
The fundamental frequencies of the musical tones from the piano keyboard vary between 27.5 Hz (A0) and 4186 Hz (C8) [2]. Two ranges were investigated for the Smt mapping:
Smt-LF [130 to 1502 Hz] (C3 to F6#)
The minimum required frequency resolution for the
Smt-LF mapping is approx. 8 Hz at C3 (f0 = 130 Hz).
Analyzing a signal that has a sampling rate of 16 kHz with 2048 FFT points provides a 7.8-Hz resolution between successive frequency bins. The lowest acoustic frequency of 130 Hz for Smt-LF will be mapped to the most apical electrode location, which would correspond to a characteristic tonotopical frequency of
approxi-mately 571 Hz estimated according to Greenwood’s
equation [10], assuming an average cochlear length of 33 mm and an electrode array insertion depth of 22 mm. This will cause sounds to be perceived higher in pitch. However, as the frequency shift is expected to be the same for all partials with Smt mapping, this would be equivalent to a transposition.
Smt-MF [440 to 5009 Hz] (A4 to D8#)
A small frequency bandwidth is enough to maintain speech comprehension as in telephone transmission, where the bandwidth used is [300 to 3000 Hz] [9]. The Smt-MF mapping covers part of the bandwidth that is common between speech and music [440 to 5009 Hz]. Note that transposing the Smt-MF range three semi-tones higher to cover a range from 523 Hz (C5) to 5919 Hz (F8#) would minimize the difference between
characteristic and tonotopical frequencies of electrodes according to Greenwood [10] (see Figure 2) assuming an average cochlear length of 33 mm and an insertion depth of 22 mm. However, it is impossible to precisely match the tonotopical characteristic frequencies for any
given individual through Greenwood’s function as the
latter is empirical in nature and is also supposed to only represent the average NH listener. Also cochlear length and electrode insertion depth vary among patients. Thus, some discrepancy is always to be expected.
Frequency time matrix
Frequency components at different time frames are ana-lyzed using FFT and are organized into a FTM. A typi-cal CI processor like the Nucleus Freedom uses a
sampling rate fsof 16 kHz to produce the FTM with a
128 points FFT [14,15], giving a frequency resolutionΔf
of 125 Hz [16-18]. However, Smt-LF mapping needs a higher resolution (Δfof approx. 8 Hz) at low frequencies
(approx. 130 Hz). Increasing the number of pointsN=
fs/Δfincreases the frequency resolution but at the same time will produce smearing in the time domain due to the larger processing window. In order to increase the frequency resolution at low frequencies and retain some of the time resolution at higher frequencies, frequency subband decomposition [19-21] is used to generate the FTM.
Frequency resolution and subband decomposition First, the input signal is sampled at 16 kHz. Then the sampled signal is processed in two frequency subbands (see Figure 4) to yield two different frequency resolutions.
Figure 4 shows how the input signal flows into two parallel pathways: one for the low frequencies and the other for the high frequencies. The low frequency path-way uses 512 (N) samples which are split into overlap-ping time frames and analyzed. The amount of overlap depends on the stimulation rate such that at the end of each stimulation period, as much new data (sampled at 16 kHz) as needed is added to the data buffer. For instance, with a stimulation rate of 500 Hz, 32 new sam-ples are added every stimulation period to the data buf-fer of length 512 samples, resulting in an overlap of 480 samples. The signal is first filtered using a Kaiser LPF with a cutoff at 4 kHz, and then decimated by a factor of two (d= 2) which increases the frequency resolution
STFT Envelope Maxima LGF
Wav FTM CTM
by the same factor while keeping the buffer length 512 points. Each time frame with 512 points is Hanning
fil-tered and zero padded before undergoing a 2048 (m)
point FFT. Notice that after zero padding each bin
represents a frequency band of 3.9 Hz (fs/m = 8 k/
2048). Every two successive bins are then summed to preserve the power and decrease the overall minimum detectable frequency difference (Δf=fs/(d·m/2)) in the low frequency branch within successive bands to 7.8 Hz. The high frequency pathway uses the same number of
points (N = 512) used in the low frequency pathway,
producing a frequency resolution of 31.25. The signal is split into overlapping time frames in the same manner as in the low frequency pathway. Each time frame is processed with a Hanning filter of the same number of points, zero padded and undergoes a 2048 point FFT.
The output bins from both pathways are combined to form the FTM which has a bin resolution of 7.8. The boundary between the low and the high frequency path-ways was set to 1054 Hz (between C6 and C6#) where the difference in frequency between successive semi-tones starts to exceed the HF resolution. This ensures that any successive semitones will at least lie on succes-sive electrodes. The lower 134 bins are from the low fre-quency pathway, while the higher bins are from the high frequency pathway.
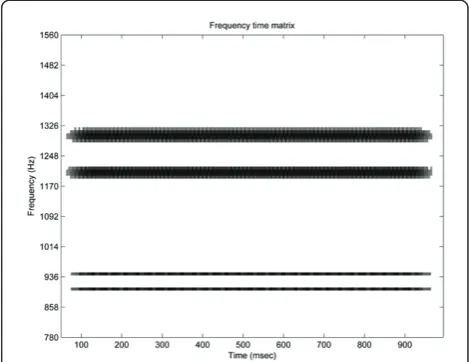
An example of a FTM produced using frequency sub-band decomposition for a signal with four sinusoidal components with 900, 936, 1200, and 1295 Hz is shown in Figure 5. The difference in frequency resolution can be clearly seen in the narrower bands at lower frequen-cies and wider bands at higher frequenfrequen-cies.
The above frequency subband decomposition only applies to the Smt-LF mapping. For Smt-MF mapping,
the minimum frequency resolution required is approx.
26.6 Hz at A4 (f0 = 440 Hz). Using N= 512 provides a
minimum resolution of 31.25 Hz which is slightly lar-ger than the required resolution for the lowest
semi-tone frequencies. Note that in the present
implementation of the Smt-MF, the first two tones (A4 and A4#) will not be adequately resolved and therefore fall within a single FFT bin which will in turn be mapped to two adjacent channels because the differ-ence between them is less than the LF resolution (7.8 Hz). To preserve the starting frequency and approach
High frequency path (Branch 1)
Signal
Amplitude Scaling N points
FFT
Buffer High
freq. bins Signal
Input Low frequency path (Branch 2) FTM
LPF
2kHz decimate ൻ4
Zero Pad and Buffer
2N points FFT
Low freq. bins
Zero Pad Length=2n
Figure 4Implementation of frequency subband decomposition for Smt-LF, producing a frequency resolution of 7.8 Hz at frequencies below 1054 Hz (LF path), and a frequency resolution of 31.25 Hz at higher frequencies (HF path). The number of overlapping points between frames is calculated as follows: Overlap = 512 -fs/(stimulation rate). Note that the analysis frame rate is the same as the stimulation rate.
CFs to Greenwood frequencies without having an empty channel, while having frequencies of (A4 and A4#) semitones being in the same bin, it is suggested to activate the first two electrodes. The starting fre-quency could have been made slightly lower, but a drawback would produce a bigger difference between CFs of electrodes and Greenwood frequencies. The remaining tones are adequately resolved. Subband decomposition is not used with Smt-MF mapping. The processing block diagram for Smt-MF is similar to the one described for the high frequency pathway in Figure
4, withN= 512 without zero padding and without the
frequency scaling block. Note that the frequency reso-lution of Smt-MF is 31.25 Hz, compared to 7.8 Hz (for frequencies below 1054 Hz) and 31.25 Hz (for frequen-cies above 1054 Hz) for Smt-LF.
Channel time matrix
Depending on the frequency range of interest (e.g. Smt-LF [130 to 1502 Hz] and Smt-MF [440 to 5009 Hz]),
different bins in the FTM are combined into frequency channels to produce a CTM. A mapping matrix (M) is introduced to define which FFT bins should be mapped to which corresponding channels. The mapping matrix attempts to map the center frequencies of the channels and FFT bins as close as possible to the fundamental frequencies of each corresponding semitone.
CTM=M·FTM (6)
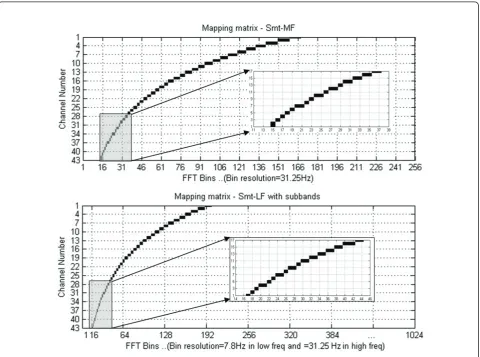
Figure 6a, b illustrates the mapping matrices for both the Smt-MF and the Smt-LF mapping, respectively, for 43 channels. The Smt-LF mapping covers frequency band [130 to 1502 Hz] which corresponds to bin num-bers [17 to 200], with a frequency resolution of 7.8 Hz. The Smt-MF mapping covers frequency band [440 to 5009 Hz] which corresponds to bin numbers [15 to 169] where the frequency resolution is 31.25 Hz. Smt-MF mapping does not incorporate subbands and accordingly bin 15 (corresponding to 440 Hz) is mapped to channels 1 and 2.
Nucleus Matlab Toolbox
The Smt mapping follows the ACE strategy in selecting
the highest nchannels. It was implemented in Matlab
and incorporated into the Nucleus Matlab Toolbox (NMT) framework [15]. The acoustic model (AMO) was based on noise band vocoders [22]. The activity in each channel is simulated as a white noise convolved with an exponentially decaying filter, where its center frequency is the characteristic frequency of the channel. Channel interactions arising from the spread of the electric field from its center at the stimulation site can be set by a
“width of stimulation”parameter. The resulting stimula-tion of the auditory nerve, causing also the percepstimula-tion of adjacent pitches, is simulated with the AMO. In the Smt-LF mapping, the AMO simulated the frequency transposition.
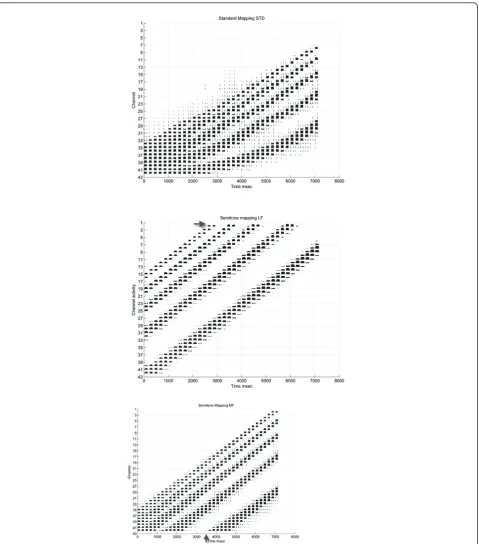
Analysis
Following the definition of [4] for melody, a better representation of individual musical tones is expected to ameliorate melody recognition, or in other words, mel-ody is poorly resolved if individual musical tones are poorly represented. Musical tones are characterized by their harmonic structure. To compare the harmonic structure representation for the three different mappings (Std, Smt-MF, and Smt-LF), a sound sequence consist-ing of 36 consecutive synthetic musical tones was con-structed. Each tone consisted of five partials with successive 20% decrease in amplitude and lasting for 150 ms. The fundamental frequency of each tone increased from 130 Hz (C3) to 987 Hz (B5) with 1-semi-tone interval.
Figure 7 shows the harmonic structure being pre-served with both Smt-MF and Smt-LF mappings, where the spacing of the partials remains uniform across tones. With the Std mapping at low frequencies, partials are not resolved. With Smt-MF, frequency components below 440 Hz are filtered out (as indicated by arrows in Figure 7), while with Smt-LF, the high frequency partials greater than 1.6 kHz are filtered out.
Pilot test
A pitch difference limen test was conducted using a pair of single harmonic pure tones with 1, 3, and 6 semitone intervals. Tones were preprocessed with a CI acoustic model [23] that uses a noise band vocoder in the resynthesis algorithm. A CI acoustic resynthesis model was used to simulate the sound CI patients may per-ceive and to present these to NH subjects. The model assumes that there is no change in the effective spread of excitation width between 43 and 22 channels. Pure tones were used that corresponded to fundamental fre-quencies of musical tones. All tones were modified to have the same temporal envelope, and a duration of 0.5
s. The starting and ending of all tones were faded with 30 ms attack and release times simultaneously. The reference note (D) was used for all tone groups (1, 3, and 6 semitone intervals).
Procedure
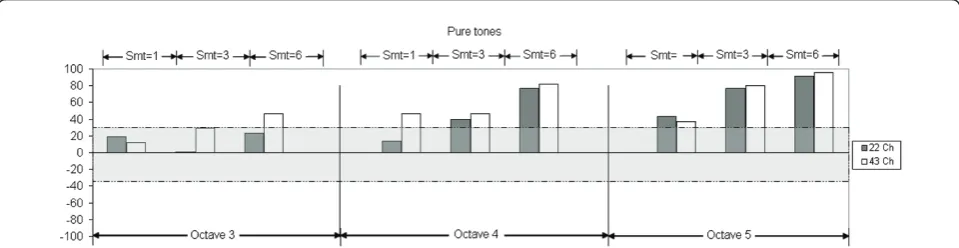
All tones were processed using 22 and 43 channels with the acoustic model using a stimulation width of 1 mm since [22,24] found that a width of stimulation of around 1 mm produced electrode discrimination similar to that of average Nucleus CI24 recipients. Sound sam-ples were then normalized to have equal loudness. NH subjects were seated in front of a loudspeaker at a dis-tance of 1.5 m and sounds were presented at a level of 70 dBA. MACarena [25] software was used to randomly select and play a pair of two tones from three octave groups: octave 3, 4, and 5. The tone pairs from each octave group were D-D#, D-F, and D-G#, with 1, 3, and 6 semitone intervals, respectively. The randomization was to minimize learning effects of tone sequences. For each group the same number of repetitions was pre-sented. The tone pairs were presented sequentially with a pause in between of 0.5 s. Levels were roved by ± 6 dB to avoid loudness cues from being used. Eight NH subjects aged between 27 and 55 years took part in this experiment.
Results
The results of the pitch difference limen measurements are summarized in Figure 8 and show that all subjects, as expected, demonstrated improved pitch discrimina-tion performance with increasing semitone intervals. An ANOVA test showed that there was no statistical differ-ence between 22 and 43 channels at a significance level of 95%.
Discussion
CIs have limitations arising from the physical size of the electrode array and the insertion depth which contribute to CI recipients’difficulty to recognize melodic sounds. Furthermore, the available 22 electrodes of the Nucleus CI are expected to be too few to provide a good repre-sentation of melodies. Drennen et al. report that with monopolar stimulation, recipients perceive pitch based on a degraded spatial representation, suggesting that only 8 to 9 distinguishable channels of the available 22 may exist [26]. To increase the number of channels, VCs [8] are considered here.
is determined by the number of semitones that are to be mapped over the number of available channels. When incorporating VCs, the characteristic frequency of each channel is one semitone apart from the previous one. If VCs were not used (i.e., only the original 22 physical channels (electrodes) are used instead), the characteristic frequency of each channel would be two semitones apart, in order to cover the same input frequency range.
The Smt-LF mapping [130 to 1502 Hz] needs a resolu-tion of approx. 8 Hz at the low frequency end (130 Hz). Although the resolution can be increased by increasing the number of points in the FFT analysis, this would also cause the signal to be smeared in the time domain. A compromise is achieved by using frequency subbands, in which different frequency bands can have different resolu-tions. With Smt-LF, frequencies below 1054 Hz are ana-lyzed with a resolution of approx. 8 Hz while higher frequencies are analyzed with a 31.25-Hz resolution. Note that the frequency allocation for each channel will not be exact for each semitone due to the discrete nature of the FFT bin outputs. There is a limitation with the Smt-LF mapping in that frequencies higher than 1502 Hz as well as frequencies lower than 130 Hz are filtered out. This might lead to filtering out some fundamental frequency that could result in pitch reversals of tones or degradations in the perceived sound quality. In the Smt-LF mapping, frequencies are transposed into higher ranges compared to their tonotopic characteristic frequencies, making tones sound higher in pitch. It is expected that CI patients with Smt-LF mapping may distinguish low frequencies better but music may not sound pleasant.
In Smt-MF mapping, the characteristic frequencies of channels approach their tonotopical frequencies accord-ing to the Greenwood function. Consequently, Smt-MF mapping may sound more natural than Smt-LF map-ping. Smt-MF does not need the use of subbands analy-sis when a FFT size of 512 points is used as a single resolution of 31.25 Hz is sufficient (except for the lowest two tones). There is however a limitation with the
Smt-MF map at low frequencies, where components below 440 Hz are filtered out. This filtering may remove the fundamental frequency of some tones which could then result in pitch reversals compared to tones that have all frequency components intact.
An exact matching of the electrode location to the tonotopical characteristic frequency location is not pos-sible [27]. Thus the phenomenon of the missing funda-mental is not expected to occur with CI patients. Equation 4 yields a range of 0.19 to 0.38 mm for the spacing between successive semitones for the Smt-LF mapping. For the Smt-MF mapping, the range is from 0.3 to 0.4 mm. Assuming that VCs are located exactly midway between two adjacent physical electrodes, the channel spacing for the Nucleus straight electrode array is about 0.38 mm. This is the same order of magnitude as the spacing required for the Smt-MF mapping. Although the match is not exact, the semitone mapping minimizes the spatial distortion of the harmonic struc-ture representation on the basilar membrane.
in a time less than the nerve refractory period. Thus, an explicit use of VCs may not be necessary to achieve intermediate pitch sensations. Based on these observa-tions, it was decided that subsequent testing of the stan-dard and semitone mappings as reported in the companion article [28] would use 22 channels.
The algorithm illustrated in this paper follows the reg-ular signal processing methods as in the Std mapping algorithm, but the FFT processing and the subbands blocks may be optimized using the S transform [30] for limited memory speech processors. It may be also worthwhile to investigate the effect of other transforms such as constant Q transform [31] where the frequency domain is decomposed into logarithmic constant bands with a constant number of semitones per octave. Deriva-tives of this transform may be considered as well such as modified constant Q fast filter bank transform [32].
Smt mapping may be one possible step on a path to improve music representation with CI devices by preser-ving the harmonic structure of overtones to enhance melody representation, but other aspects of music such as timbre should also be considered as well. Timbre depends partially on the representation of temporal fine structure [33]. Including fine structure analysis in new strategies may improve music representation [26,34,35] but this is beyond the scope of the present Smt mapping development. In the companion paper [28], several psy-choacoustic tests with NH and CI patients were con-ducted with the proposed strategies. They showed that semitone mapping enhanced melody contour identifica-tion and significantly improved the recogniidentifica-tion of cer-tain instruments. The analysis of the output signals presented in this article confirms that semitone mapping preserves well the harmonic structure of synthetic har-monic musical tones [36].
Conclusion
Semitone mapping is able to better preserve the repre-sentation of the harmonic structure of overtones com-pared to the standard mapping used in the speech processor. This is expected to improve melody recogni-tion with cochlear implant recipients. However, limited frequency range could result in pitch reversals for tones whose high and low frequency partials are filtered out. The pitch difference limen test results showed that the performance of normal hearing subjects with pure tones processed using an acoustic model of the CI output was not statistically significantly different for 43 channels compared to 22 channels, using the standard ACE fre-quency to channel mapping.
List of abbreviations
ACE: advanced combination encoder; AMO: acoustic model; CI: Cochlear implant; CTM: channel time matrix; FTM: frequency time matrix; LGF:
loudness growth function; NH: normal hearing; NMT: Nucleus Matlab Toolbox; Smt: semitone; Std: standard; VCs: virtual channels.
Acknowledgements
The work was supported by Swiss National Science Foundation Grant Number 320000-110043.
Author details
1
ENT Department, University Hospital Zurich, Frauenklinikstrasse 24, CH-8091 Zurich, Switzerland2Institute of Neuroinformatics, University of Zurich,
Winterthurerstrasse 190, CH-8057 Zurich, Switzerland
Competing interests
The authors declare that they have no competing interests.
Received: 23 December 2010 Accepted: 21 June 2011 Published: 21 June 2011
References
1. F Salzer,Structural Hearing: Tonal Coherence in Music. vol. 1. (Dover Publications, New York, 1982)
2. J Pierce,The Science of Musical Sound(Scientific American Books, New York, 1983)
3. S Sadie, G Grove,The New Grove Dictionary of Music and Musicians. (Grove, London, 1995)
4. E Terhardt,Akustische Kommunikation. (Springer-Verlag, Berlin, 1998) 5. G Clark,Cochlear Implants: Fundamentals and Applications. Modern Acoustics
and Signal Processing vol. XXXVIII. Springer-Verlag, Heidelberg, 2003) 6. K Gfeller, S Witt, J Stordahl, M Mehr, G Woodworth, 2000, The effect of
training on melody recognition and appraisal by adult cochlear implant recipients. J Acad Rehabil Audiol.23, 115–138 (2000)
7. K Kasturi, P Loizou, Effect of filter spacing on melody recognition: acoustic and electric hearing. J Acoust Soc Am.122(2),EL29–34 (2007)
8. PA Busby, KL Plant, Dual electrode stimulation using the nucleus CI24RE cochlear implant: electrode impedance and pitch ranking studies. Ear Hear. 26(5),504–511 (2005)
9. S Möller,Quality of Telephone-Based Spoken Dialogue Systems. (Springer, US, 2005)
10. D Greenwood, A cochlear frequency-position function for several species– 29 years later. J Acoust Soc Am.87(6),2592–2605 (1990)
11. D Greenwood, Critical bandwidth and consonance in relation to cochlear frequency-position coordinates. Hear Res.54(2),164–208 (1991) 12. D Greenwood, Critical bandwidth and the frequency coordinates of the
basilar membrane. J Acoust Soc Am.33(10),12 (1961)
13. LT Cohen, Practical model description of peripheral neural excitation in cochlear implant recipients: 1. Growth of loudness and ECAP amplitude with current. Hear Res.247(2),87–99 (2009)
14. B Swanson, E Van Baelen, M Janssens, M Goorevich, T Nygard, K Van Herck, Cochlear implant signal processing ICs.IEEE 2007 Custom Intergrated Circuits Conference (CICC). San Jose, CA, (2007)
15. B Swanson,Pitch Perception with Cochlear Implants. inFaculty of Medicine, Dentistry & Health Sciences, Otolaryngology Eye and Ear Hospital. (University of Melbourne, Melbourne, 2008), p. 299
16. MS Fourakis, JW Hawks, LK Holden, MW Skinner, TA Holden, Effect of frequency boundary assignment on speech recognition with the Nucleus 24 ACE speech coding strategy. J Am Acad Audiol.18(8),700–717 (2007) 17. J Carroll, FG Zeng, Fundamental frequency discrimination and speech
perception in noise in cochlear implant simulations. Hear Res.231(1-2), 42–53 (2007)
18. MS Fourakis, JW Hawks, LK Holden, MW Skinner, TA Holden, Effect of frequency boundary assignment on vowel recognition with the Nucleus 24 ACE speech coding strategy. J Am Acad Audiol.15(4),281–299 (2004) 19. RE Crochiere, SA Webber, JL Flanagan, Digital coding of speech in
sub-bands. Bell Syst Tech J.55(8),1069–1085 (1976)
20. P Vary, U Heute, W Weiss, in Digitale Sprachsignalverarbeitung. vol. XIII. (B.G. Teubner, Stuttgart, 1998), p. 591
21. S Wyrsch,Adaptive Subband Signal Processing for Hearing Instruments. (ETH Zurich, Zurich, 2000)
23. J Laneau, J Wouters, M Moonen, Improved music perception with explicit pitch coding in cochlear implants. Audiol Neurotol.11, 38–52 (2006) 24. J Laneau, J Wouters, Multi-channel place pitch sensitivity in cochlear
implant recipients. J Assoc Res Otolaryngol.5, 285–294 (2004) 25. W Lai, N Dillier, MACarena: a flexible computer-based speech testing
environment.7th International Cochlear Implant Conference 2002. Manchester, (2002)
26. WR Drennan, JT Rubinstein, Music perception in cochlear implant users and its relationship with psychophysical capabilities. J Rehabil Res Dev.45(5), 779–789 (2008)
27. M Dorman, T Spahr, R Gifford, L Loiselle, S McKarns, T Holden, M Skinner, C Finley, An electric frequency-to-place map for a cochlear implant patient with hearing in the nonimplanted ear. J Assoc Res Otolaryngol.8(2), 234–240 (2007)
28. SA Omran, WK Lai, N Dillier, Pitch ranking Melody contour and instrument recognition tests using two semitone frequency maps for Nucleus Cochlear Implants. EURASIP J Audio Speech Music Process.2010(2010) [PP 1-16] 29. BJ Kwon, Cvd Honert, Dual-electrode pitch discrimination with sequential
interleaved stimulation by cochlear implant users. J Acoust Soc Am.120(1), EL1–EL6 (2006)
30. RG Stockwell, A basis for efficient representation of the S-transform. in
Digital Signal Processing.(2007). vol. 17. Issue 1, Academic Press Inc. Orlando, FL, USA, 2007)(1), , pp. 371–393
31. J Brown, Calculation of a constant Q spectral transform. J Acoust Soc Am. 89(1),425–434 (1991)
32. FCCB Diniz, I Kothe, SL Netto, LP Biscainho, High-selectivity filter banks for spectral analysis of music signals. EURASIP J Adv Signal Process. 2007(94704),12 (2007)
33. S Handel, Timbre perception and auditory object formation.Hearing M BC. (Academic Press, San Diego (CA), 1995), pp. 425–461
34. K Nie, G Stickney, FG Zeng, Encoding frequency modulation to improve cochlear implant performance in noise. IEEE Trans Biomed Eng.52(1),64–73 (2005)
35. F Chen, Y-T Zhang, A novel temporal fine structure-based speech synthesis model for cochlear implant. J Sigpro.88, 2693–2699 (2008)
36. S Omran, Detecting diagonal activity to quantify harmonic structure preservation with cochlear implant mappings. Int J Robot Autom.1(5), 100–112 http://www.cscjournals.org/csc/manuscript/Journals/IJRA/volume1/ Issue5/IJRA-21.pdf (2011)
doi:10.1186/1687-4722-2011-2
Cite this article as:Omranet al.:Semitone frequency mapping to improve music representation for nucleus cochlear implants.EURASIP Journal on Audio, Speech, and Music Processing20112011:2.
Submit your manuscript to a
journal and benefi t from:
7Convenient online submission 7Rigorous peer review
7Immediate publication on acceptance 7Open access: articles freely available online 7High visibility within the fi eld
7Retaining the copyright to your article