R E S E A R C H A R T I C L E
Open Access
New magnetic solid phase extractor based
on ionic liquid modified
β
-cyclodextrin
polymer/Fe
3
O
4
nanocomposites for
selective separation and determination of
linuron
Almojtaba Bakheet, Jie Liu and Xiashi Zhu
*Abstract
Background:Direct determination of trace analyte, in particular at ultra-trace concentration, cannot be easily achieved in complex systems by UV-visible spectrometry because of the lack of sensitivity and selectivity of the method. Therefore, an efficient separation step is often required prior to the determination. In accordance, a new magnetic solid phase extractor based on ionic liquid modified carboxymethyl-hydroxypropyl-β-cyclodextrin polymer magnetic particles Fe3O4functionalized with ionic liquid (IL-CM-HP-β-CDCP magnetic nanoparticles (MNPs)) was developed for a selective separation of linuron prior to its determination by UV-visible spectrometry.
Methods:Ionic liquid modified carboxymethyl-hydroxypropyl-β-cyclodextrin polymer magnetic particles Fe3O4 (Fe3O4@IL-CM-HP-β-CDCP) were confirmed by Fourier transform infrared spectroscopy, scanning electron microscopy, and X-ray powder diffraction (XRD). The uptake behavior of the new Fe3O4@IL-CM-HP-β-CDCP MNPs adsorbent toward linuron was studied. The concentrations of linuron were directly determined after reading absorbance by UV-visible spectrometry.
Results:Fourier transform infrared spectroscopy, scanning electron microscopy, and XRD results strongly confirmed the formation of Fe3O4@IL-CM-HP-β-CDCP MNPs phase. Adsorption study revealed the Fe3O4@IL-CM-HP-β-CDCP MNPs for a selective separation of linuron prior to its determination by UV-visible spectrometry. The results showed that linuron was adsorbed rapidly on Fe3O4@IL-CM-HP-β-CDCP MNPs and eluted by 4.0 mL ethanol in 15 min. Under the optimized conditions, the linear calibration curves for linuron were obtained over the concentration range of 0.07–19.00μg mL−1 with a relative standard deviation of 1.97 % (n= 3,c= 4.00μg mL−1). The detection limits, the limit of quantification, correlation coefficient (R), and preconcentration factor were 7.0μg L−1, 70.0μg L−1, 0.9987, and 15, respectively.
Conclusions:Ultimately, the developed method can be applied and effectively utilized for the determination of linuron in real samples.
Keywords:Linuron, Ionic liquid, Nanocomposites, Magnetic solid phase extraction, UV-visible spectroscopy
* Correspondence:[email protected]
College of Chemistry & Chemical Engineering, Yangzhou University, Yangzhou 225002, People’s Republic of China
Background
Linuron (Fig. 1) is one of the urea herbicides; it was de-veloped by the DuPont as urea herbicides in 1960 and was widely used in agricultural production (Lima et al. 2011). But, it could exist in environment stably for a long time and thus pollute the soil and surface water, seriously damaging the groundwater and organisms (Ornostay et al. 2013). Toxicological studies indicated that these herbicides have different degrees of toxicity on humans and even have carcinogenic effects (Daam et al. 2009). Therefore, the accurate, sensitive, and at the same time quick and easy detection of linuron residues in fruits and vegetables is a method of great significance. Various methods have been developed for the deter-mination of linuron to date, including HPLC (Katsumata et al. 2007), electrochemical method (Lima et al. 2011), HPLC-MS (Petrovic et al. 2010), sensor method (Ciumasu et al. 2005), capillary electrophoresis (Da Silva et al. 2003), and UV spectrometry (Chen and Zhu 2015). UV spec-trometry has many advantages including simple operation, lower cost, and repeatable results. However, the direct de-termination with spectrophotometry for linuron is difficult owing to matrix effects and its lower concentration in nat-ural samples. So, UV spectrometry is often combined with separation/enrichment technique to improve the selectivity and sensitivity of detection (Chen and Zhu 2015).
Magnetic solid phase extraction (MSPE) is a kind of magnetic or magnetizable material as absorbent matrix solid phase extraction technique (Giakisikli and Anthemidis 2013), which has many advantages including simple oper-ation, short extraction time, low organic solvent consump-tion, and easy automation. It has a broad application prospect in detection analysis (Jiang et al. 2013). To date, MSPE extraction agent is mainly Fe3O4nanoparticles (NPs)
with specific chemical functional group modified on the surface to achieve concentration of the targeted analytes. Numerous organic polymers and inorganic polymers have been used to modify Fe3O4NPs. The unique structures of
cyclodextrins (CDs), which have a cavity possessing a hydrophilic external surface and a hydrophobic internal surface, make them useful in separation processes.β-CDCP by polymerizing cyclodextrin with epichlorohydrin was a spherical or grainy solid subject and insoluble in water, which still retained the inclusion property of β-CD, was synthesized by the reaction of β-CD and cross-linked
agent. β-CDCP as a solid phase extraction material had been applied to selectively separation/preconcentration the similar size of materials (Zhu and Ping 2014). Yu et al. modified the Fe3O4NPs with hydroxypropyl-β-cyclodextrin
(HP-β-CD) and polyethyleneglycol 400 (PEG400) for the removal of congo red from aqueous solutions (Yu et al. 2014). The related research by our group indicated (1) Fe3O4@cyclodextrin polymer NPs (Fe3O4@β-CDCP) as
ad-sorbents for preconcentration/extraction of rutin from lotus plumule (Gong et al. 2014) and (2) self-assembly Fe3O4@SiO2@ILs as adsorbents for
preconcentration/ex-traction of linuron (Chen and Zhu 2015). But, there was no report to separation/analysis linuron with Fe3O4
@IL-CM-HP-β-CDCP magnetic nanoparticles (MNPs).
In this study, carboxymethyl-hydroxypropyl-β -cyclo-dextrin polymer magnetic particles Fe3O4(Fe3O4
@CM-HP-β-CDCP) which has a good hydrophobic and stability properties were prepared and modified with ionic liquid (Fe3O4@IL-CM-HP-β-CDCP). The magnetic
solid phase extraction followed by UV-vis spectroscopy was applied to separation/analysis linuron in real samples with reasonable results. Compared with the previously re-ported works, (1) this adsorbent-based MSPE provides a rapid and efficient sample preparation process, which en-ables the treatment of large volume samples in a short period of time (Gong et al. 2014; Cheng et al. 2012) and (2) the adsorbent Fe3O4@IL-CM-HP-β-CDCP MNPs
could be used repeatedly and better preconcentration factor (Chen and Zhu 2015).
Methods
Materials and reagents
Fourier transform infrared spectroscopy (FTIR) spectra were measured with a Bruker Tensor 27 spectrometer
Fig. 1Chemical structure of linuron
4000 3500 3000 2500 2000 1500 1000 500
nm-1
a
b
c
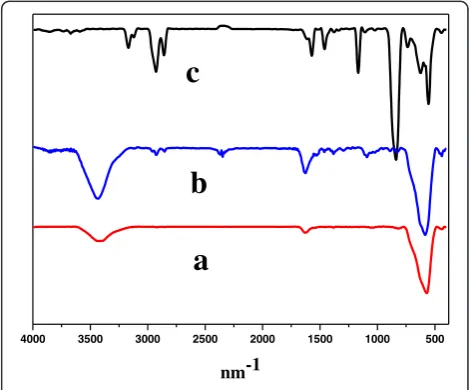
Fig. 2Infrared spectra.aFe3O4.bFe3O4@CM-HP-β-CDCP.
(Bruker Company, Germany). Samples were pressed into KBr pellets and recorded at the frequencies from 4000 to 400 cm−1 with resolution of 4 cm−1. A SEM Hitachi S-4800 II instrument was used to obtain micrographs of the material. UV-2500 spectrophotometer (Shimadzu Corporation, Japan) was used. Neodymium magnet and timing multifunctional oscillator (Guohua Limited Com-pany, China), a digital water-bath (Guohua Limited Company, China), and pH meter (Shanghai Jinke Lim-ited Company, China) were used.
All chemicals and reagents were at least of analytical reagent grade, unless otherwise stated, as follows:N -methy-limidazole (Darui Fine Chemicals, Shanghai, China), 1-bromooctane (Sinopharm Chemical Reagent Co., Ltd., Shanghai, China), KPF6, FeCl3, FeSO4· 7H2O, acetone,
methylene chloride, NaOH, HCl, carbinol, ethanol, sodium dodecyl sulfate (SDS), acetonitrile (ACN), hydroxypropyl-β -cyclodextrin, and epichlorohydrin (Shanghai Chemical Re-agent Corporation, China). Linuron standards were ob-tained from the Sigma-Aldrich (Shanghai, China). A standard stock solution was prepared by dissolving 10.0 mg of each standard in 100 mL of ethanol and stored in dark at 4 °C. Working standard solutions were obtained by appro-priate dilution of the stock solution.
Experiment method
Synthesis of Fe3O4@IL-CM-HP-β-CDCP MNPs
Synthesis of CM-HP-β-CDCP MNPs CM-HP-β-CDCP
MNPs were prepared according to literature (Badruddoza et al. 2013).
Synthesis of Fe3O4@IL-CM-HP-β-CDCP MNPs
[C8MIM][PF6] was synthesized according to literature
(Zhao et al. 2007). Then, 5 g of CM-HP-β-CD polymer was stirred for 3 days in 20 mL of [C8MIM][PF6]
medium for effective impregnation. The adsorbent was dried at 90 °C for 3 days. Then, the product was dried at 90 °C for 24 h and sonicated for 1 day again, and the resulting polymer was Fe3O4@IL-CM-HP-β-CDCP MNPs.
Sample preparation
Water sample: Lake water was collected from the Slender West Lake in Yangzhou, China. A 50.0 mL of lake water sample was filtered through a 0.45-μm membrane to re-move suspended particles before analysis.
Fruit and vegetable samples (Farokhcheh and Alizadeh 2013): Apple and lettuce samples were supplied by our local market. A 20.0 g of apple (or lettuce) slurry and 20 mL anhydrous ethanol were placed in a 50-mL cen-trifuge, and the mixture was then shaken for 20 min. After centrifugation, the upper fluids in the tube were filtered and collected in a volumetric flask.
Procedure of adsorption and elution
A 40.0 mL of the working solution or aqueous sample and 0.10 g of Fe3O4@IL-CM-HP-β-CDCP MNPs were
transferred into a centrifuge tube, and the solution in the tube was subsequently shaken in the constant temperature shaking table for 20 min at room temperature. Then, Fe3O4@IL-CM-HP-β-CDCP MNPs
with adsorbed target linuron was separated from the solution by an external magnetic field. The residual linuron in the supernatants was determined by UV-vis spectroscopy at 246 nm.
In the adsorption of linuron Fe3O4@IL-CM-HP-β-CDCP
MNPs with 4.0 mL ethanol ultrasound elution for 20 min, eluent were determined by the UV-vis spectroscopy.
Determination of inclusion constant
The procedure of the determination of inclusion con-stant was based on the literature (Zhou et al. 2013).
Results and discussion
Characterization of Fe3O4@CM-HP-β-CDCP MNPs Characterization by FTIR
Figure 2 shows the FTIR spectra of Fe3O4 (curve a),
Fe3O4@CM-HP-β-CDCP MNPs (curve b), and Fe3O4
@IL-CM-HP-β-CDCP MNPs (curve c) in the range of 4000– 400 cm−1wave number range. The results are as follows: (1) the peak of 580 cm−1showed was assigned to Fe-O-Fe stretching vibration (curve a and b), the peak of 2400 and 2850 cm−1on curve b corresponded to the C-H stretching vibration in CM-HP-β-CDCP, and the peaks at 1628 cm−1 on curve b was stronger than on curve a, which illustrated that CM-HP-β-CD was coated Fe3O4surface (curve a and
b); (2) in the curve c, the peaks at 3171 and 3125 cm−1 em-body the spectrum of the C-H stretching vibration, the peaks at 1573 and 1462 cm−1corresponded to the charac-teristic absorption of imidazole groups, and 739 cm−1 cor-responded to long chain CH2; moreover, the peak of
840 cm−1 was attributed to the P-F stretching vibration. These results confirm that IL had been successfully immo-bilized on the surface of Fe3O4@CM-HP-β-CDCP MNPs
(curve b and c).
Characterization by SEM
The morphological structures of Fe3O4(A), Fe3O4
@CM-HP-β-CDCP(B), and Fe3O4@IL-CM-HP-β-CDCP(C) were
investigated with the scanning electron micrographics showed in Fig. 4. It could be seen that (1) the globular ap-parent structure was not changed after CM-HP-β-CD coated on Fe3O4 (Fig. 4a, b) and (2) the morphology of
Fe3O4@IL-CM-HP-β-CDCP MNPs was distinctly
Fe3O4@CM-HP-β-CDCP MNPs were successfully coated
by [C8MIM][PF6] (Fig. 3).
Characterization by XRD
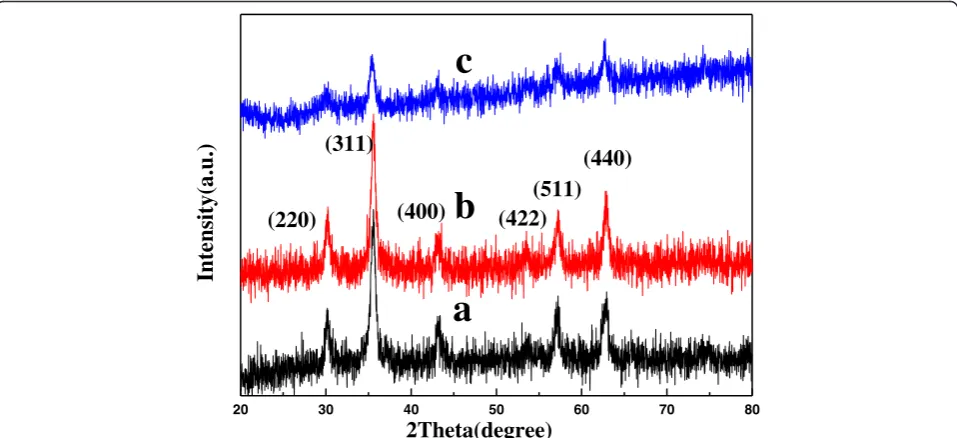
X-ray powder diffraction (XRD) measurements were car-ried out to investigate the phase structure of the obtained samples. The XRD pattern of Fe3O4(curve a), Fe3O4
@CM-HP-β-CDCP MNPs (curve b), and Fe3O4@IL-CM-HP-β
-CDCP MNPs (curve c) were shown in Fig. 4. Six character-istic diffraction peaks of Fe3O4could be found at 2θ= 30.1°,
35.4°, 43.1°, 53.4°, 57.2°, and 62.5°; these could be assigned to diffractions from the (220), (311), (400), (422), (511), and (440) planes of Fe3O4, respectively, indicating that
modifi-cation of the MNP surface with CM-HP-β-CD and IL did not change the phase of Fe3O4, but the peaks of Fe3O4
@IL-CM-HP-β-CDCP MNPs became weaker than naked Fe3O4.
Magnetization curves
The magnetic properties of magnetic absorbents directly influence recovery efficiency. In this study, VSM was used to estimate the magnetic properties of the prepared nanocomposite at room temperature. Figure 5 shows the hysteresis loops for the material (a) Fe3O4, (b) Fe3O4
@CM-HP-β-CDCP MNPs, and (c) Fe3O4@IL-CM-HP-β-CDCP
MNPs. The maximal saturation magnetization of Fe3O4
(-curve a) was 48 emu g−1; after modified with CM-HP-β -CD and IL-CM-HP-β-CD, the maximal saturation magneti-zations decreased to 31 and 21 emu g−1, respectively. It may be caused by the nonmagnetic of CM-HP-β-CD and IL-CM-HP-β-CD. The saturation magnetization of 16.3 emu g−1was sufficient for magnetic separation with a magnet (Caruntu et al. 2004). Therefore, the IL-CM-HP-β-CD MNPs prepared here could be rap-idly separated from solution with a magnet on the account of their superparamagnetism and large satur-ation magnetizsatur-ation.
Optimization of adsorption
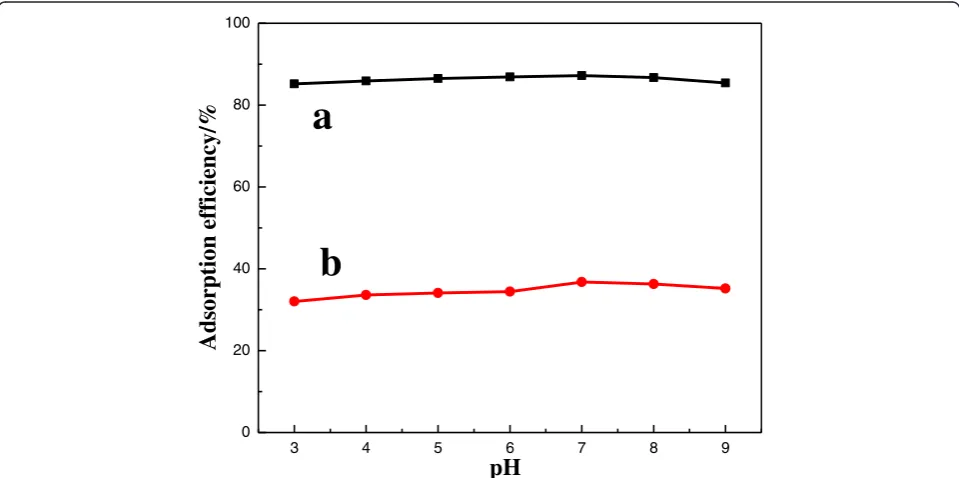
Effect of pH
The effect of pH was investigated by varying the pH values between 3.0 and 9.0 (Fig. 6). The results depicted that (1) the adsorption behavior of linuron on Fe3O4@CM-HP-β
-CDCP MNPs (curve a) and Fe3O4@IL-CM-HP-β-CDCP
MNPs (curve b) was similar, the adsorption efficiency of linuron on Fe3O4@CM-HP-β-CDCP MNPs(E1) was lesser
than that on Fe3O4@IL-CM-HP-β-CDCP MNPs(E2), and
linuron could only quantitatively be absorbed on Fe3O4@IL-CM-HP-β-CDCP MNPs. It may be caused by
the effect of IL on the Fe3O4@CM-HP-β-CDCPMNPs
about its hydrophobicity (Ma et al. 2005); (2) linuron could be quantitatively absorbed on Fe3O4@IL-CM-HP-β-CDCP
MNPs in the test pH range, and maximum at pH = 7.0, which showed that the adsorption efficiency of linuron was not affected by pH. Thus, all subsequent studies were performed in pH 4.0–7.0.
Fig. 3SEM image.aFe3O4.bFe3O4@CM-HP-β-CDCP.
cFe3O4@IL-CM-HP-β-CDCP
20 30 40 50 60 70 80
(440)
(511)
(422)
(400)
(311)
).
u.
a(
yti
s
ne
t
nI
2Theta(degree)
a
b
c
(220)
Effect of adsorption temperature
The effect of temperature (10.0 °C 50.0 °C) on the ad-sorption efficiency of linuron was tested. Linuron could effectively be absorbed on the Fe3O4@IL-CM-HP-β
-CDCP MNPs in the range of 20–40 °C; herein, the ad-sorption of the analyte was conveniently carried out at room temperature.
Effect of adsorption time
The effect of adsorption time on the adsorption efficiency was carefully studied in the range from 5– 60 min. The results illustrated that adsorption efficiency of linuron finished after 20 min and stabled. Thereafter, 20 min of extraction time was performed for further study.
-10000 -5000 0 5000 10000
-60 -40 -20 0 20 40 60
)
g/
u
me
(
n
oi
t
az
it
e
n
g
a
M
Magnetic field(Oe)
a
b
c
Fig. 5Magnetic hysteresis loops.aFe3O4.bFe3O4@CM-HP-β-CDCP.cFe3O4@ IL-CM-HP-β-CDCP
3 4 5 6 7 8 9
0 20 40 60 80 100
%/
yc
ne
ic
if
fe
n
oi
t
pr
os
d
A
pH
a
b
Effect of sample volume
The concentration of linuron was fixed at 4.0 μg mL−1, and the volume of the sample solution was increased from 5.0 to 70.0 mL. It could be seen in Fig. 7 that the adsorp-tion efficiency was greater than 85.0 % in the sample vol-ume of 5.0–60.0 mL and decreased when the sample volume was greater than 60.0 mL, so the allowed sample volume was 60.0 mL.
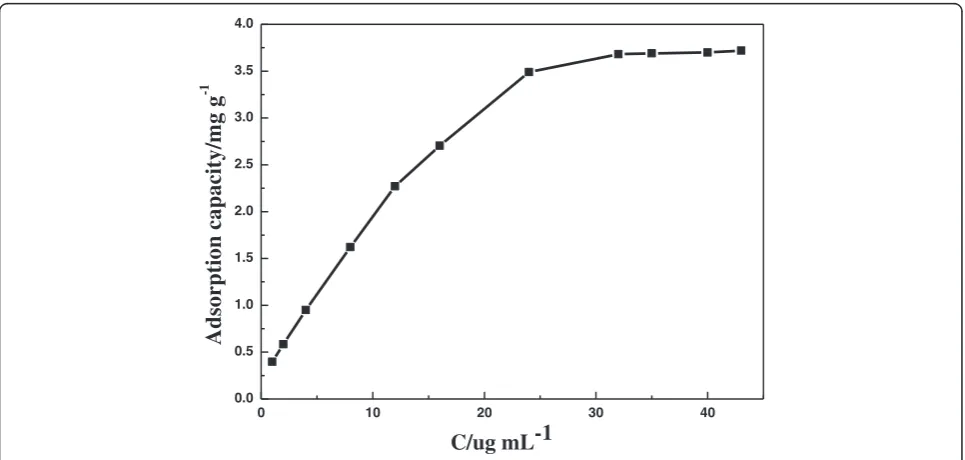
Adsorption capacity
Adsorption capacity is defined as the maximum amount of analyte adsorbed per gram of Fe3O4@IL-CM-HP-β
-CDCP MNPs. The adsorption capacity (qe in mg g−1) of linuron was calculated based on the difference in the linuron concentration in the solution before and after adsorption (Akkaya 2013), according to the following equation:
0 10 20 30 40 50 60 70 80
0 20 40 60 80 100
%/
yc
ne
ic
if
fe
n
oi
t
pr
os
d
A
V/mL
Fig. 7Effect of sample volume on the adsorption efficiency
0 10 20 30 40
0.0 0.5 1.0 1.5 2.0 2.5 3.0 3.5 4.0
g
g
m/
yti
c
a
p
ac
n
oi
t
pr
os
d
A
-1
C/ug mL-1
qe¼
Co−Ce
ð Þ V
m
whereCoandCeare the initial and equilibrium
concen-tration of linuron (μg mL−1), m is the weight of Fe3O4@IL-CM-HP-β-CDCP (g), and Vis the volume of
solution (mL).
Figure 8 indicates that the adsorption of linuron reached the maximum when the concentration was 43.00 μg mL−1; the adsorption capacity for Fe3O4
@IL-CM-HP-β-CDCP MNPs was calculated finally as 3.72 mg g−1.
Optimization of elution
Selection of eluent
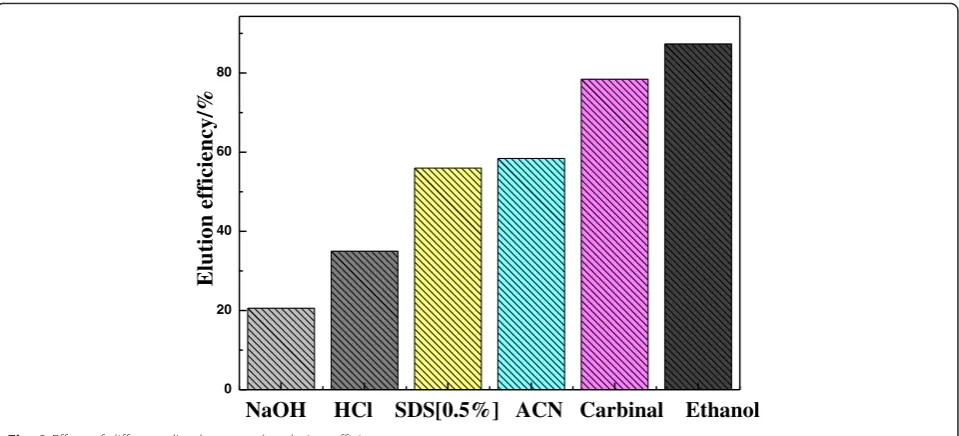
The selection of eluent type is of vital importance which determines the final extraction efficiency. Therefore, sev-eral eluent (0.1 mol/L HCl, NaOH, 0.5 % SDS, ACN, carbinol, ethanol) were tested in this work. As can be seen from Fig. 9, the ethanol had the strongest elution capacity for linuron. Thus, ethanol was chosen as the final eluent.
Effect of elution temperature
The elution efficiency of linuron at different tempera-tures (10–50 °C) was studied. The elution efficiency 0
20 40 60 80
%/
yc
ne
ic
if
fe
n
oi
t
ul
E
NaOH HCl SDS[0.5%] ACN Carbinal Ethanol
Fig. 9Effect of different dissolvent on the elution efficiency
2 3 4 5 6 7
0 20 40 60 80 100
%/
yc
ne
ic
if
fe
n
oi
t
ul
E
V/mL
increased progressively with the temperature from 5 to 20 °C. And, the elution efficiency of linuron was greater than 85.0 % and remained constant at the elution temperature ranging from 20 to 40 °C. Accordingly, the elution was performed at room temperature.
Effect of elution time
The effect of elution time on the elution of linuron was also estimated. The elution efficiency of linuron became stable after 15 min. Thereafter, 15 min of elution time was selected for further studies.
Effect of eluent volume
Then, elution efficiency of linuron with 2.0–7.0 mL of ethanol was studied (Fig. 10). The elution efficiencies of linuron was above 85 % from 4.0 to 7.0 mL and reached the biggest in 4.0 mL. The preconcentration factor is 15 (the quotient of volume before absorption and after elution). Therefore, the optimum volume of ethanol solution chosen for this work was 4.0 mL.
Reuse of Fe3O4@IL-CM-HP-β-CDCP MNPs
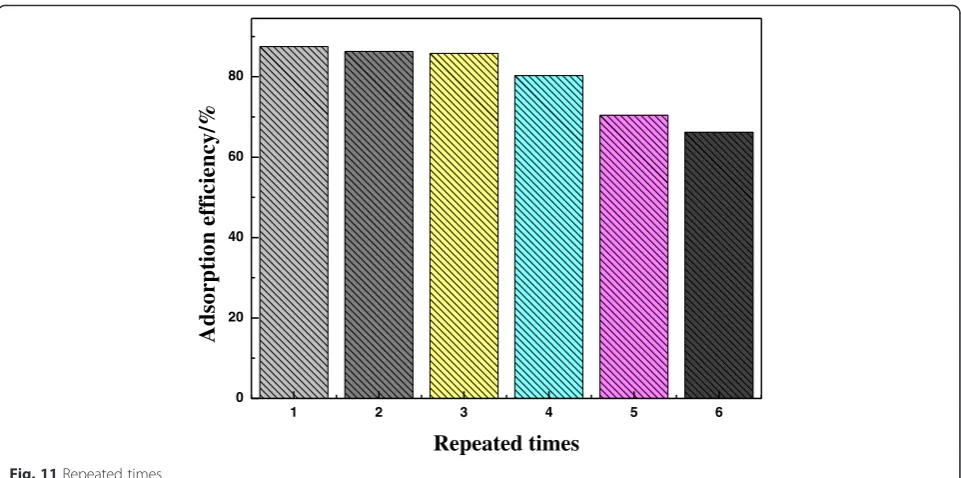
The reusability of IL-CM-HP-β-CDCP MNPs was evaluated through consecutive adsorption and elution cycles. As shown in Fig. 11, the IL-CM-HP-β-CDCP MNPs could be reused at least five times along with the adsorption efficiency of above 85.0 % for linuron.
Effect of interference
Determination of linuron (5.00 μg L−1) in the presence of foreign substances was investigated. With a relative error less than ±5 %, the tolerance limits for various foreign substances are listed in Table 1 (tolerance ratio in mass). The results indicated that the majority of these
1 2 3 4 5 6
0 20 40 60 80
%/
yc
ne
ic
if
fe
n
oi
t
pr
os
d
A
Repeated times
Fig. 11Repeated times
Table 1Tolerance of interference ions
Interference Tolerance ratio in mass (w/w) (tested substances to analyte ratio)
Zn2+ 200
Cu2+, tebuconazole 40
Triadimefon, 2-nitrophenol 20
Fe3+, NO3−, SO4
2− 15
Carbendazim, benomyl, acetamiprid 15
4-Nitrophenol, phenol 15
Diuron 5
Table 2The recoveries of linuron in samples (n= 3)
Sample Added (μg/mL) Found (μg/mL) Recovery (%)
Lake water 0.00 ND –
0.50 0.48 96.0
4.00 3.93 98.3
8.00 7.91 98.9
Lettuce 0.00 ND –
0.50 0.49 98.0
4.00 3.98 99.5
8.00 8.05 100.6
Apple 0.00 ND –
0.50 0.48 96.0
4.00 3.96 99.0
8.00 7.94 99.3
substances in samples had no remarkable interference on the linuron determination.
Analytical performance of the method
Once optimized, the method was finally characterized in terms of linearity, precision, accuracy, and sensitivity. Under the optimum conditions, the matrix matching cali-bration curve of noninterference was established with standard addition method in the concentration range of 0.07–19.0μg mL−1. The equation of calibration graph was A= 0.231c+ 0.057 (μg mL−1), with a correlation coefficient of 0.9987. The limit of detection, defined as LOD = 3σ/k (where σ is the standard deviation of blank and k is the slope of calibration graph) was 7.0 μg L−1. The limit of quantification was 70.0 μg L−1. The precision (relative standard deviation) was 1.97 % (n= 3, c= 4.00 μg mL−1). The preconcentration factor, defined as the quotient of vol-ume before absorption and after elution, was 15-fold.
Sample analysis
Under the optimum conditions, the proposed method was applied to determine linuron in lake water, lettuce, and apple samples. Since no positive samples were found, a recovery study was performed using the stand-ard addition method with the analyte at three different concentrations (12.5, 25.00, and 125.0 μg kg−1). The data, which is summarized in Table 2, showed the accur-acy (excellent recovery values) in all instances, and the proposed methodology was suitable for the determin-ation of linuron.
Comparison with other methods
Compared to other methods, it is obvious that the present work has low detection limit and wide linear range (Table 3). Moreover, the proposed method has ad-vantages of simple operation and lower analysis cost.
Discussion of extraction mechanism
The inclusion constant K is a significant parameter which illustrates inclusion interactions of host-guest
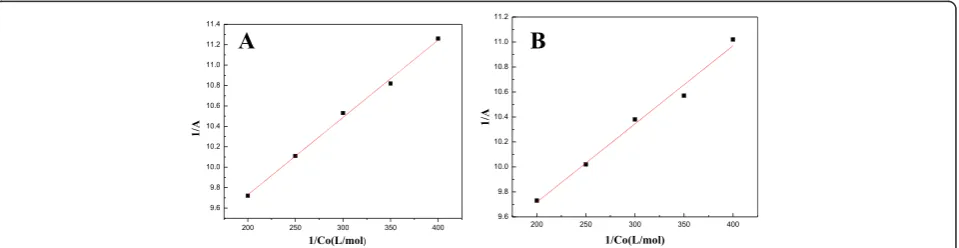
molecules. The inclusion complex can be easily formed at a higherK. The inclusion constants of the monomers of two kinds of polymers (CM-HP-β-CD and IL-CM-HP-β-CD) and linuron were measured. The form of in-clusion and the inin-clusion constant can be calculated by UV-visible absorption spectroscopy and Hildebrr and Benesi equation (Zhao et al. 2007).
The double reciprocal plots of the (CM-HP-β -CD)-linuron inclusion complex (A) and (IL-CM-HP-β -CD)-linuron inclusion complex (B) are shown in Fig. 12. It can be concluded that (1) the two double reciprocal plots show good linearity with correlation coefficients of 0.9961 for CM-HP-β-CD (Fig. 12a) and 0.9844 for CM-HP-β -CD-IL (Fig. 12b), which illustrated that both CM-HP-β -CD and IL-CM-HP-β-CD form the inclusion complexes with linuron at a ratio of 1:1 and (2) the inclusion constant of CM-HP-β-CD-linuron inclusion complex and for IL-CM-HP-β-CD-linuron inclusion complex is K11.08 × 103
andK21.35 × 103L/mol, respectively, which are acquired
by the slope and intercept of the double reciprocal plots. On the basis of the inclusion constant, we could get the following conclusion: (1) Inclusion constant reflects the inclusion ability of a host molecule to a guest molecule. K2>K1, which is consistent with the adsorption efficiency
of linuron (E2> E1) (Fig. 6), demonstrated that the
inclu-sion ability of IL-CM-HP-β-CD toward linuron is stronger
Table 3Comparison with the results in other literatures
Method Linear range
(μg mL−1) Limit ofdetection
(μg L−1)
Ref.
SPE/HPLC – 50.0 Zhao et al.2004
MSPD/RP-HPLC 0.025–10.00 10.0 Xiao et al.2010
Micro extraction bottles enrichment/ HPLC
0.06–6.00 5.0 Li et al.2013
MSPE/UV 0.04–20.00 5.0 Chen and Zhu
2015
MSPE/UV 0.07–19.00 7.0 The proposed
method
Fig. 12Double reciprocal plot of the CM-HP-β-CD-linuron inclusion complex (a) and the (IL + CM-HP-β-CD)-linuron inclusion complex (b). Theerror
than of CM-HP-β-CD. That is one reason why IL-CM-HP-β-CD has a higher adsorption efficiency than CM-HP-β-CD; (2) the difference value ofKbetweenK1andK2is
not large, but the adsorption efficiency is obviously improved (E2> >E1) (Fig. 6). It is mainly because the
hydrophobic IL in Fe3O4@IL-CM-HP-β-CDCP MNPs is
good for the adsorption to hydrophobic pesticides linuron.
Conclusions
Fe3O4@IL-CM-HP-β-CDCP MNPs used as a solid phase
extraction material to preconcentrate/separate linuron coupled with UV for the analysis of linuron is established. The proposed method has some advantages, such as easy, safe, and inexpensive methodology for the separ-ation/determination of linuron in fruit and vegetable samples.
Competing interests
The authors declare that they have no competing interests.
Authors’contributions
XSZ designed the experiment and revised the manuscript. Experimental part and manuscript were carried out by AB, JL and XSZ is the corresponding author. All the authors have read and approved the final manuscript.
Acknowledgements
The authors acknowledge the financial support from the National Natural Science Foundation of China (21375117) and a project funded by the Priority Academic Program Development of Jiangsu Higher Education Institutions.
Received: 3 October 2015 Accepted: 11 January 2016
References
Akkaya R. Removal of radioactive elements from aqueous solutions by adsorption onto polyacrylamide-expanded perlite: equilibrium, kinetic, and
thermodynamic study. Desalination. 2013;321:3–8.
Badruddoza AZM, Shawon ZBZ, Daniel TWJ, Hidajat K, Uddin MS. Fe3O4/ cyclodextrin polymer nanocomposites for selective heavy metals removal from industrial wastewater. Carbohydr Polym. 2013;91:322–32. Caruntu D, Caruntu G, Chen YX, O’Connor CJ, Goloverd G, Kolesnichenko VL.
Synthesis of variable-sized nanocrystals of Fe3O4with high surface reactivity. J Mater Chem. 2004;16:5527–34.
Chen JP, Zhu XS. Ionic liquid coated magnetic core/shell Fe3O4@SiO2 nanoparticles for the separation/analysis of linuron in food samples. Spectrochim Acta A. 2015;137:456–62.
Cheng Q, Qu F, Li NB, Luo HQ. Mixed hemimicelles solid-phase extraction of chlorophenols in environmental water samples with 1-hexadecyl-3-methylimidazolium bromide-coated Fe3O4magnetic nanoparticles for high-performance liquid chromatographic analysis. Anal Chim Acta. 2012;715:113–9. Ciumasu IM, Kramer PM, Weber CM, Kolb G, Tiemann D, Windisch S, et al. A new,
versatile field immunosensor for environmental pollutants: development and proof of principle with TNT, diuron, and atrazine. Biosens Bioelectron. 2005;21:354–64.
Da Silva CL, De Lima EC, Tavares MFM. Investigation of preconcentration strategies for the trace analysis of multi-residue pesticides in real samples by capillary electrophoresis. J Chromatogr A. 2003;1014:109–16.
Daam MA, Rodrigues AMF, Van den Brink PJ, Nogueira AJA. Ecological effects of the herbicide linuron in tropical freshwater microcosms. Ecotoxicol Environ Saf. 2009;72:410–23.
Farokhcheh A, Alizadeh N. Determination of diphenylamine residue in fruit samples using spectrofluorimetry and multivariate analysis. LWT Food Sci Technol. 2013;54:6–12.
Giakisikli G, Anthemidis AN. Magnetic materials as sorbents for metal/metalloid preconcentration and/or separation. Anal Chim Acta. 2013;789:1–16.
Gong AQ, Ping WH, Wang J, Zhu XS. Cyclodextrin polymer/Fe3O4 nanocomposites as solid phase extraction material coupled with UV–vis spectrometry for the analysis of rutin. Spectrochim Acta A. 2014;122:331–6. Jiang HM, Yang T, Wang YH, Lian HZ, Hu X. Magnetic solid-phase extraction
combined with graphite furnace atomic absorption spectrometry for speciation of Cr(III) and Cr(VI) in environmental waters. Talanta. 2013;116:361–7. Katsumata H, Asai H, Kaneco S, Suzuki T, Ohta K. Determination of linuron in
water samples by high performance liquid chromatography after preconcentration with octadecyl silanized magnetite. Microchem J. 2007;85:285–9.
Li H, Shi LM, Zhou JK. Determination of urea herbicide in tea drinks by microextraction flask-liquid chromatography. Food Ferment Technol. 2013;49:78–81.
Lima F, Gozzi F, Fiorucci AR, CardosoC AL, Arruda GJ, Ferreira VS. Determination of linuron in water and vegetable samples using stripping voltammetry with a carbon paste electrode. Talanta. 2011;83:1763–8.
Ma Z, Guan Y, Liu H. Synthesis and characterization of micron-sized monodisperse superparamagnetic polymer particles with amino groups. J Polym Sci A. 2005;43:3433–9.
Ornostay A, Cowie AM, Hindle M, Baker CJO, Martyniuk CJ. Classifying chemical mode of action using gene networks and machine learning: a case study with the herbicide linuron. Comp Biochem Physiol Part D. 2013;8(4):263–74. Petrovic T, Dordevic J, Dujakovic N, Kumric K, Vasiljevic T, Lausevic M.
Determination of selected pesticides in environmental water by employing liquid-phase microextraction and liquid chromatography-tandem mass spectrometry. Anal Bioanal Chem. 2010;397:2233–43.
Xiao L, Wang YC, Cheng MR. Determination of phenylureas herbicide residues in tea with matrix solid-phase dispersion-RP-HPLC. J Tea Sci. 2010;1:52–6. Yu L, Xue WH, Cui L, Xing W, Cao XL, Li HY. Use of hydroxypropyl-β-cyclodextrin/
polyethylene glycol 400, modified Fe3O4nanoparticles for congo red removal. Int J Biol Macromol. 2014;64:233.
Zhao JY, Xin JH, Guo YN, Cui XJ, Zhang M, Li JC. Determination of three phenylurea herbicides in water using solid phase extraction and high performance liquid chromatography. Chin J Anal Chem. 2004;32:939–42. Zhao FY, Wang JY, Liu HJ, Liu RJ. Synthesis and properties of a series of
room-temperature ionic liquids N-alky-l-N-methylimidazolium hexafluorophosphates. Huaxue Shiji. 2007;4(29):229–31.
Zhou N, Sang RH, Zhu XS. Functionalizedβ-cyclodextrin polymer solid phase extraction coupled with UV–visible spectrophotometry for analysis of kaempferol in food samples. Food Anal Methods. 2013;7:1256–60. Zhu XS, Ping WH. Optimization ofβ-cyclodextrin cross-linked polymer for
monitoring of quercetin. Spectrochimica Acta A. 2014;132:38–43.
Submit your manuscript to a
journal and benefi t from:
7Convenient online submission
7Rigorous peer review
7Immediate publication on acceptance
7Open access: articles freely available online
7High visibility within the fi eld
7Retaining the copyright to your article