Application of direct steam injection system to minimize browning
of white radish (
Raphanus sativus
) broth during sterilization
Tae Hoon Ham, Won Byong Yoon
(Dept. of Food Sci. and Biotechnology, Kangwon National University, Chuncheon, Gangwon-do 24341, South Korea)
Abstract: Direct steam injection (DSI) was applied to minimize the quality changes of white radish (Raphanus sativus) broth during sterilization. This study compared the degree of browning of white radish broth from a retort sterilization system and a DSI system. The quality changes after thermal treatments, such as retorting and DSI, were evaluated by Lab color values, the browning index (BI) and sensory evaluation. As the volume of the retort pouch increased, the thermal processing time increased. Significant increases of a and b values, color difference and BI were observed. Unlike the retort sterilization, the DSI treatment showed no significant differences in color properties of the radish broth with a wide range of sterilization temperature. The highest sensory score among the DSI treated samples was observed at the lowest sterilization temperature (125°C). The results demonstrated that the DSI treatment showed a higher stability in the quality associated with the browning reaction, such as the color indices and BI because the DSI process rapidly increased the temperature of the radish broth by transferring the latent heat of steam to the fluid.
Keywords: direct steam injection (DSI), retort, sterilization, quality, browning, white radish broth, sensory evaluation DOI: 10.25165/j.ijabe.20171006.3350
Citation: Ham T H, Yoon W B. Application of direct steam injection system to minimize browning of white radish (Raphanus sativus) broth during sterilization. Int J Agric & Biol Eng, 2017; 10(6): 210–220.
1 Introduction
From ancient times, Asian countries have used broth
for flavoring soups and stews. Generally, the broth is
prepared with various ingredients, such as white radish,
kelp, anchovy, and meat through prolonged boiling.
The broth traditionally provides a base taste for many
foods, which contributes to the enhancement of deep and
strong flavors in food. As meat or bone is boiled in
water for a long time, constituents like albumin, protein,
peptides and amino acids dissolve into the water[1].
Radish has been utilized as a fundamental producer of
flavor in soup with meat, fish, and fish cakes. Radish
broth has a browning response due to the thermal
Received date: 2017-03-17 Accepted date: 2017-06-25 Biographies: Won Byong Yoon, Professor, research interests: food process engineering, Email:[email protected]. *Corresponding author: Won Byong Yoon, Professor, research interests: food process engineering, Dept. of Food Sci. and Biotechnology, Kangwon National University, Chuncheon, Gangwon-do 24341, S. Korea. Tel/Fax: 82-33-250-6459/82-33- 259-5565, Email: [email protected].
processing that is a part of broth production. Andi et
al.[2] reported that the main mechanism of radish
browning is polyphenol oxidase catalyzed oxidation of
polyphenol compounds in white radish. However, a
high temperature treatment (>90°C) inactivates the polyphenol oxidase during heat treatment[3]. Thus, the browning reaction of radish broth at a high temperature is
mainly due to Maillard reaction[4]. The browning
response of radish implies that heat sterilization
importantly influences on the quality of radish broth in
the commercial mass production.
Processed food packaged in pouches or cans generally
uses a retort method for the sterilization, which is a batch
type of thermal process that heats a product packaged in a
container with steam or water at high temperatures and
pressures. Although the retort method assures
commercially safe food products, as microorganisms and
spores are inactivated, its disadvantages include
generation of off-flavors and destruction of pigments or
bioactive components, such as polyphenol anti-oxidant
Since the commercial value of the processed food
depends largely on taste, nutritional value and safety, an
optimized processing is essential to produce commercial
food products that are safe while maintaining quality
during sterilization. The size of packages of retorted
food products can be decided upon the demanding of its
final users. For consumers, the size of the retort product
is small, while, for industrial food services, a bulk size
product is needed for efficiency. Sterilization time
should be controlled by the size of the package to
maintain a consistent degree of sterilization. Thus, the
sterilization time is different for a small package product
and a bulk packaged product. When the sterilization
process is designed without considering the size of
package, the safety and the quality of the products may
not be uniformly controlled due to either
over-sterilization or under-sterilization[7,8,10]. Several
studies have addressed that the unintended changes in
color and flavor of vegetables, such as carrots, white
beans, green beans, mushrooms and pumpkins, were
associated with over- or under-sterilization due to its
package size[9,11-13]. Hong et al.[10] reported that the
degree of sterilization and the quality of products were
significantly affected by its size and shape. When a
high-temperature sterilization system is applied to
produce radish broth, the degree of browning must be
considered. Especially, as the size of the package and
the sterilization time increase, the degree of browning is
dramatically increased, and it may cause lowering the
consumer acceptability.
Direct steam injection (DSI) is a continuous
sterilization process in which high temperature steam
(100°C-160°C) is directly injected into the fluid passing
through a pipe. In the DSI system, the latent heat of
steam is directly delivered to the fluid in a very short time.
DSI could be an innovative food processing technology to
replace retort sterilization while overcoming its
drawbacks. Due to the characteristics of DSI, high
production rate is achieved. The temperature increase is
faster due to the direct inflow of latent heat. The most
prominent advantage of using DSI is maintaining the
quality of products since the target temperature is attained
so quickly[14-18]. When suitable operating conditions are
provided, DSI can consistently sterilize liquids with the
same quality regardless of the size of the packages.
Thermal processing should be determined based on
the kinetic characteristics of the microbial inactivation
and the quality changes of products, which are functions
of the thermal processing temperature and time[19-21].
When the temperature sensitivity of quality degradation
during thermal processing is lower than the rate of
thermal inactivation of microorganisms, the quality
changes can be minimized. Thus, a fast heating rate is
usually required to minimize thermal degradation.
Application of DSI for sterilization of food products
could achieve such an optimal sterilization process
because the thermal processing time to reach a target
sterilization temperature is extremely short and also there
is no temperature gradient in the products. A
temperature gradient is inevitably associated with a batch
type of thermal processing (i.e., a retort process) or in an
indirect heating (i.e., a heat exchanger). Also, the DSI
process has a big advantage when sterilizing a fluid
containing particles with high viscosity. When the retort
process is conducted with a fluid with high viscosity, the
heat transfer rate becomes slower due to a low convection
heat transfer and eventually, an extended processing time
is required. This extended thermal processing time
usually causes a degradation of quality and nutrition in
the product. In contrast, because of the high shear rate
of steam flow in the DSI process, the multiphase of flow
with steam and high viscosity flow is well mixed. Thus,
even for a highly viscous fluid, the temperature
increasing is fast.
The purposes of this study are: 1) to estimate the
processing time achieving target F0-value for different
pouch volumes, 2) to determine the flow rate and
processing time for different processing temperature of
DSI, and 3) to compare the effect of the retort and DSI
processes on the degree of browning and sensory score of
radish broth after sterilization to establish an optimum
processing system for radish broth.
2 Materials and Methods
2.1 Materials
local market in Chuncheon, South Korea. Since radish
broth is traditionally made by boiling radish juice, radish
juice was used to make radish broth for this study. The
radish was stored at 4°C and at 55% relative humidity
and tested in 2 weeks after purchasing. The radish juice
was prepared by the following procedures: the radish
sample was cut to a uniform size (5 mm × 5 mm × 50 mm)
after elimination of peels and then smashed by a mixer
(Hanil, HMF-3260S, Seoul, S. Korea) operating for 20 s.
The smashed radish juice was diluted to 10% (w/v) in
distilled water. The 10% (w/v) of radish juice was used
for this study, and the concentration (10%) was
determined based on the solid concentration of
commercial radish broth. Retort and DSI were applied
to the diluted juice to produce the radish broth.
2.2 Retort sterilization
A retort (SR-240, Tomy, Tokyo, Japan) was used to
produce the radish broth. In order to prevent the effect
of the difference in shape, the retort pouch was produced
with a certain dimension, such as width:depth:height
(0.70:1.00:0.07). The pouch volumes were 5000 mL
(320 mm × 460 mm × 34 mm), 2500 mL (256 mm ×
368 mm × 27 mm), 1250 mL (203 mm × 292 mm ×
21.5 mm), 750 mL (122 mm × 175 mm × 13 mm), and
500 mL (79 mm × 114 mm × 8.5 mm). The retort pouch
was composed of polyester (12.5 µm of thickness),
aluminum foil (15 µm) and polypropylene (75 µm).
An adequate sterilization process for a low acid food,
defined as 12 log reduction of proteolytic Clostridium
botulinum type A spores, is usually achieved at 121.1°C
for 2.5-3 min[22-24]. However, in practice, F0-values of
6-7 min are conducted for commercial products[23,24].
The minimal required F0-values for sterilization as a
function of the pH for low acid food products are
reported[22]. F0-value of 3 min showed an insufficient
degree of sterilization for several processed foods[25].
Therefore, in this study the target degree of sterilization
was set for F0-value 6 min. In order to calculate a
suitable thermal process time to attain the target F0-value
of 6 min, the temperature changes at various heights at
the center of the pouch during the retort process were
monitored using a wireless temperature sensor (Ellab,
TrackSense Pro, Norfolk, UK). The location showing
the lowest temperature was set as a cold point and used to
determine the degree of sterilization as F0-value.
Coldest spot was defined by the location showing the
lowest temperature at various heights at the center of the
pouch. The height of the pouch was divided into four
equal parts to make five points. The temperature at the
second, third, and fourth points of the five points was
measured. The locations of measurement were
measured at points corresponding to 0.25, 0.5 and 0.75 of
the pouch height as shown in Figure 1. The location
was scaled for various size of pouch based on the
simplified rectangular geometry. The depth, width and
height of the pouch were denominated with a, b and c,
respectively. The locations used to measure the
temperature were coordinated as follows: 1) bottom: 0.5a,
0.5b and 0.25c, 2) center: 0.5a, 0.5 and, 0.5c, and 3) top:
0.5a, 0.5b and 0.75c. The heights measured the
temperature of each pouch were as follows: 1) 8.5 mm,
17 mm and 25.5 mm in 5000 mL, 2) 6.75 mm, 13.5 mm
and 20.25 mm in 2500 mL, 3) 5.38 mm, 10.75 mm and
16.13 mm in 1250 mL, 4) 3.25 mm, 6.5 mm and 9.75 mm
in 750 mL, and 5) 2.13 mm, 4.25 mm and 6.38 mm in
500 mL. The F0-value was calculated by Equation
(1)[18]:
121
0 Δ 10
i
T z
F t
(1)where, t indicates a thermal processing time and Ti
indicates the temperature of fluid at a thermal processing
time step i. The time step of temperature measurement
was 50 s in total processing time of 4500 s. This time
step sufficiently to represent the temperature profile of
the entire processing time. The D-value is the time
required to kill 90% of microorganisms. The z-value is
the number of degrees the temperature has to be increased
to achieve a tenfold reduction in the D-value. The
z-value ware set as 10°C based on the thermal destruction
characteristics of Cl. botulium[25].
2.3 DSI
Injecting steam into the radish juice was carried out
using a commercial DSI system (SilverLine®,
Hydro-Thermal Corp., Waukesha, WI, USA). The DSI
system has two infusion type heaters to inject the steam
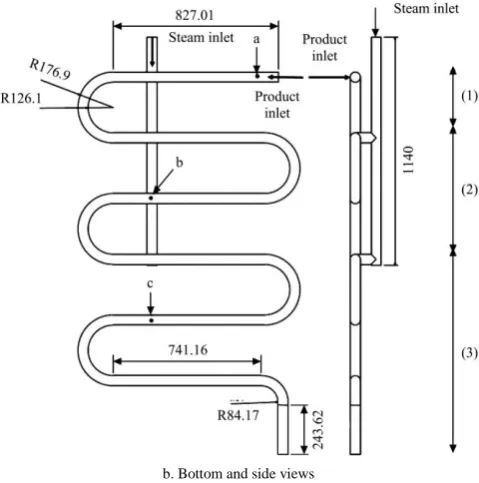
into the fluid. Figure 2a presents a schematic of the
mixing of steam and fluid; the side and the bottom view
of the DSI system with the dimension of the pipe
including the fluid flow are schematically shown in
Figure 2b. The speed of inflow of fluid being sterilized
was maintained consistently using a pump (DS-R40FW,
Daesung Pump Co., Ltd., Seoul, S. Korea). The steam
pressure was maintained as 4.75×10⁵ Pa. In this study,
the target temperature of the fluid for sterilization was
125°C, 130°C and 135°C, and the temperature of the inlet
flow was 35°C. The DSI system can be divided into
three sections: 1) from the fluid inlet to the first steam
injection (1), 2) from the first steam injection to the
second steam injection (2), and 3) from the second steam
injection to product outlet (3) (Figures 2a and 2b). All
the sections were well insulated to maintain the flow
temperature. The inner diameter of the pipe was 0.054 m
and the length of each section was 1.68 m, 2.47 m and
2.51 m, respectively. In each section, the temperature
was measured by a temperature sensor attached in the
middle of each section (b and c in Figure 2b). The
residence time (mm) was calculated based on the volume
flow rate and the length of sections using Equation (2):
Area Length
Residence time 60
Volume flow rate
(2)
where, the area is the cross-sectional area of pipe (m2,
6.45×10⁻⁴ m2) and the length is the total length of three sections (m).
The concentration of the radish broth prepared by the
DSI system must consider the amount of the condensation
water produced by the phase transition of the steam
injected to the radish broth. The quantity of steam was
calculated by an energy balance through Equation (3):
0 0
0
( )
( )
t t
p p target inlet p s s
t
steam target s s s s
V ρ dt T T Cp V ρ dt
T T Cp V ρ dt L
(3)
where, V indicates volume flow rate (m3/s); ρ is density
(kg/m3); Cp is specific heat (kJ/kg·K); L is latent heat
(kJ/kg), and T is temperature (K), Subscripts p and s
indicate product and steam, respectively. Time t is
defined as the residual time from the start of steam
injection to the outlet of DSI. Ttarget,Tsteam and Tinlet
indicate the target temperature, steam temperature and the
temperature of inlet flow, respectively. The temperature
of injected steam was at 150°C and the latent heat (L) was
calculated as 2257.06 kJ/kg, and the specific heat of
water and steam was calculated as 4.19 kJ/kg·K and
1.41 kJ/kg·K, respectively. The density of water and
steam used were 987.99 kg/m3 and 0.5975 kg/m3,
respectively[26]. In this study, specific heat of a product
was assumed to be the specific heat of water due to its
high water content
a. Schematic presentation of direct steam injection system
b. Bottom and side views
Note: The locations of infusion heaters are indicated by the vertical arrows in the red color. The fluid temperature at the inlet, between two steam injection, and after the final steam injection were measured at a, b and c, respectively. The final temperature of the fluid was measured at c.
Figure 2 Diagram of the direct steam injection system
To achieve the target F0-value, the residence time was
assumption that the flow temperature immediately
increases after the steam injection and the temperature
maintains consistently in each section during thermal
processing, the F0-value of the fluid passing through the
DSI system was calculated by Equation (1). The
immediate increase in temperature after the steam
injection was assumed because the viscosity of radish
broth was low and the velocity of the steam injected
through infuser was high. Viscosity for the radish broth
was measured using a viscometer (LVDV-II+, Brookfield
Engineering, Middleborough, MA, USA), calibrated at
20°C with standard fluid. The viscometer measured
fluid viscosity at 50-1000/s of shear rate and at 20°C of
temperature. The viscosity measurements were carried
out using spindle LV1. For viscosity measurements,
1.5 mL of radish broth was loaded on the viscometer.
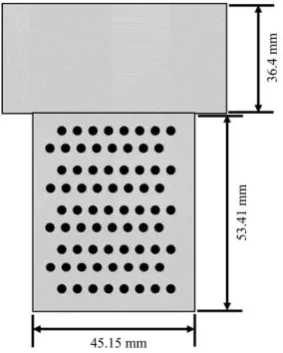
The mass flow rate of steam at the infuser was calculated
based on the mass balance (Equation (3)). The flow of
steam through the infuser passes through the 119 small
holes of the infuser (the diameter of one hole = 1 mm)
(Figure 3). The velocity (m/s) of the steam was
calculated by Equation (4).
mass flow rate velecity
density Area of holes
(4)
To obtain the target F0-value, the volume flow rate of
product (m3/s) in the system was consistently maintained
in each temperature condition (0.00003 m3/s at 125°C,
0.00010 m3/s at 130°C, and 0.00031 m3/s at 135°C).
Figure 3 Schematic diagram of the infuser attached in the direct steam injection system
2.4 Browning index (BI)
The color index before and after sterilization was
measured. After sterilization, 20 g of radish broth was
sampled and immediately cooled to 5°C by placing it in a
cooler. The color index of radish broth was measured
using a colorimeter (CR-300, Minolta, Osaka, Japan). L
(whiteness or brightness/darkness), a (redness/greenness),
and b (yellowness/blueness) were used to obtain the color
index to evaluate the degree of browning. Color index
of the white board used for the calibration was L = 93.6,
a = 0.3135, b = 0.3196. Each sample was measured in
triplicate. The color difference (ΔE) by the size of retort
pouch and sterilization process was calculated by
Equation (5):
2 2 2
0 0 0
ΔE (L L) (a a) (b b) (5)
[100( 0.31)]
0.17
x
BI (6)
The BI was calculated by Equation (6)[27]:
where, L, a and b are each color indices of each treatment;
L0, a0 and b0 indicate the color indices of unsterilized
radish broth. The x in Equation (6) is defined as:
1.75
5.645 3.012
a L
x
L a b
2.5 Sensory evaluation
Fifty members of a trained panel including males and
females aged in their 20 s to their 50 s conducted the
sensory evaluation. The evaluation of radish broth was
done after three days of production and radish broth was
equilibrated to 20°C prior to serving to the panel
members. Color, flavor, odor, texture and overall
preference of radish broth was evaluated on a 7-point
hedonic scale (1=dislike extremely, 4=moderate, 7=like
extremely)[28]. Every sample was stored at room
temperature before the evaluation, and put in a 50 mL cup
marked with a random three-digit number. A spoon was
supplied to each panelist and water was provided to wash
their mouth between evaluations. For each session, the
panelists evaluated three to five samples; the mean value
of the sensory score (color, flavor, odor, texture and
overall preference) was used in the analysis.
2.6 Statistical analysis
Using SPSS 22.0 (SPSS Inc., Chicago, IL, USA), in
order to analyze the difference between the samples,
one-way analysis of variance (ANOVA) was used.
3 Results and Discussion
3.1 Retort sterilization depending on the size of pouch
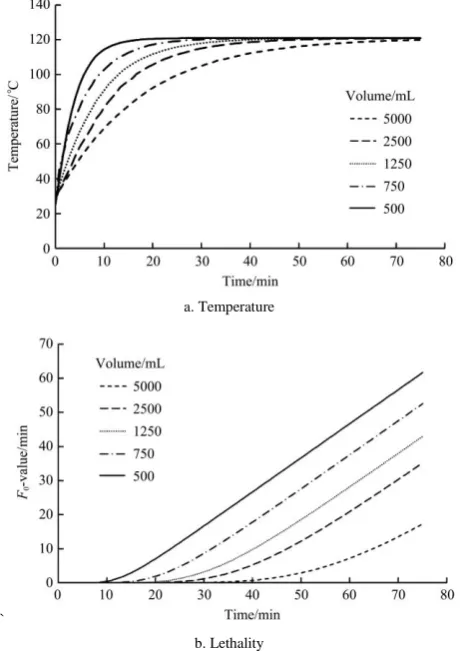
The temperature profiles for the different pouch
volumes are presented in Figure 4a. As the pouch
volume increased, the heat penetration rate decreased.
The time to reach the target temperature of 121°C was
90.0 min, 75.0 min, 60.8 min, 43.3 min and 26.7 min for
the 5000 mL, 2500 mL, 1250 mL, 750 mL and 500 mL
pouch, respectively. This result indicated that the
come-up-time (CUT) to target temperature decreased
with the decreasing of the pouch volume. The result is
similar to the result from Koo et al.[29] in that the rate of
temperature increase was slower as the volume of
curry-containing pouches increased. As the CUT
increased in larger pouches (Figure 4a), the total amount
of heat added to radish broth increased. The CUT
increase indicates that the temperature rise near the cold
point is slow during heat treatment. Therefore,
over-sterilization might occur near the interior wall of the
pouch.
a. Temperature
`
b. Lethality
Figure 4 Profiles of the retort processed white radish broth using different pouch volumes
The F0-value at different sizes of pouches was
calculated (Figure 4b). As the thermal processing time
increased, the target F0-value (6.0 min) was achieved.
But, as the pouch volume increased, the thermal
processing time to reach at the target F0-value was
significantly increased. The thermal process time, i.e.,
the time to reach target F0-value, is displayed in Table 1.
As shown in Figure 4b and Table 1, the target F0-value
was achieved during CUT for all treatments. The
increased thermal process time observed for large volume
pouches might result in degraded broth quality, since the
broth was exposed for a longer time at a temperature
range that could accelerate chemical reactions, such as
the browning reaction. Richard compared the thermal
processing time depending on the can size in a simulation;
sterilization time increased as the can size increased[30].
The size dependence of thermal processing time has been
reported by others[5,7,8]; the collective prior and present
results are the same.
Table 1 Processing time of the retort treatment for the white radish broth with different pouch volumes
Volume/mL Processing time/min 5000 57.28±2.03a 2500 40.39±1.88b 1250 34.84±1.54c
750 26.71±1.22d
500 18.85±1.56e
Note: Mean value of three independent measurements ± SD. Significant differences between treatment are indicated by different letter (ANOVA, p<0.05).
3.2 DSI
To verify the immediate increase of temperature after
the steam injection, the viscosity of the fluid and the
velosity of the steam passing through the infuser were
measured and estimated, respectively. The viscosity of
radish broth was represented in Figure 5. As shown in
Figure 5, the viscosity of the radish broth was very low
and showed a Newtonian fluid. The velocity of the
steam passing through the 1st infuser at 125°C, 130°C, and 135°C were 4.96 m/s, 5.18 m/s and 5.38 m/s, respectivley, and that of the 2nd infuser were 4.07 m/s,
4.36 m/s and 4.73 m/s , respectively. These results
indicated that the viscosity and the velocity of steam
passing through the infusers were sufficient to produce a
turbulent flow near the infuser. This is in agreement
that the steam was always condensed at the equilibrium
temperature and the turbulence created in the
condensation zone mixed the hot condensate. Therefore,
the steam injection promptly heated the product.
Additonally, van Asselt et al.[17] also reported the
immediate increase of temperature after the steam
injection with milk. Therefore, in the present study, the
flow pattern near each infuser might be turbulent, so it
was assumed that the temperature of the fluid was
promptly increased after the steam injection.
Figure 5 Viscosity of the radish broth at 50-1000/s of shear rate
To evaluate the F0-value of DSI, the temperature in
each section was measured and the residence time at each
section was calculated based on the length, diameter and
flow rate of radish broth (Table 2). When the target
temperature was 125°C, the temperature in the first
section where the steam was not injected was 36°C, the
temperature in the second section where the first steam
injection took place was 86.60°C, and the temperature in
the third section where the second steam injection was
conducted was 125.50°C. When the target temperature
was higher (130°C), the temperatures in the second and
the third section were increased by 2.1°C and 4.5°C,
respectively. For the target temperature of 135°C, the
temperatures were increased by 1.9°C and 5°C,
respectively. F0-values in the first and second sections
showed a small value (<0.01), which might not
significantly influence the achievement of the target
F0-value (6). The significant contribution to the degree
of sterilization was performed in the third section after
the second steam injection to the radish broth. The
F0-values from all three DSI operating conditions were
higher than the target value (F0-value = 6 min). The
thermal process time from the DSI were 6.80 min,
2.24 min and 0.72 min at 125°C, 130°C and 135°C,
respectively. It was obvious that the thermal process
time from the DSI was much shorter than those from the
retort process. The DSI showed 0.36-fold, 0.12-fold and
0.04-fold process time compared to the retort process,
since the shortest thermal process time obtained from the
retort process was 18.85 min. This result clearly
demonstrated that the DSI provided a higher degree of
sterilization within a short time. Several prior studies
showed that the application of steam injection to a liquid
food markedly and rapidly increased the temperature of
the fluid. Milk was treated with DSI; a computer
simulation for the transient temperature of fluid revealed
a rapid increase of milk temperature immediately after the
steam injection[17]. Karayannakidis et al.[32] used the
steam injection system to hydrolyze the squid protein and
compared the efficiency with a conventional steam jacket
reactor. DSI system showed a better performance in
terms of energy consumption and the reaction rate of
squid protein hydrolysis compared to those obtained from
a conventional steam jacket reactor.
Table 2 Lethality of the direct steam injection system at each section
Section Temperature/°C Residence time/min F0-value
125°C
1 36.0 1.72 0.01> 2 86.6 2.52 0.01>
3 125.5 2.56 7.20
130°C
1 36.0 0.57 0.01> 2 88.7 0.83 0.01>
3 130.0 0.84 6.70
135°C
1 36.0 0.18 0.01> 2 90.6 0.27 0.01>
3 135.0 0.27 6.84
3.3 Color changes after the retort process
Changes in color of radish broth after the retort
process were evaluated according to the pouch volume.
All the samples were collected immediately after the
target F0-value was reached. The color values
depending on the volume are shown in Table 3. The L
value, representing the whiteness, showed no significant
difference according to the pouch volume. The a value,
representing the color red, showed a tendency to decrease
as the pouch volume decreased. Especially, the a value
at 500 mL was significantly lower than those of 5000 mL
2500 mL showed no significant difference. It implied
that a longer thermal processing time associated with a
larger volume pouch influenced the color changes of
radish broth. This became more obvious when the b
values, representing the color yellow, were compared.
The b value significantly increased as the pouch volume
increased, which demonstrated that a longer thermal
processing time observed from a larger pouch provided
enough reaction time to generate the browning reaction
from the radish broth. Based on the results, the b value
is the most sensitive value for the browning of radish
broth.
Table 3 Lab color value of the white radish broth from different pouch volumes
Volume/mL
Color value
L a b
5000 88.28±1.00a 0.80±0.05a 4.27±0.18a 2500 88.75±0.53a 0.64±0.08b 3.11±0.10b 1250 87.78±0.59a 0.61±0.05b 2.76±0.08c 750 88.27±0.69a 0.56±0.06b 2.32±0.08d 500 88.93±0.19a 0.46±0.04c 1.91±0.11e Note: Mean value of three independent measurements ± SD. Significant differences between treatment are indicated by different letter (ANOVA,
p<0.05).
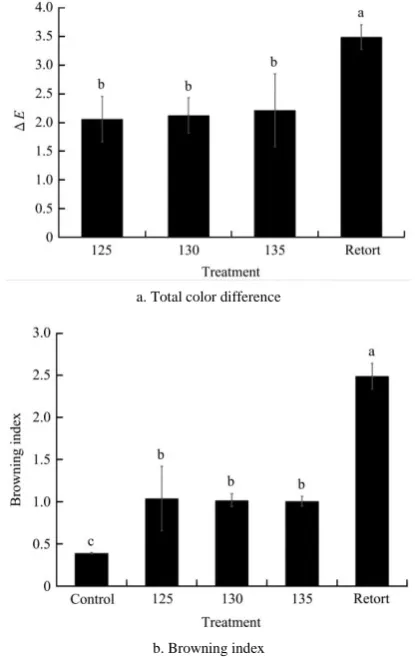
ΔE and BI values depending on the size of the retort pouches are presented in Figures 6a and 6b, respectively.
As the volume of the pouch decreased, ΔE tended to
decrease and was similar with the tendency of L, a and b
values. This was mainly due to the calculation of ΔE,
which required the L, a and b values. The changes of L,
a and b values directly reflected the changes of ΔE. BI
also decreased as the volume of the pouch decreased.
Generally, BI increased as b increased and L decreased.
However, since b contributed to BI more than L or a, BI
significantly decreased as the pouch volume decreased
(Figure 6b). This result showed that the longer thermal
processing time required as the pouch volume increased
significantly changed the quality of the radish broth.
The similar results have been published. Lee et al.[33]
investigated the color changes of radish extract at
different temperatures from 110°C to 150°C at a constant
thermal processing time. The L value decreased and the
a and b values increased as the thermal processing
temperature increased. Since the thermal processing
time was constant, the higher thermal processing
temperature gave more energy to the sample and changed
the color of the radish extract.
a. Total color difference
b. Browning index
Note: Different letters on the bars of the same item indicate a significant difference (p<0.05).
Figure 6 Changes in color value on the white radish broth with different pouch volumes
3.4 Color changes after DSI
The effect of thermal processing temperature of the
DSI process on the color of radish juice was investigated
(Table 4). L value did not show a significant difference
between the control and others, as well as between
thermally treated samples, while the a and b values
showed a temperature dependence for all treatments.
Both the lowest a value and the highest b value were
found at 125°C, which is the lowest temperature applied
in the DSI process.
Table 4 Lab color value of the white radish broth from different direct steam injection sterilization temperatures
Temperature/°C
Color value
L a b
The temperature dependence of ΔE and BI were
calculated (Figures 7a and 7b, respectively). Samples
packed in 500 mL pouches were chosen to compare the
effect of the retort process with the DSI system, because
the thermal processing times of the 500 mL samples were
the shortest among the retorted samples. The ΔE of the
DSI treated samples were significantly lower than that of
the sample treated with the retort process, however there
was no significant difference between the DSI treated
samples. The ΔE difference between DSI treated
samples and the control was directly due to the difference
of L values. BI values of DSI treated samples were
higher than that of the control, but were significantly
lower than retort processed samples. There was no
significant difference of BI values between the DSI
treated samples. The thermal processing time of DSI
was 6.8 min, 2.24 min and 0.72 min at 125°C, 130°C and
135°C, respectively. The thermal processing time of the
retort process was 18.85 min for the 500 mL pouch.
This directly demonstrated that the short thermal
processing time from the DSI process minimized the
quality changes of radish broth. It has been reported
that the browning of white radish was caused by the
activation of polyphenol oxidase (PPO)[2]. However,
Goyeneche et al.[34] reported that >90% of PPO was
thermally inhibited at temperatures exceeding 90°C.
Since all the experiments in this study were conducted
under high temperatures (>90°C), the browning of the
broth might not be due to the activation of PPO. It
could be a non-enzymatic browning (NEB), which
occurred in many food applications. Roux et al.[18]
applied DSI and ohmic heating for a liquid type of baby
food and concluded that the browning at high
temperatures was mainly due to the Maillard reaction.
Another interesting observation was provided by Blake et
al.[35] They investigated the quality changes and the
degree of sterilization of milk using a DSI and a heat
exchanger. The DSI process showed a better sensory
result and the browning of the DSI treated sample was
lower than that of the heat exchanger treated samples.
Zadow[36] reported similar findings. Our study also
showed that the DSI treated sample lowered the browning
of radish broth; this might be due to the short thermal
processing time of the DSI process.
a. Total color difference
b. Browning index
Note: Different letters on the bars of the same item indicate a significant difference (p<0.05).
Figure 7 Changes in color value on the white radish broth with different treatment and temperature
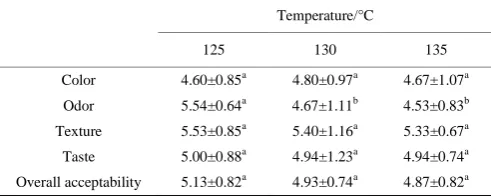
3.5 Sensory evaluations
Sensory evaluations were performed for the DSI
treated samples. Based on the measurement of ΔE and
BI, the retort treated samples were significantly different
from those of DSI treated. However, those three DSI
treated samples were not significantly different. The
main purpose of the sensory test was to determine an
optimum DSI condition among three DSI conditions
applied in this study. The mean values of sensory scores
including color, odor, taste, texture and total preference
are shown in Table 5. The scores for color at different
temperatures ranged between 4.60 and 4.80 with no
significant difference. It was agreed with the results of
color measurements. While the scores of texture, taste
and total preference did not show a significant difference,
the odor score from 125°C treated samples was
significantly higher than that of higher temperatures. A
somewhat burnt smell was noted from the samples treated
at 130°C and 135°C. Yuan and Chang[16] reported the
comparing it with conventional heat treatments. The
DSI generated more preferable flavor components than
that of other heat treatments. However, in this case, as
the temperature applied in DSI increased, DSI might
produce negative flavor components. The results
showed that the optimum heat treatment for the radish
broth from the DSI was 125°C in terms of quality
changes and the degree of sterilization.
Table 5 Average sensory scores of the radish broth from different direct steam injection sterilization temperatures
Temperature/°C
125 130 135
Color 4.60±0.85a 4.80±0.97a 4.67±1.07a Odor 5.54±0.64a 4.67±1.11b 4.53±0.83b Texture 5.53±0.85a 5.40±1.16a 5.33±0.67a Taste 5.00±0.88a 4.94±1.23a 4.94±0.74a Overall acceptability 5.13±0.82a 4.93±0.74a 4.87±0.82a Note: Mean value of three independent measurements ± SD. Significant differences between treatment are indicated by different letter (ANOVA, p<0.05)
4 Conclusions
The degree of sterilization and the color changes of
the white radish broth were evaluated with a retort
process and a DSI process. For the retort process, the
pouch volumes of 500 mL, 750 mL, 1250 mL and 5000
mL were used to investigate the effects of different
dimensions on the thermal processing time and the
associated quality changes. As the retort pouch volume
increased, the time to reach target F0-value increased.
However, the DSI treatment showed 0.36-fold processing
time compared with the smallest pouch volume (500 mL)
among the retort pouches. While the L value did not
show a significant difference, as the volume of the retort
pouch increased, the a and b values significantly
increased. The BI increased as the pouch volume
increased, with a maximum value of 5.49±0.18 in the
5000 mL pouch and a minimum value of 2.49±0.15 in the
500 mL pouch. The BI of DSI treated samples did not
show a significant difference with differing processing
temperatures, but the BI was significantly lower than that
of the retorted product. This confirms that DSI is an
effective method to produce radish broth while
minimizing the browning. The sensory evaluation of
DSI treated samples with different thermal processing
temperatures showed an interesting result that the
samples treated with a lower thermal processing
temperature of DSI showed significantly high scores in
odor, although the color scores showed no differences.
Therefore, the optimum thermal processing temperature
of DSI was determined to be 125°C.
Acknowledgments
This work was supported by Korea Institute of
Planning and Evaluation for Technology in Food,
Agriculture, Forestry and Fisheries (IPET) through High
Value-added Food Technology Development Program,
funded by Ministry of Agriculture, Food and Rural
Affairs (Grant No. 314047-2). This study has been
worked with the support of a research grant of Kangwon
National University in 2016.
[References]
[1] Byun G I, Kim D J, Choi S K. Purchase accommodation attitude of commercial stock merchandise-focused on cuisiniers of deluxe hotels. Culi Sci & Hos, 2008; 14: 115–127.
[2] Andi N F R, Ohta M, Li Y, Nakatani K, Hayashi N, Fujita S. Purification and characterization of polyphenol oxidase from Japanese radish (Raphanus sativus L.) root. J Jpn Ass Food Pres Scientists, 2007; 35(5): 233–240.
[3] Goyeneche R, Di Scala K, Roura S. Biochemical characterization and thermal inactivation of polyphenol oxidase from radish (Raphanus sativus var. sativus). LWT-Food Sci Technol, 2013; 54(1): 57–62.
[4] Lee S H, Hwang I G, Lee Y R, Joung E M, Jeong H S, Lee H B. Physicochemical characteristics and antioxidant activity of heated radish (Raphanus sativus L.) extracts. J Korean Soc Food Sci Nutr, 2009; 38(4): 490–495.
[5] Teixeira A A, Tucker G S. On-line retort control in thermal sterilization of canned foods. Food Control, 1997; 8(1): 13–20.
[6] Patras A, Tiwari B K, Brunton N P, Butler F. Modelling the effect of different sterilization treatments on antioxidant activity and color of carrot slices during storage. Food Chem, 2009; 114(2): 484–491.
[7] Lespinard A R, Mascheroni R H. Influence of the geometry aspect of jars on the heat transfer and flow pattern during sterilization of liquid foods. J of Food Process Eng, 2011; 35(5): 751–762.
and Bioprod Process, 2012; 90(4): 799–808.
[9] Singh A, Singh A P, Ramaswamy H S. Effect of processing conditions on quality of green beans subjected to reciprocating agitation thermal processing. Food Res Int, 2015; 78: 424–432.
[10] Hong Y K, Uhm J T, Yoon W B. Using numerical analysis to develop and evaluate the method of high temperature sous-vide to soften carrot texture in different-sized packages. J Food Sci, 2014; 79(4): E546–561.
[11] Yim S K, Sohn K H. Effects of sterilization temperature on the quality of carrot purees. Food Sci Biotechnol, 2014; 13(2): 141–146.
[12] Lespinard A R, Arballo J R, Taus F J. Multi-Objective optimization of the pasteurization process of pumpkin cubes packaged in glass Jars. Int J of Food Eng, 2015; 11(5): 679–689.
[13] García-Parra J, González-Cebrino F, Delgado J, Cava R, Ramírez R. High pressure assisted thermal processing of pumpkin purée: effect on microbial counts, color, bioactive compounds and polyphenoloxidase enzyme. Food Bioprod Process, 2016; 98: 124–132.
[14] Dill C W, Roberts W M, Aurand L W. Poduction of sulfur compounds in skim milk heated by direct steam injection. J Dairy Sci, 1962; 45(11): 1332–1335.
[15] Hui YH. Ch108 heat transfer. Handbook of food science, technology, and engineering (Vol. 149). Florida: CRC Press. 2006; pp. 106–108.
[16] Yuan S H, Chang S K C. Selected odor compounds in cooked soymilk as affected by soybean materials and direct steam injection. J food Sci, 2007; 72(7): S481–486.
[17] van Asselt A J, Sweere A P J, Rollema H S, de Jong P. Extreme high-temperature treatment of milk with respect to plasmin inactivation. Int Dairy J, 2008; 18(5): 531–538. [18] Roux S, Courel M, Birlouez-Aragon I, Municino F, Massa
M, Pain J P. Comparative thermal impact of two UHT technologies, continuous ohmic heating and direct steam injection, on the nutritional properties of liquid infant formula. J Food Eng, 2016; 179: 36–43.
[19] van Loey A, Fransis A, Hendrickx M, Maesmans G, Tobback P. Kinetics of quality changes of green peas and white beans during thermal processing. J Food Eng, 1995; 24(3): 361–377.
[20] Ovissipour M, Rasco B, Tang J, Sablani S S. Kinetics of quality changes in whole blue mussel (Mytilus edulis) during pasteurization. Food Res Int, 2013; 53(1): 141–148. [21] Hou L X, Ling B, Wang S J. Kinetics of color degradation
of chestnut kernel during thermal treatment and storage. Int J Agric Biol Eng, 2015; 8(4): 106–115.
[22] Pflug I J, Odlaug T E. A review of z and F values used to ensure the safety of low-acid canned food. Food Technol-Chicago, 1978; 32: 63–70.
[23] Ramaswamy H S, Marcotte M. Marcotte Food processing — Principles and application. Florida: CRC Press. 2006. [24] Holdsworth S D. Principles of thermal processing:
Sterilization R. Simpson (Ed.), Engineering Aspects of Thermal Food Processing. Florida: CRC Press. 2009. pp. 3–11.
[25] Anderson W A, McClure P J, Baird-Parker A C, Cole M B. The application of a log-logistic model to describe the thermal inactivation of Clostridium botulinum 213B at temperatures below 121.1°C. J Appl Bacteriol, 1996; 80(3): 283–290.
[26] Thulukkanam K. Shell and tube heat transfer design. Heat exchanger design handbook. Florida: CRC Press. 2013; pp. 329–336.
[27] Maskan M. Kinetics of colour change of kiwifruits during hot air and microwave drying. J Food Eng, 2001; 48(2): 169–175.
[28] Lawless H T, Heymann H. Sensory evaluation of food principles and practices. Chap. 6, 2nd ed. New York: Springer. 2010. pp. 125–145.
[29] Koo B Y, Park S J, Byeon Y R, Son S H. Heat penetration characteristics and keeping quality of retort pouched curry. Korean J Food Sci Technol, 1993; 25(1): 63–68.
[30] Richard P, Durance T D, Sandberg G M M, A Computer simulation of thermal sterilization of canned foods with sub-freezing initial temperatures. Can I Food Sci Tech J, 1991; 24(1): 95–98.
[31] Innings F, Hamberg L. Steam condensation dynamics in annular gap and multi-hole steam injectors. Procedia Food Sci, 2011; 1: 1278–1284.
[32] Karayannakidis P D, Apostolidis E, Lee C M. Comparison of direct steam injection and steam-jacketed heating in squid protein hydrolysis for energy consumption and hydrolysis performance. LWT-Food Sci Technol, 2014; 57(1): 134–140.
[33] Lee S H, Hwang I G, Lee Y R, Joung E M, Jeong H S, Lee H B. Physicochemical characteristics and antioxidant activity of heated radish (Raphanus sativus L.) Extracts. J Korean Soc Food Sci Nutr, 2009; 38(4): 490–495.
[34] Goyeneche R, Scala K D, Roura S. Biochemical characterization and thermal inactivation of polyphenol oxidase from radish (Raphanus sativus var. sativus). LWT-Food Sci Technol, 2013; 54(1): 57–62.
[35] Blake M R, Weimer B C, McMahon D J, Savello P A. Sensory and microbial quality of milk processed for extended shelf life by direct steam injection. J Food Protect, 1995; 58(9): 1007–1013.