Improved method for prediction of milled rice moisture content based on
Weibull distribution
Jing Ling
1,2,
Zhaosheng Teng
2*,
Haijun Lin
3(1. School of Physics and Electronic-Electrical Engineering, Ningxia University, Yinchuan 750021, China; 2. College of Electrical and Information Engineering, Hunan University, Changsha 410082, China;
3. College of Polytechnic, Hunan Normal University, Changsha 410081, China)
Abstract: The loss on drying method, which is regarded as the standard method of rice moisture content analysis, provides the most reliable results but is both labor intensive and time consuming. In order to improve the detection efficiency of the loss on drying method, this study investigated the drying characteristics of milled rice and developed an information fusion algorithm with which to predict milled rice moisture content based on the Weibull distribution and Levenberg-Marquardt (LM) algorithm. Application of the Weibull distribution model was investigated regarding its description of the drying kinetics of milled rice during infrared drying. An adaptive mechanism was applied to algorithm design, with the starting point of the estimation algorithm determined by calculating the drying rate at each measuring point, and the end-point distinguished using a two-level threshold algorithm. The calculated results were then compared with the measured data regarding the infrared drying of milled rice. For milled rice samples varying in moisture content from 14.44%-17.67% (dry basis), the relative error between predicted and observed values ranged 0.0037-0.0589, with a reduction in test time of 50.71%-67.87%.
Keywords: milled rice moisture content, Weibull distribution, Levenberg-Marquardt (LM) algorithm, information fusion, loss
on drying method
DOI: 10.25165/j.ijabe.20181103.3429
Citation: Ling J, Teng Z S, Lin H J. Improved method for prediction of milled rice moisture content based on Weibull
distribution. Int J Agric & Biol Eng, 2018; 11(3): 159–165.
1 Introduction
Rice, in the marketplace, is in different forms depending on its level of processing. After the removal of the bran layer and embryo during milling, brown rice becomes whiter in color and is known as white rice (milled rice), which is the favored form for human consumption in most countries[1]. Moisture content is one of the most important factors affecting the quality of milled rice during storage. At time of harvest, rice moisture content is high and must be reduced to nearly 14.5% (w.b.)[2]. The need to measure and control the moisture content of milled rice is now recognized as a necessary requirement in order to maintain a competitive advantage in the food processing industry.
Several methods and systems based on newly developed technology have been proposed and applied to detect the moisture content of grain and cereals. A comparison of some of these methods is presented in Table 1.
The loss on drying method is a reference method of moisture content measurement that is used for calibration between different species. For agricultural products, the loss on drying method has been prescribed for official inspection purposes according to the international standards AOAC 945.15-1990[3] and ISO 712-1998[4]. Indirect methods are based on the determination of specific
Receive date: 2017-04-14 Accepted date: 2018-03-07
Biographies: Jing Ling, PhD candidate, Assistant Professor, research interests: intelligent detection and information fusion, Email: [email protected];
Haijun Lin, PhD, Professor, research interests: intelligent detection and information fusion system, Email: [email protected].
*Corresponding author: Zhaosheng Teng, PhD, Professor, research interests: intelligent detection and intelligent control system. College of Electrical and Information Engineering, Hunan University, Changsha 410082, China. Tel: +86-731- 88821111, Email: [email protected].
properties of materials that depend on the sample’s water content, such as electrical properties and thermal conductivity[5].
Near infrared (NIR) spectroscopy and nuclear magnetic resonance (NMR) spectroscopy are accurate methods used to detect the chemical composition of milled rice, although the high cost and complexity of infrared spectrometric analyzers limits their applicability compared to the loss on drying method[6,7]. All of the above indirect methods, although much faster than standard techniques and easy to apply, are less accurate and must be calibrated by the standard method, typically the Karl Fischer titration method or loss on drying method.
Although the loss on drying method provides the most reliable results, it is usually labor intensive and time consuming, and therefore improving the detection efficiency of the method has become an important research subject.
mathematical model that describes the mass loss of the sample, with data processing employed to estimate moisture content when the sample is losing water but not completely dry. Recent developments in intelligent information fusion have opened up novel possibilities for moisture content detection. For example, Shrivastav and Kumbhar[11] studied the superheated steam drying characteristics of paneer, proposing an optimized ANN model with two hidden layers to predict the moisture content of the sample. Elsewhere, Ling et al.[12] proposed a semi-empirical model for the prediction of pork moisture content based on Fick’s second law, as well as a prediction and fusion algorithm for meat moisture content detection during loss-on-drying using the least squares method.
Recently, many studies covered the mathematical modeling and kinetics of the drying process by several researchers. Each of these empirical and semi-empirical models describe the impact of drying conditions on the drying process to varying degrees, since drying kinetics are greatly affected by drying conditions. Among
the empirical models, the Weibull distribution has been used to describe the behavior of drying kinetics for different drying variables[13]. However, little information is available regarding the use of the Weibull model for the detection of grain and cereal moisture content based on the loss on drying method.
The objectives of this study were: (1) to determine the applicability of the Weibull model in predicting the moisture content of milled rice during infrared drying; (2) to develop and realize a prediction and fusion algorithm for milled rice moisture content detection during drying, using the LM algorithm; and (3) to evaluate the feasibility of the fusion algorithm for milled rice moisture content detection. This study focuses on the actual applicability of the algorithm and modeling to illustrate the drying kinetics of milled rice, with the research results obtained potentially beneficial in finding an effective method suitable for small embedded systems used in the real-time signal processing of predictive moisture analyzers.
Table 1 Comparison of methods used to determine moisture content
Detection method Advantages Disadvantages
Loss on drying method
Electric drying method Accurate, extensive applicability, well established and does not demand sophisticated laboratory
equipment[4] Labor intensive and time consuming
Infrared drying method Microwave drying
Indirect methods
Resistance method Low cost of apparatus, rapid non-destructive determination
Results are easily influenced by quality factors (varieties, moisture content, aging degree, crack rate, grain type environment) and storage conditions (storage time, bulk density); poor repeatability[6]
Capacitance method NIR spectroscopy
Accurate, rapid non-destructive determination
High cost and complexity of apparatus; results are easily influenced by measuring conditions (environmental temperature, humidity, storage time and bulk density)[7]
NMR spectroscopy
2 Materials and methods
2.1 Preparation of milled rice samples
Milled rice was purchased from the Longping Seed Industry Co. Ltd, Changsha, China, with the reference moisture content (MC) of the samples varying from 14.44%-17.67% (dry basis), as determined by the loss on drying method (AOAC, 2000)[4]. The milled rice samples with different MC values were divided into 12 equal portions, placed in sealed polyethylene bags and stored at a temperature of 5°C±1°C to ensure no additional moisture loss prior to the drying tests. A powder was then made out of the 12 samples by grinding in a grinding mill (HONGTAI, HLO-400, China) and screening through 1.5 mm mesh according to the AOAC loss on drying method.
2.2 Instruments and equipment
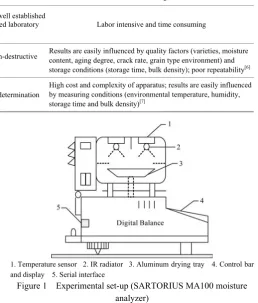
In this study, a moisture analyzer (SARTORIUS, MA100, Germany) was used as the drying apparatus (Figure 1). According to the experimental set-up illustrated in Figure 1, a ceramic infrared radiator of circular shape was fixed on the underside of the top cover of the analyzer, with a sensitive thermometer measuring the temperature of the heated chamber. As the sample is heated, the water molecules evaporate, the weight of the sample decreased. A microcontroller circuit detects this change in weight over time as the sample is dried via infrared heating[14]. The technical specifications of the apparatus are as follows[15]: Max. weighing capacity: 100 g; accuracy of the weighing system: 0.1 mg; repeatability: ±0.1% for initial sample weight approx. >1 g; reproducibility of the temperature: 1%; power consumption: max. 700 VA; voltage frequency: 48-60 Hz; temperature range and settings: 30°C-230°C, adjustable in 1°C increments.
1. Temperature sensor 2. IR radiator 3. Aluminum drying tray 4. Control bar and display 5. Serial interface
Figure 1 Experimental set-up (SARTORIUS MA100 moisture analyzer)
2.3 Experimental procedure
interface, saved in a database and retrieved by the prediction and fusion algorithm. All the above calculation procedures were programmed in Matlab 2013a (The Mathworks, Inc., Natick, MA, USA). All moisture content determinations were replicated three times.
3 Results and discussion
3.1 Mathematical modeling of infrared drying of milled rice
According to ISO 712-1998, the standard temperature (105°C) is used for moisture detection in cereals and cereal products[3]. In this method, the sample is subjected to drying at a temperature of 105°C for various specified times or until complete dryness.
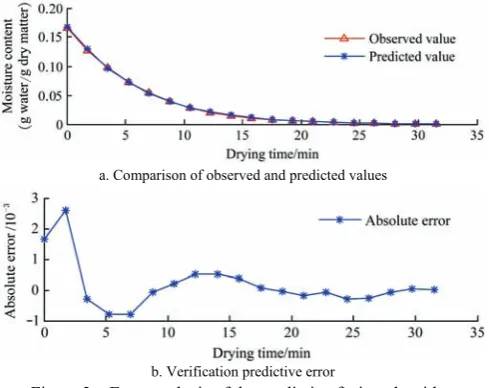
The characteristic drying curve of the infrared drying is shown in Figure 2. This graph clearly shows that the drying rate, which is the slope of the drying curve, decreases with drying progress. During the infrared drying process water loss accelerates during the heating up period AB (i.e., the second derivative of the drying curve is less than 0), with the maximum drying rate related to the heat transfer rate of the sample. Whereas the constant rate period BC
is very short (the second derivative of the drying curve is equal to 0), the falling rate period CD lasts for some time, as the water loss rate of the sample slows progressively (the second derivative of the drying curve is greater than 0)[16]. The purpose of predicting the milled rice moisture content is to fit the sample drying curve for period CD to obtain a result with time t (or a function value that meets the threshold), so as to correctly estimate moisture content when the sample is losing water but not completely dry.
Figure 2 Characteristic drying curve of the infrared drying The Weibull model was originally developed to represent the distribution of the breaking strength of materials and later to describe the behavior of systems or events exhibiting some degree of variability[17]. It has been widely used to analyze the kinetics of biochemistry[18], the behavior of rehydration kinetics[19] processes, and to describe the behavior of drying kinetics, due to its simplicity and flexibility.
The obtained infrared drying curves of milled rice were fitted with the Weibull distribution function model, in which the moisture ratio MR of the milled rice during the infrared drying experiments can be expressed as:
0
= exp β
t e
e
M M t
MR
M M α
⎡ ⎤
− ⎛ ⎞
= ⎢−⎜ ⎟ ⎥
− ⎢⎣ ⎝ ⎠ ⎥⎦
(1)
0
( )exp ( )β
t e e
t
M M M M
α
⎡ ⎤
= − ⎢− ⎥+
⎣ ⎦
(2)
where, Mt is moisture content, g water/g dry matter; Me and M0 are
the equilibrium and initial moisture content, g water/g dry matter;
α is the scale parameter of the Weibull model; β is the shape parameter; and t is the sampling time, min. αdefines the rate and represents the time needed to accomplish approximately 63% of the process[20]. β is related to velocity of the mass transfer at the beginning, e.g., the lower the β value is, the faster the drying rate is at the beginning[21].
After the models were built, twelve sets of randomly selected test data were used to evaluate their performance. In order to illustrate the curve fitting criteria of mathematical models at different moisture content, the non-regression analysis was performed using the curve fitting toolbox of MATLAB 2013a and calculate the αand β, as shown in Table 2. The moisture content of the milled rice is expressed as a percentage of moisture based on wet basis (Mwb) and dry basis (Mdb). The coefficient of determination (R2) was the primary criterion used to selecting the equation best able to describe the drying curve, with reduced chi-square (χ2) and root mean square error (RMSE) values used to determine the best fit.
Table 2 Curve fitting criteria of mathematical models at different moisture content values
No. Mwb/%Mdb/g·g-1 β α R2 χ2 RMSE
1 12.84 0.1473 0.9089 31.51 0.9903 2.750×10⁻⁴ 0.0163
2 13.53 0.1565 0.9234 35.34 0.9997 1.871×10⁻⁴ 0.0102
3 13.90 0.1614 0.9102 38.28 0.9692 3.057×10⁻⁴ 0.0325
4 14.37 0.1678 0.9277 49.45 0.9897 2.077×10⁻⁴ 0.0423
5 14.12 0.1644 0.9125 43.56 0.9697 4.672×10⁻⁴ 0.0752
6 12.62 0.1732 0.9045 37.83 0.9993 4.410×10⁻⁴ 0.0433
7 13.92 0.1619 0.9117 39.14 0.9912 3.251×10⁻⁴ 0.0684
8 14.77 0.1732 0.9146 47.76 0.9689 2.051×10⁻⁴ 0.0411
9 13.94 0.1619 0.9061 37.44 0.9932 5.667×10⁻⁴ 0.0128
10 13.88 0.1611 0.9148 31.99 0.9668 3.789×10⁻⁴ 0.0315
11 14.34 0.1674 0.9171 40.16 0.9996 2.864×10⁻⁴ 0.0093
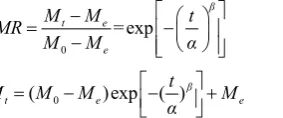
12 15.02 0.1767 0.9359 48.78 0.9998 1.449×10⁻⁴ 0.0328 Model evaluations were necessary in order to estimate the accuracy and robustness of their predictive ability. According to the statistical results shown in Table 2, the R2 of Weibull model (0.9668-0.9998), χ2 (1.449×10⁻⁴-5.667×10⁻⁴), and RMSE (0.0093- 0.0752) could be regarded as reasonably results. The shape parameter βvaried in a narrow range from 0.9045 to 0.9359, and the scale parameter αranged from 31.51 to 48.78 (Table 2). In order to visualize the suitability of the Weibull model in describing the infrared drying of milled rice, we randomly selected a set of samples, the initial moisture content of which was 0.1659 (dry basis).
The curves of observed and predicted moisture content based on the Weibull model are described in Figure 3a and their absolute errors represented in Figure 3b, for 19 sampling points. In Figure 3a, the fitting curve is banded around the drying curve, which demonstrated the suitability of the mathematical model, while in Figure 3b, the absolute error between measured and predicted values is lower than 3.0×10⁻³.
3.2 Estimation of model parameters
The moisture content Mt (d.b.) and the parameter vector
[Me, M0, α, β] at any time t satisfy the nonlinear function shown in Equation (2). The non-linear curve fitting of Mt can be
transformed into solving the nonlinear parameter optimization problem of Equation (2) based on the observations of t and Mt for
a. Comparison of observed and predicted values
b. Verification predictive error
Figure 3 Error analysis of the predictive fusion algorithm The parameter estimation is obtained when the minimization of the difference between calculated and measured moisture content is achieved. The Levenberg-Marquardt (LM) algorithm is a modification of the Gauss-Newton method that, in a self-adaptive manner, navigates between Gauss-Newton and the method of steepest descent[22].
3.2.1 LM algorithm
Assuming functional relation f x k( , ) that maps a parameter
vector k , ( , , ,... )1 2 3
Τ n
k = k k k k , k∈Rn . The measured vectors (xi, yi), i=0, 1, 2…, m-1, and m>n are provided, with the desired result being to find the vector k that best satisfies the functional relation f. The problem is thus to compute those estimates of the parameters which will minimize[23]:
2 2
1 1
( ) m i m{ i ( , )]}i
i i
ψ k d y f x k
= =
=
∑
=∑
−(3)
where, yiis the measured value; f x k( , )i is the calculated value, and m is the number of measurement points. The method then involves correcting the unknown set of parameters using the following formula:
[
]
11 ( )
j j j
k + =k − H+λI − ∇ψ k (4)
where, 2
( )
H = ∇ψ k is the Hessian matrix evaluated at kj ;
( ) ψ k
∇ is the Jacobian matrix ( )j j ψ k k ∂
∂ ; I is the unit matrix, and λ is the damping parameter. Marquardt later replaced the unit matrix in Equation (4) with the diagonal of the Hessian, resulting in the LM update rule. Thus, Equation (4) can be modified as:
[
]
11 diag( ) ( )
j j j
k + =k − H+λ H −∇ψ k (5) The success of this estimation procedure is associated with λin Equation (5), with the update rule used as follows. If the error decreases following an update, the assumption regarding f x k( , )i is implied as working, and λ decreasing (usually by a factor of 10) to reduce the influence of gradient descent. On the other hand, if the error increases, we would like to follow the gradient more closely and then λ is increased by the same factor[24].
The goal of this study is the estimation of the parameters described in Equation (2) via the LM method, the source term presented above is defined mainly by four parameters [M0, Me, α,
β]:
2 2
0 1
{ ( )exp }
β
m m
i i e e
i i i
t
ψ d y M M M
α = = ⎡ ⎡ ⎛ ⎞ ⎤ ⎤ = = −⎢ − ⎢−⎜ ⎟⎝ ⎠ ⎥+ ⎥ ⎢ ⎢⎣ ⎥⎦ ⎥ ⎣ ⎦
∑
∑
(6)The Jacobian matrix is written as:
1 1 1 1
0
2 2 2 2
0
0 ( )
e
e
m m m m
e
ψ ψ ψ ψ
M M α β
ψ ψ ψ ψ
M M α β
ψ k
ψ ψ ψ ψ
M M α β
∂ ∂ ∂ ∂ ⎡ ⎤ ⎢∂ ∂ ∂ ∂ ⎥ ⎢ ⎥ ⎢∂ ∂ ∂ ∂ ⎥ ⎢∂ ∂ ∂ ∂ ⎥ ∇ = ⎢ ⎥ ⎢ ⎥ ⎢ ⎥ ∂ ∂ ∂ ∂ ⎢ ⎥ ⎢∂ ∂ ∂ ∂ ⎥ ⎣ ⎦
M M M M
(7)
where, the elements of the matrix are defined as the first derivative of ψ( )k at position yi with respect to the unknown parameter
0
, ,
=[ , ]
j k M Me a
k ∈ β , and approximated Hessian matrix
( )Τ ( )
H= ∇ψ k ∇ψk .
3.2.2 Initial values of the algorithm parameters
In this study, the special points t→∞ and t→0 were used to calculate the initial values of the parameters. Equation (2) can thus be modified as:
0
( )exp
β
t e e t e
t
M M M M M
α →∞ ⎡ ⎛ ⎞ ⎤ = − ⎢−⎜ ⎟ ⎥+ = ⎝ ⎠ ⎢ ⎥ ⎣ ⎦ (8)
A value of t→∞ signifies the end of the drying process, and
Mt≈Me. From the knowledge of infrared drying kinetics, the
magnitude of the equilibrium moisture content (Me) tends to be
very small[25], so we set M
e=0.01. Conversely, a value of t→0
signifies the starting point of the drying process and Mt=M0. The permitted milled rice moisture content according to the Chinese standard GB 1354-2009[26] can be seen as a priori knowledge of the initial moisture content; thus we set M0=0.15 (dry basis).
0 0
0 0
( )exp
( )
β
t e e t
e e
t
M M M M
α
M M M M
= ⎡ ⎛ ⎞ ⎤ = − ⎢−⎜ ⎟⎝ ⎠ ⎥+ ⎢ ⎥ ⎣ ⎦ = − + = (9)
The values of the scale parameter α and shape parameter β
calculated in Table 2 can be substituted into the predictive fusion algorithm as prior knowledge. According to the experimental experience, we set α=30 and β=0.9 as the initial value in this work.
3.3 Adaptive recognition for the starting point of the predictive algorithm
In the presented approach, the starting point of estimation (the point that separates the heating up and falling rate drying processes) is crucial. This starting point can also be defined as the inflection point, and is calculated using the second derivative of the drying curve. In contrast, the end-point criterion of the method depends on the calculation of the drying rate and the estimated moisture content. Here a two-level threshold criterion method is designed to distinguish the endpoint.
The first derivative of the sample mass denote as v (rate of water loss), and the second derivative of sample mass denote as a
(acceleration of water loss):
1
1
i i i
i i
dm m m
v
dt t t
+ + − = = − (10) 2 2 1 1
2 2 2
Δ ( ) ( )
(Δ) (Δ )
i i i i i
i
d m m m m m m
a
dt t t
− − − − +
= = =
(11)
where, mi and mi-1 are the mass of the sample at i and i-1, g; ti is the
time, respectively. Moisture content is usually expressed in % of moisture present, and there are two methods for expressing these percentages: (i) wet basis (w.b.), and (ii) dry basis (d.b.):
wb 0
100% t e
m m
M
m −
= × , wb
db
wb 100
M M
M =
−
(12)
db 0
t e
t e m m M
m m m
−
=
− +
(13) where, Mwb is the moisture content of dry basis, %; and Mwb is the moisture content of dry basis, g water/g dry matter; mt is the mass
of the sample at t, g; m0and me are the initial and final mass of the
sample, g. From Equations (12) and (13), the moisture content is
expressed as the ratio of the mass of the sample. The numerator and denominator in the Equation (13) are greater than zero. The variation trend of moisture content (Mdb) during drying is similar to that of sample mass loss (mt). The inflection point of the drying
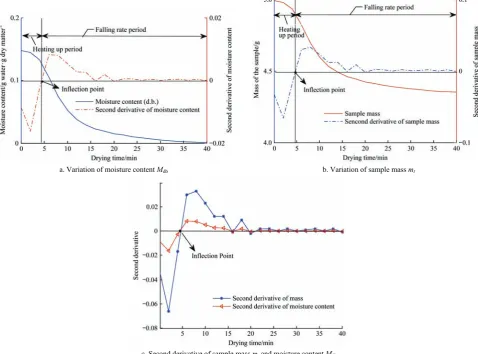
curve is the same as the inflection point of the sample mass loss. To visualize this view, milled rice samples were here randomly selected, with the initial moisture content Mdb=14.76% (dry basis) and initial mass m0=4.991 g. When T=105°C, the infrared drying curve was measured and recorded at a time interval of 6 s. The derivative of the sample mass m0 and moisture content Mdb then calculated in order to illustrate the determination of the inflection point, as shown in Figure 4.
a. Variation of moisture content Mdb b. Variation of sample mass mt
c. Second derivative of sample mass mt and moisture content Mdb Figure 4 Determination of drying curve inflection point
The trend of moisture content is similar with the decrease of sample mass, as shown in Figures 4a and 4b. It can be seen from Figure 4c that the point where the second derivative of two variables equals zero is the same. Therefore, the starting point of the predictive fusion algorithm can be calculated by calculating the second derivative of the sample mass.
According to the drying curves, which are shown in Figures 4a and 4b, a<0 during the heating period and a>0 during the falling
rate period. Thus, the starting point of prediction can be determined by judging whether a is positive or negative:
1
1, 0 and 0;
0, others.
i i
if a a
S= ⎨⎧ < + >
⎩
(14)
where, ai is the acceleration of water loss at i. IfS=1, then i+1 is
the starting point. However, due to experimental noise, the recorded drying curve is not smooth, thus Equation (14) needs to be modified.
If i+1 meets the requirement of S=1 and the subsequent K
points all meet the requirement of a>0, then i+1 is determined as the starting point of prediction. Also considering a=0, Equation (14) can then be modified as:
1 1
1, 0 and 0 and 0, 1,2,..., ;
0, others.
i i i j
if a a a j K
S= ⎨⎧ < + ≥ + + ≥ =
⎩ (15)
where, K can be determined via experimental analysis. The greater the value of K is, the more robust the algorithm-determined starting point is, although more data will be required while a larger
K value will also lead to the delay of the starting point. In contrast, the smaller the value of K is, the greater the sensitivity of the calculation is, although misjudgments may arise.
3.4 Adaptive recognition for the end of the predictive algorithm
intelligent moisture analyzers. As such, systems require faster data-processing speeds and better real-time performance, the computational complexity of data fusion technology means it is not suitable for use in such circumstances. During the drying process, the mass of the milled rice sample was here measured every 6 s and the data uploaded to the computer. The set-up can be assumed as a single sensor and a slowly changing system. Taking the features of this system into consideration, the weighted average method and batch estimate method were then used to process weight data.
The permitted levels of moisture in milled rice according to Chinese standard GB 1354-2009[26] are shown in Table 3. As these data can be regarded as a priori knowledge of the level of milled rice moisture content, we set the first degree threshold value to δ1=0.15 (dry basis). Mˆ∞( )j is the jth predictive value of the
sample. If ( ) 1
ˆ j
M∞ ≥δ, the value of Mˆ∞( )j would be saved in an
array m1[L], where L is the length of the array. Calculated by experiment to select the best results, we set L=20.
Table 3 Permitted level of milled rice moisture
Product name water content (wet basis) water content (dry basis)
long shaped rice ≤14.5 ≤0.1696
round shaped rice ≤15.5 ≤0.1834
long shaped glutinous rice ≤14.5 ≤0.1696 round shaped glutinous rice ≤15.5 ≤0.1834
Based on both theoretical analysis and experimental proof, during the accelerating and decelerating drying periods, the variation in the drying curve is rather different, which leads to relatively large errors in pre- and post-drying predicted moisture content. As a result, the Grubbs criterion is typically used to identify and remove invalid data[27].
The data-weighted average of a predictive value is calculated by:
1 1
ˆ L ˆ j
j j
M ωM
L
∞ ∞
=
=
∑
(16)where, ωj is the weight of the first group corresponding to the
respective predictive value, and L is the length of the array. The standard deviation can be calculated as:
2
1
1 ˆ ˆ
= ( )
1 L
j
j
σ M M
L = ∞ ∞
−
−
∑
(17)
If one of the predictive value ˆ j e
M residual errors (Ei) satisfies the formula:
0
ˆ ˆ
=| j | ( , )
i
E M∞−M∞ ≥g nθ σ (18)
Then ˆj e
M can be considered a bad value and is removed. In Equation (18), the term g0 represents the Grubbs criterion discriminate coefficient, n represents the measurement time, θis the degree of significance and is generally either 0.05 or 0.01, and
σ is the standard deviation[27]. The Grubbs criterion distinguishing method can be used repeatedly until no gross or fault errors are detected. Firstly, set δ1 as the first degree threshold value to determine whether the predicted value is close to the actual value. As the array length L, the second level threshold δ2 is a test parameter. Through a large number of experiments we set
δ2=0.002 as the second degree threshold value to control the accuracy of the prediction and fusion algorithm. The predicted value in the array is then sorted according to ascending order. If the maximum and minimum values meet the criterion:
( ) ( )
max 2 min 2
ˆ ˆ ˆ ˆ
|M M j | δ |M M j | δ
∞ ∞
− ≤ I − ≤
(19)
then Mˆ( )j
∞ is the final predicted value of the algorithm. The
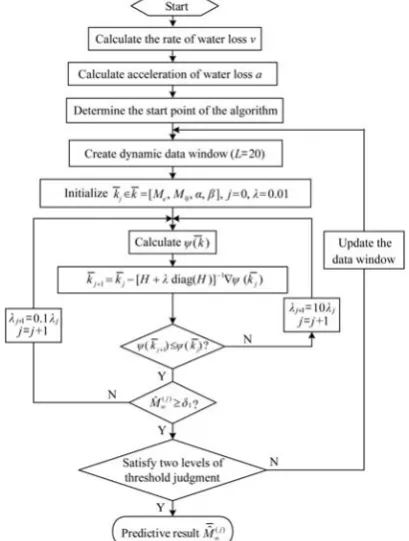
following step-by-step methodology of drying model parameter identification is based on the LM algorithm and adaptive decision-making regarding the starting point and termination criteria. Its flowchart is shown in Figure 5.
Step 1: Calculate the rate of water loss and the first order derivative during the drying process;
Step 2: As illustrated in Equation (12), if i+1 meets the requirement of S=1, and the subsequent six points all meet the requirement, then i+1 is determined as the starting point of predictive algorithm;
Step 3: The sliding window sampling method is applied to the prediction algorithm, using a sliding data window array with length of 20. The predicted value of sample final moisture content (dry basis) Mˆ( )j
∞ can then be calculated based on experimental data;
Step 4: Choose an initial set of parameters k=[M M0, e, , ]α β and an initial value of the damping parameter (here λ0=0.01). The iteration number is then initialized (j = 0);
Step 5: Compute ψ( )k from Equation (3);
Step 6: Compute the Jacobian matrix ∇ψ( )k defined by Equation (7) and the new set of estimates kj+1 from Equation (5), in which the unit matrix is replaced bythediagonaloftheHessian matrix;
Step7): Solve the direct problem using the new estimate kj+1
in order to find f x k( ,i j+1). Then compute ψ(kj+1), as defined
in step 5. If ψ(kj+1)≥ψ( )kj , replace λj with λj+1=10λj
and return to step 5. If ψ(kj+1)≤ψ( )kj , accept the new set of
estimates kj+1 and replace λj with λj+1=0.1λj. Check the two levels threshold criteria and stop the iterative procedure if satisfying.
3.5 Experimental identification of the algorithm
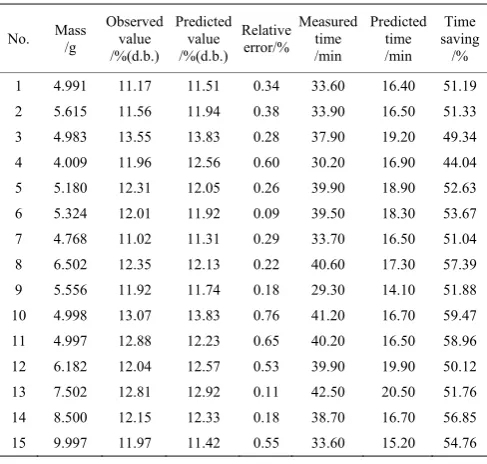
Table 4 compares the algorithm-predicted results with the observed results obtained via the AOAC loss on drying method at 105°C. Analysis of these data reveals good agreement between the measured and predicted moisture content values. For milled rice samples varying in moisture content from 14.44%-1767% (dry basis), the relative error between the predicted and observed values was 0.0037-0.0589, with a reduction in test time of about 50.71%- 67.87%.
Table 4 Comparison of predicted and experimental values of milled rice moisture content
No. Mass /g
Observed value /%(d.b.)
Predicted value /%(d.b.)
Relative error/%
Measured time /min
Predicted time /min
Time saving /% 1 4.991 11.17 11.51 0.34 33.60 16.40 51.19 2 5.615 11.56 11.94 0.38 33.90 16.50 51.33 3 4.983 13.55 13.83 0.28 37.90 19.20 49.34 4 4.009 11.96 12.56 0.60 30.20 16.90 44.04 5 5.180 12.31 12.05 0.26 39.90 18.90 52.63 6 5.324 12.01 11.92 0.09 39.50 18.30 53.67 7 4.768 11.02 11.31 0.29 33.70 16.50 51.04 8 6.502 12.35 12.13 0.22 40.60 17.30 57.39 9 5.556 11.92 11.74 0.18 29.30 14.10 51.88 10 4.998 13.07 13.83 0.76 41.20 16.70 59.47 11 4.997 12.88 12.23 0.65 40.20 16.50 58.96 12 6.182 12.04 12.57 0.53 39.90 19.90 50.12 13 7.502 12.81 12.92 0.11 42.50 20.50 51.76 14 8.500 12.15 12.33 0.18 38.70 16.70 56.85 15 9.997 11.97 11.42 0.55 33.60 15.20 54.76
4 Conclusions
The investigation of this study has shown that the numerical model based on the Weibull distribution is suitable for predicting the moisture content of milled rice. This research also extended and generalized the approach by further developing the information fusion method for the prediction of moisture content using the LM method, with the predictive results then compared with data obtained via AOAC oven drying at 105°C. For milled rice samples varying in moisture content from 14.44%-17.67% (dry basis), the relative error between the predicted and observed values was 0.0037-0.0589, with a reduction in test time of about 50.71%-67.87%. The research results may be beneficial in finding an effective method suitable for small embedded systems used in the real-time signal processing of predictive moisture analyzers.
Acknowledgements
This study supported by a grant from the National Natural Science Foundation of China (No.61663039), Natural Science Foundation of Ningxia Hui Autonomous Region (No. NZ1648) and the Natural Science Funds of Ningxia University (ZR15010).
[References]
[1] Cihan A, Kahveci K, Hacihafizoglu O. Modelling of intermittent drying of thin layer rough rice. Journal of Food Engineering, 2007; 79(1): 293–298.
[2] Lopes D D C, Neto A J S, Santiago J K. Comparison of equilibrium and logarithmic models for grain drying. Biosystems Engineering, 2014; 118(1): 105–114.
[3] AOAC. Moisture in cereal adjuncts: Air oven method (103 to 104°C).
Official Methods of Analysis. 15th ed. Arlington, VA: Association of Official Analytical Chemists,1990.
[4] International Organization for Standardization (ISO) 712. Cereals and cereal products – Determination of moisture content (Routine reference method). Geneva, Switzerland: International Standard ISO, 1998. [5] Nelson S O, Trabelsi S. Historical development of grain moisture
measurement and other food quality sensing through electrical properties. IEEE Instrumentation & Measurement Magazine, 2016; 19(1): 16–23. [6] Nath K D, Das Y M S, Ramasamy S, Ramanathan P. A review on
non-destructive methods for the measurement of moisture contents in food items// International Conference on Circuit, Power and Computing Technologies. IEEE, 2015: 1–6.
[7] Borompichaichartkul C, Moran G, Srzednicki G, Price W S. Nuclear magnetic resonance (NMR) and magnetic resonance imaging (MRI) studies of corn at subzero temperatures. Journal of Food Engineering, 2016; 69(2): 199–205.
[8] Knegt R J D, Brink H V D. Improvement of the drying oven method for the determination of the moisture content of milk powder. International Dairy Journal, 1998; 8(8): 733–738.
[9] Baysal T, Icier F, Ersus S, Yildiz H. Effects of microwave and infrared drying on the quality of carrot and garlic. European Food Research & Technology, 2003; 218(1): 68–73.
[10] Novak J F, Burch M R. Method and apparatus for microwave utilization: US, US6618957, 2003.
[11] Shrivastav S, Kumbhar B K. Modeling and optimization for prediction of moisture content, drying rates and moisture ratio. Int J Agric & Biol Eng, 2009; 2(1): 58–64.
[12] Ling J, Teng Z S, Lin H J, Zhang K X. Estimation and fusion model for meat moisture content measurement based on loss-on-drying. Chinese Journal of Scientific Instrument, 2015; 36(2): 318–326. (in Chinese) [13] Corzo O, Bracho N, Pereira A, Alberto V. Weibull distribution for
modeling air drying of coroba slices. LWT-Food Science and Technology, 2008; 41(10): 2023–2028.
[14] Models MA100/MA50 electronic moisture analyzer operating instructions. Sartorius, Beijing, 2004.
[15] MA50 and MAl00 user’s manual. Sartorius, Beijing, 2004.
[16] Ling J, Teng Z S, Lin H J, Wen H. Infrared drying kinetics and moisture diffusivity modeling of pork. Int J Agric & Biol Eng, 2017; 10(3): 302–311. [17] Corzo O, Bracho N, Rodriacute J. Application of Weibull distribution model in describing the pile salting of goat meat slices. 2013; 8(14): 581–588.
[18] Sant’Anna V, Utpott M, Claderaolivera F, Brandelli A. Kinetic modeling of the thermal inactivation of Bacteriocin-like inhibitory substance P34. Journal of Agricultural & Food Chemistry, 2010; 58(5): 3147–3152. [19] Marabi A, Saguy I S. Viscosity and starch particle size effects on
rehydration of freeze-dried carrots. Journal of the Science of Food & Agriculture, 2005; 85(4): 700–706.
[20] Corzo O, Bracho N, Alvarez C. Weibull model for thin-layer drying of mango slices at different maturity stages. Journal of Food Processing & Preservation, 2010; 34(6): 993–1008.
[21] Cunha L M, Oliveira F A R, Oliveira J C. Optimal experimental design for estimating the kinetic parameters of processes described by the Weibull probability distribution function. Journal of Food Engineering, 1998; 37(2): 175–191.
[22] Rouquette S, Guo J, Masson P L. Estimation of the parameters of a Gaussian heat source by the Levenberg-Marquardt method: Application to the electron beam welding. International Journal of Thermal Sciences, 2007; 46(2): 128–138.
[23] Marquardt D W. An algorithm for least-squares estimation of nonlinear parameters. Journal of the Society for Industrial and Applied Mathematics,1963; 11(2): 431–441.
[24] Le D H, Cong-Kha P, Trang N T Tu B T. Parameter extraction and optimization using Levenberg-Marquardt algorithm. Fourth International Conference on Communications and Electronics (ICCE), IEEE, 2012; 434–437.
[25] Ahmed J, Al-Attar H. Effect of drying method on rheological, thermal, and structural properties of chestnut flour doughs. Food Hydrocolloids, 2015; 51: 76–87.
[26] Chinese National standards. GB11354-2009 Grain. Beijing: Standard Press of China, 2009. (in Chinese)