Infrared drying kinetics and moisture diffusivity modeling of pork
Ling Jing
1,2,
Teng Zhaosheng
1*,
Lin Haijun
3,
Wen He
1 (1. College of Electrical and Information Engineering, Hunan University, Changsha 410082, China; 2. School of Physics and Electronic-Electrical Engineering, Ningxia University, Yinchuan 750021, China;3. College of Polytechnic, Hunan Normal University, Changsha 410081, China)
Abstract: This study investigated the drying kinetics of pork slice in infrared drying condition. Drying temperature, slice
thickness and initial moisture content were selected as influencing factors on the drying characteristics and drying rate of pork slice. Drying curves obtained from the experimental data were fitted to semi theoretical and/or empirical thin layer drying models. The effects of drying temperature and slice thickness on the model constants were evaluated by the multiple regression method. All the models were compared according to three statistical indexes, i. e., root mean square error, chi-square and modeling efficiency. The slice thickness, drying temperature and initial moisture content have significant influences on the effective diffusivity coefficient of pork. The results showed that the drying rate of pork slices increased with the increases of drying temperature and initial moisture content. The decreases of slice thickness also led to an increase of drying rate. The Henderson and Pabis model can best describe the drying curves of pork.
Keywords: infrared drying, pork slice, drying kinetics, effective moisture diffusivity, multiple regression analysis
DOI: 10.3965/j.ijabe.20171003.2518
Citation: Ling J, Teng Z S, Lin H J, Wen H. Infrared drying kinetics and moisture diffusivity modeling of pork. Int J Agric
& Biol Eng, 2017; 10(3): 302–311.
1 Introduction
Pork, which has high content of protein, vitamins and minerals, is one of the most common foods for human[1]. Moisture content is an important factor that influences the quality of porcine meat in terms of color, flavor and tenderness[2]. The moisture content also affects bacterial growth, as it controls the movement of water to the meat surface. The superficial water activity, which strongly affects bacterial growth, is determined by the balance between water evaporation and the internal movement of
Receive date: 2016-04-13 Accepted date: 2017-02-02
Biographies: Ling Jing, PhD candidate, Assistant Professor, major in intelligent detection of agricultural products, Email: [email protected]; Lin Haijun, PhD, Professor, major in
intelligent detection and information fusion system, Email: [email protected]; Wen He, PhD, Assistant Professor,
major in intelligent detection and information fusion system, Email: [email protected].
*Corresponding author:Teng Zhaosheng,PhD, Professor, major
in intelligent detection and information fusion system. College of Electrical and Information Engineering, Hunan University, Changsha 410082, China. Tel: +86-731-88821111, Email: [email protected].
water to the surface[3]. Thus, correct values of the moisture content must be known in order to optimize the process, reduce operating costs and maximize the safety and quality of the meat. A fast, low-cost, and portable measurement technique to determine the moisture content of meat is of great interest to both the meat industry and consumers.
Water loss from foods is a very energy intensive process. Energy and time efficiency is one of the most significant design and operation parameters in moisture determination[7]. Infrared heating offers many advantages over conventional drying under similar conditions. Comparative studies for infrared drying versus other techniques have shown that infrared radiation is faster than convection. With high heat transfer coefficients, the infrared drying process exhibit shorter drying time and less energy consumption[8]. The application of infrared drying technology to moisture detection not only ensures the same accuracy as oven drying but also drastically reduces the drying time.
The investigation of the drying behavior of agricultural products has been carried out by using infrared method and/or by a combined infrared-assisted convection process. However, little work on the infrared drying and drying kinetics of pork has been reported till now. The practical applicability of this work is to establish a theoretical basis for rapid detection of meat moisture content based on loss on drying method. We established a mathematical model for thin layer drying of pork choosing a suitable model and also investigated the effects of drying temperature, sickness of the sample and initial moisture content which can describe the drying characteristics of pork.
The major objectives of this study were: (1) to determine the effects of drying temperature, slice thickness and initial moisture content on the drying rate and drying time of pork slice; (2) to develop a mathematical model for infrared thin layer drying of pork slices; (3) to determine the effects of temperature and initial moisture content on constants and coefficients in the selected models. The research results may benefit for improvement of the efficiency and accuracy of traditional loss on drying method.
2 Materials and methods
2.1 Sample preparation
Fresh pork sirloin with initial moisture content of 2.29-2.55 (g water/g dry matter) on dry basis was obtained from local supermarket and stored in a refrigerator at 0°C. The sample was put in a plastic dish, covered with wrapping plastic and left inside the
environmental chamber for 1 h to get temperature equilibrium before starting the drying process[9]. Prior to the drying experiment, the sirloin was sliced parallel and perpendicular along the fiber direction[10] with sizes of 5 cm
×
5 cm×
0.3 cm, 5 cm×
5 cm×
0.5 cm and 5 cm×
5 cm×
0.7 cm (width×
length×
thickness) using a slicing machine (Savioli, model 250S, Italy), and the mass were weighted by using an electronic balance. The moisture content of the sliced pork was determined according to AOAC procedure[11]. Drying tests were replicated three times at each temperature and averages weight loss are reported.2.2 Experimental set-up
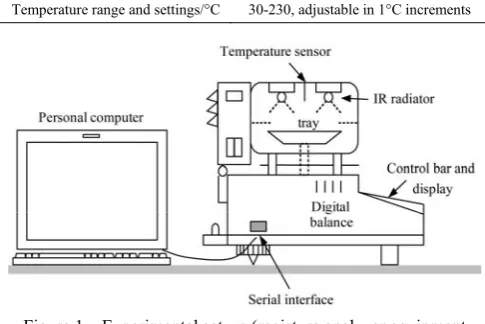
In this study, infrared moisture analyzer equipment (MA100, SARTORIUS, Germany) transmitting electromagnetic radiation in the range medium to shortwave infrared radiation was used as drying equipment. The wavelengths range from 2 μm to 3.5 μm, which is given in equipment catalog[12] (Figure 1). The technical data of infrared moisture analyzer equipment are as follows:
Table 1 Technical data of infrared moisture analyzer equipment
Item Value Max. weighing capacity/g 100
Repeatability, average/% ±0.1 for initial sample weight approx. >1 g Power consumption/VA max. 700
Voltage frequency/Hz 48-60 Accuracy of the weighing system/mg 0.1 Reproducibility of the temperature/% 1
Temperature range and settings/°C 30-230, adjustable in 1°C increments
Figure 1 Experimental set-up (moisture analyzer equipment SARTORIUS, MA100)
temperature of the heated chamber. A microcontroller circuit detects the change of weight of the sample with time as the sample is heated with the infrared heat[13]. As the sample is heated, the water molecules evaporate to decline the weight of the sample. The instrument can automatically detect the end point of analysis when the rate of change of weight falls under a specific value.
2.3 Experimental procedure
The infrared drying conditions for pork samples are given in Table 2. The drying temperature was set on keyboard of the moisture analyzer as 95°C, 105°C, 115°C and 125°C in each experiment. The temperature may converted corresponding radiation intensity values in control unit of equipment[14]. The amount of evaporated water during drying was determined at each 6 s interval in each drying temperature. Drying tests were replicated three times at each temperature and averages weight loss are reported.
Table 2 Drying experiment design
δT/°C δ/mm M0 (dry basis)
Effect of slice thickness 105 3/5/7 2.55 Effect of initial moisture content 105 3 2.55/2.46/2.29 Effect of drying temperature 95-125 3 2.46
The weight of each drying sample used in the experiments varying from 5 g to 10 g. The moisture content (g water/g dry matter) of drying sample at time t
is transformed to moisture ratio (MR) as shown below[15]:
0
− =
−
t e e
M M MR
M M (1)
where, Mt is moisture content at any time during drying, g water/g dry matter; Me, M0 is equilibrium and initial
moisture content, respectively, g water/g dry matter. The drying rate (DR) of pork is:
, , 1
1
d = d
+
+ − =
−
d i d i d
i i
M M
M DR
t t t (2)
where, DR is the drying rate, g water/g dry matter min;
Md is the moisture content on dry basis, g water/g dry matter; t is the drying time, min; Md,i and Md,i+1 are the
moisture content at ti and ti+1, respectively, g water/g dry
matter.
3 Results and discussion
3.1 Experimental drying curves
According to ISO 1442:1997, 105°C is the standard
temperature for meat moisture detection[4]. The
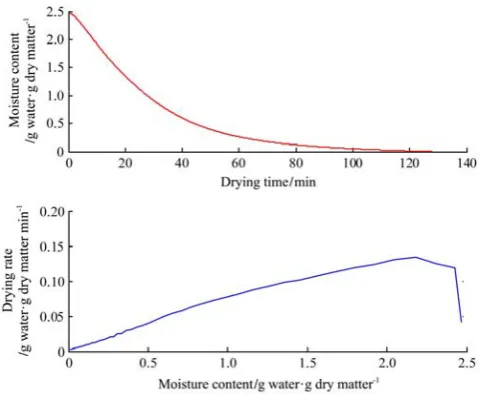
variation of moisture content and drying rate of pork at 105°C during the drying process is shown in Figure 2. Both the external factors and the internal moisture transport mechanism control the drying process. As indicated in this curves, the drying rates were higher in the beginning of the drying process and gradually reduced as the drying process progressed. The moisture content of the pork is relatively high during the initial phase of the drying, which resulted in high absorption of the radiation energy to result in an increase of sample temperature. As the drying progressed, the loss of moisture in the sample decreased the absorption of radiation energy to result in a fall in the drying rate during the latter part of the drying[16].
Figure 2 Characteristic drying curves of pork slices at 105°C
3.2 Effect of drying temperature on drying rate
are illustrated in Figure 3b. The drying rates rose with the increase of drying temperature due to the increased heat transfer potential between the air and the pork slices to improve the evaporation of water in the pork slices. At the same time, free water in pork slice became less
over time. The bound water in pork slices began to evaporate, which needed more energy[17]. Therefore, drying rate reduced significantly at the end of drying process. This result was in agreement with previous literature studies on infrared drying kinetics of strawberry[18].
a. Drying curves of pork slices at different temperatures b. Drying rates of pork slices versus moisture content at different temperatures
c. Drying curves of pork slices at different thicknesses d. Drying rates of pork slices versus moisture content at different thicknesses
e. Drying curves of pork slices at different initial moisture contents f. Drying rates of pork slices versus moisture content at different initial moisture contents
Figure 3 Drying curves of pork slices determined at different drying conditions
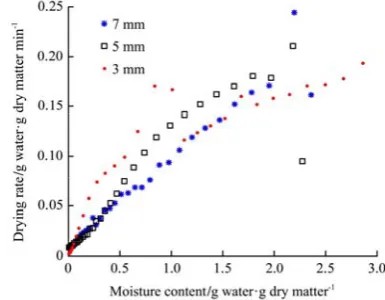
3.3 Effect of slice thickness on drying rate
The drying curves of pork with initial moisture content of 2.50 g/g (d.b.), dried at 105°C and slice thickness of 3 mm, 5 mm and 7 mm is shown in Figure 3c. The drying times of slices were 98 min, 124 min and 136
higher at thin slices, and the total drying time reduced substantially with the decrease in slices thickness. The effect of slice thickness on the drying rate was shown in Figure 3d. Thinly sliced products dried faster due to the reduced distance the moisture travels and increased surface area exposed for a given volume of the product. The similar observation was found by Doymaz for leek drying[19].
3.4 Effect of initial moisture content on drying rate
Figures 3e and 3f illustrate the variation of drying time and drying rate at different initial moisture contents. As mentioned earlier, the moisture content of the sample were 2.55 g/g (d.b.), 2.46g/g (d.b.) and 2.29 g/g (d.b.). A similar variation trend was observed at different initial moisture content, but the drying rate is rather different as shown in Figure 3f. It is clear that drying rate increases with the increase of initial moisture content at the same drying temperature. For example, the maximum drying rate are 0.338 and 0.162 (g water/g dry matter min) in relation to the initial moisture content of 2.55 and 2.29 g/g (d.b.) respectively. The whole process of drying is controlled by the difference between the partial pressure of water vapor on the surface of pork slice and the partial pressure of water vapor in the surrounding air[20]. The results indicated that when the pork slices has a high initial moisture content, there is a larger difference of partial pressure between the sample and surrounding air. This difference is sufficient to initiate a transfer of mass (in the form of water vapor). These results are in agreement with those reported by Khir et al.[21] They studied the drying behavior of rough rice under IR heating. The effects of initial moisture content, rice temperature, drying bed thickness, tempering, and cooling methods on moisture diffusivity and moisture diffusivity coefficient were investigated.
Eight drying models based on theoretical, semi-theoretical and empirical method have been used and compared, shown in Table 3. They were tested to select the best model for describing the drying curve of the pork slices. The non-regression analysis was performed using the STATISTICA computer program and the Levenberg–Marquardt algorithm (MATLAB
2012a). Curve fitting toolbox environment was used to run drying curve fitting to the experiment data.
Table 3 Mathematical models selected to describe the drying
kinetics of pork
No. Model Mathematical equation Reference
1 Lewis MR=exp(–kt) [22]
2 Page MR=exp(–ktn) [23]
3 Modified page MR=exp[–(kt)n] [24]
4 Logarithmic MR=aexp(–kt)+c [25] 5 Two term exponentialMR=aexp(–kt)+(1–a)exp(–kat) [26]
6 Henderson and pabisMR=aexp(–kt) [27] 7 Midilli MR=aexp(–ktn)+bt [28]
8 Modified HendersonMR=aexp(–kt)+bexp(–gt)+
cexp(–ht) [29]
The modeling efficiency (EF) is the primary criterion for selecting the best equation to describe the drying curve. In addition, the reduced chi-square (χ2) and root
mean square error analysis (RMSE) were used to determine the best fit. These parameters can be calculated as follows[30]:
2 2
exp, exp, , exp,
1 1
2
exp, exp,
1
( ) ( )
( )
= =
=
− − −
=
−
∑
∑
∑
N N
i ave pre i i
i i
N
i ave i
MR MR MR MR
EF
MR MR
(3)
2 exp
1
( )
=
−
=
∑
N
i prei i
MR MR RMSE
N (4)
2 exp
2 1
( )
χ =
− =
−
∑
N i preii
MR MR
N p (5)
where, MRexp,i is experimental dimensionless moisture ratio; MRpre,iis predicted dimensionless moisture ratio; N is the number of observations, and p is number of constants. The higher the EF values and the lower the χ2, and RMSE value are, the better the goodness of fit is. Statistical results are summarized in Table 4.
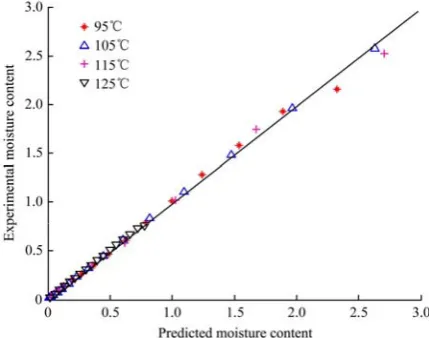
The model with highest EF value and the lowest χ2 and RMSE is considered as the best model. In this sense, Henderson and pabis model (with values of EF between 0.9992 and 0.9998 within the whole temperature range, values of χ2 between 1.0574×10⁻⁵ and 4.6663×10⁻⁵, and
which showed the suitability of the model in describing the infrared drying behavior of pork slices.
Table 4 Curve fitting criteria of mathematical models at
different temperatures
T/°C No. EF χ2 RMSE
Lewis 0.9674 4.6932×10⁻⁴ 0.0283
Page 0.9950 1.3223×10⁻³ 0.0194
Modified page 0.9768 3.9281×10⁻³ 0.0642
Logarithm1ic 0.9987 1.1655×10⁻⁴ 0.0257
Two term exponential 0.9557 5.9411× 10⁻⁴ 0.0681
Henderson and Pabis 0.9997 2.8711×10⁻⁵ 0.0102
Midilli 0.9619 9.4233×10⁻³ 0.0489
95
Modified Henderson 0. 9045 6.4833×10⁻⁴ 0.1887
Lewis 0.9985 8.9771×10⁻⁴ 0.0105
Page 0.9996 4.1722×10⁻⁴ 0.0055
Modified page 0.9986 8.3584×10⁻⁴ 0.0281
Logarithm1ic 0.9994 1.2461×10⁻⁵ 0.0091
Two term exponential 0.9855 6.7252×10⁻⁴ 0.0334
Henderson and Pabis 0.9998 1.1274×10⁻⁵ 0.0031
Midilli 0.9889 1.4116×10⁻³ 0.0256
105
Modified Henderson 0.9892 5.9277×10⁻⁴ 0.0253
Lewis 0.9882 3.3773×10⁻³ 0.0358
Page 0.9865 1.2023×10⁻³ 0.0452
Modified page 0.9996 3.3982×10⁻⁵ 0.0118
Logarithm1ic 0.9992 7.6669×10⁻⁵ 0.0208
Two term exponential 0.9984 1.8778×10⁻⁴ 0.0403
Henderson and Pabis 0.9992 4.6663×10⁻⁵ 0.0028
Midilli 0.9985 1.4323×10⁻⁴ 0.0523
115
Modified Henderson 0.9981 1.8823×10⁻⁴ 0.0699
Lewis 0.9997 1.7720×10⁻⁵ 0.0048
Page 0.9994 1.6152×10⁻⁵ 0.0062
Modified page 0.9998 1.6232×10⁻⁵ 0.0074
Logarithm1ic 0.9997 2.6934×10⁻⁵ 0.0129
Two term exponential 0.9991 1.9816×10⁻⁵ 0.0045
Henderson and Pabis 0.9998 1.0574×10⁻⁵ 0.0033
Midilli 0.9992 2.8234×10⁻⁴ 0.0128
125
Modified Henderson 0.9997 1.3376×10⁻⁵ 0.0139
Note: The best fitting results in the temperature range 95ºC-125ºC is shown in bold.
Figure 4 Comparison of moisture ratios determined by experimentation and prediction
3.5 Regression analysis of model parameters
In this study, multiple linear regression was used to fitting data to explanatory models for model parameter a
and k in function of drying temperature (T) and initial moisture content (M0). The model adequacies were
checking by fitted R2, RMSE and the absolute residuals. MATLAB 2012a was used to fit the response surface model to the experimental data. The similar method was used by Correa to analyze the combined effect of drying air temperature and relative humidity on parameters of the drying model[31]. The observed values of parameters
a and k under different drying conditions are listed in Table 5.
Table 5 Observed values of parameters a and k under
different drying conditions
M0 (g/g d.b.)
T/ºC
2.55 2.29 2.46 95 a=1.1678, k=0.0318 a=1.0707, k=0.0251 a=1.1286, k=0.0277
105 a=1.2687, k=0.0397 a=1.4048, k=0.0326 a=1.3836, k=0.0367 115 a=1.4396, k=0.0404 a=1.4568,k=0.0356 a=1.3507, k=0.0340
The magnitude of the drying temperature is too high compared with the parameters a and k, so the temperature should be normalized before calculation to reduce the fitting errors caused by the mismatched magnitude. We divide the temperature by 100 in order to match the magnitude of parameters a and k.
To estimate the parameters a and k of Henderson and pabis model as a function of the drying temperature associated with initial moisture contents, the following complete statistical model was fitted to the experimental data by multiple regression method.
0
( , , )= − = exp(− ) −
t e e
M M
MR a k t a kt
M M (6)
2
, 0 0 1 2 3 0
2
4 0 5 0
( , )
( )
ψ α α α α
α α
= + + + +
+ +
i j i i j j ij ij
T M T T M
M TM E (7)
where, ψi j, are observed values of the parameters a and
k for Henderson and pabis model at the ith drying temperature and jth initial moisture content (i=1,…3;
j=1,…,3). The parameter α0 is the regression constant,
αi are regression coefficients (i=1, … 5), Ti is the effect of the ith temperature, M0j is the effect of the jth initial moisture content. Eij is the random error.
and least square regression method. The expressions that best fitted these parameters are as follows:
2
0 0
2 0
ˆ 0.9778 0.6705 0.39 0.0487 0.1538 0.2808
− − −
k = T M T TM
+ M + (8)
2
0 0
2 0
ˆ 24.88 1.767 9.153 1.686 0.0279 14.5
= − − −
− −
a T M T TM
M (9)
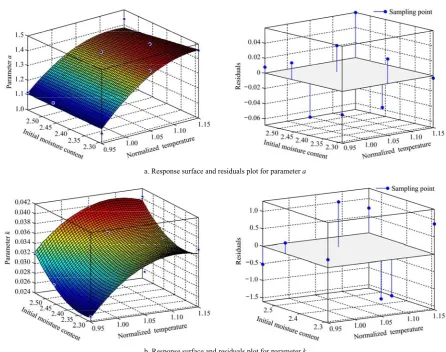
In order to visualize the combined the effects of the two factors (M0 and T) on the parameter a and k, the
response surface and residuals plots were generated as shown in Figures 5a and 5b. This experimental strategy has been used in optimization of a thin layer drying process for coroba slices[32]. In Figure 5a, the response surface of parameter a presents the falling ridge form
within the experimental rank. It can be observed that the parameter a increases with an increase in the drying temperature and a decrease in the initial moisture content. The coefficient of determination are R2=0.9155 and
RMSE=0.0713. In Figure 5b, it has a coefficient of determination R2=0.9756 and RMSE=0.0124, which showing that the model developed is adequate. The experimental values of nine sampling points are compared with the values obtained from the fitted surface, the absolute residuals of constant a is less than 5×10⁻² and
constant k is 1×10⁻³ respectively. These verification results revealed that the predicted values from models were reasonable and accurate.
a. Response surface and residuals plot for parameter a
b. Response surface and residuals plot for parameter k
Figure 5 Response surface and residuals plot for parameter a and k for Henderson and pabis Model
4 Determination of moisture diffusivity
It is well known that drying phenomenon of the biological products during the falling rate period is controlled by the mechanism of liquid and/or vapor diffusion. During the falling rate drying period, moisture diffusion inside the biological products takes
place mainly in form of liquid diffusion or vapor diffusion, and drying characteristics can be described by Fick’s second law:
2
eff 2
⎛ ⎞
∂ = ∂
⎜ ⎟
∂ ⎝ ∂ ⎠
MR MR
D
t r
(10)
In Equation (10), Deff is the effective moisture
moisture ratio, %; r isdiffusion path, m.
Base on the form and characters of samples, assumptions are developed as follows[33]:
(1) The shrinkage in product during drying are negligible, and the assumption of one dimensional heat diffusion is satisfied.
(2) Moisture is initially uniformly distributed throughout the mass of a sample.
(3) External resistances, such as mass transfer resistance are neglected.
(4) Mass transfer is symmetric with respect to the center.
In 1975, Crank[34] developed the analytical solutions of Equation (10) for various regularly shaped bodies such as rectangular, cylindrical and spherical. Pork slices were considered as infinite slab because the thickness of the slice was much less than its width and length. The initial and boundary conditions of Equation (10) are written as follows.
0 0
0 0 0
0 ⎧
⎪⎪ > = ⎨ ⎪ > = ⎪⎩ 0 e
t = , < r < L, M = M dM t , r , =
dt t , r L, M = M
With the appropriate initial and boundary conditions, for a slice sample, a linear relationship between the logarithm of MR and t is obtained, which can be used to determine effective moisture diffusivity according to Equation (10).
(
)
(
)
2 2 ff 2 2 2 0 0 8 1exp 2 1
4 2 +1 π π ∞ = ⎡ ⎤ − = = ⎢− + ⎥ −
∑
⎣ ⎦t e e
n e
M M D t
MR n
M M n L
(11) where, Mt is the moisture content (dry basis) at t moment, g water/g dry matter; Me is the equilibrium moisture content (dry basis), g water/g dry matter; M0 is the initial
moisture content (dry basis), g water/g dry matter; and L
is the half thickness of the slice, m.
The value of Me is relatively small compared with Mt or M0 especially for infrared drying. However, the
moisture ratio (MR) was simplified to
0
t
M
M . For long
drying times (neglecting the higher order term by setting
n=0) and assuming that Me=0, it has been simplified as following[35]:
2 eff 2 2 0 8 exp π π δ ⎡ ⎤ = = ⎢− ⎥ ⎣ ⎦ t
M D t
MR M
(12)
This could be further simplified to the Equation (12) as: 2 ff 2 2 0 8
ln ln π
π δ
= −
t e
M D t
M (13)
Effect of temperature on diffusivity is described using Arrhenius relationship:
eff = 0exp(− )
a
E
D A
RT (14)
where, A0 is the pre-exponential factor of the Arrhenius
equation, m2/s; Ea is the activation energy, kJ/mol; R is the universal gas constant, 8.31 J/(mol·K) and T is the absolute temperature, K.
The diffusion coefficient for each drying temperature was calculated by substituting the experimental data in the Equation (14). In practice, a plot of ln(MR) versus drying time gave a straight line, and the slope of this
straight line is equal to quantity
2 eff 2 π δ D
, the value of Deff
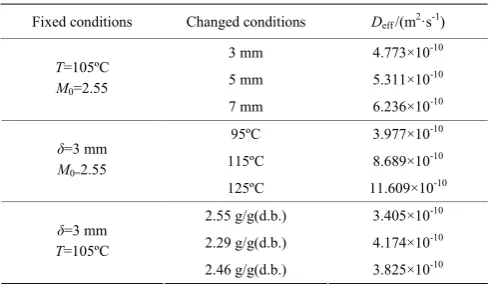
calculated at different drying condition are summarized in Table 6.
Table 6 Deff of pork under different drying conditions
Fixed conditions Changed conditions Deff/(m2·s-1)
3 mm 4.773×10⁻¹⁰
5 mm 5.311×10⁻¹⁰
T=105ºC
M0=2.55
7 mm 6.236×10⁻¹⁰
95ºC 3.977×10⁻¹⁰
115ºC 8.689×10⁻¹⁰
δ=3 mm
M0=2.55
125ºC 11.609×10⁻¹⁰
2.55 g/g(d.b.) 3.405×10⁻¹⁰
2.29 g/g(d.b.) 4.174×10⁻¹⁰
δ=3 mm
T=105ºC
2.46 g/g(d.b.) 3.825×10⁻¹⁰
Based on these results, when the pork temperature was in the range of 95°C-125°C, the ranges of the Deff
value of pork increased with temperature. Moreover, the ranges of the Deff value of pork with a slice thickness
the Deff value of thick slabs to be higher than that of thin
ones. Similar results were also reported in earlier observations[36]. When the pork temperature was in the range of 95ºC-125ºC, Deff was[3.405–11.609]×10-10 m2/s.
It was close to the ranges of the Deff value of pork
reported by other researchers, especially at the high-medium temperature, i.e. 8.9-15.7×10⁻¹⁰ m2/s at
130ºC-150ºC and 6-17×10-10 m2/s at 98ºC[37-38].
5 Conclusions
The mass transfer characteristics and drying rate are significantly influenced by slice thickness, drying temperature and initial moisture content. In order to explain the drying characteristics of pork, eight thin-layer drying models are compared with EF, χ2 and RMSE. The Henderson and pabis model is the best representation of drying data under all experimental conditions. The model parameters k and a are analyzed associated with temperature and the initial moisture content by using multiple regression analysis and partial least square regression method. The effective diffusivity is computed from Fick’s second law, the values of which varied between 3.405×10⁻¹⁰-11.609×10⁻¹⁰ m2/s. It is also
observed that the value of Deff is affected by drying
temperature, initial moisture content and the slice thickness. Increase in drying temperature causes increase of Deff. Moreover, the Deff value of pork with a
slice thickness of 3 mm and 5 mm are lower than those of 7 mm due to the effect of surface hardening of the pork. At the same time, increase in initial moisture content result in a decrease in Deff.
Acknowledgements
This study was supported by a grant from the National Natural Science Foundation of China (No.61663039), Natural Science Foundation of Ningxia Hui Autonomous Region (No. NZ1648) and the Natural Science Funds of Ningxia University (ZR15010).
[References]
[1] Sa-Adchom P, Swasdisevi T, Nathakaranakule A, Soponronnarit S. Mathematical model of pork slice drying using superheated steam. Journal of Food Engineering,
2011; 104(4): 499–507.
[2] Pearce K L, Rosenvold K, Andersen H J, Hopkins D L. Water distribution and mobility in meat during the conversion of muscle to meat and ageing and the impacts on fresh meat quality attributes—A review. Meat Science, 2011; 89(2): 111–124.
[3] Trujillo F J, Wiangkaew C, Pham Q T. Drying modeling and water diffusivity in beef meat. Journal of Food Engineering, 2007; 78(1): 74–85.
[4] ISO 1442:1997. Methods of test for meat and meat products-Part 3: Determenation of moisture content (reference method). International Standard Organized, British, 1997.
[5] Mullen A M, Troy D J. Current and emerging technologies for the prediction of meat quality. Indicators of milk and beef quality, 2005; (112): 179–190.
[6] Andrés S, Murray I, Navajas E A, Fisher A V, Lambe N R, Bünger L. Prediction of sensory characteristics of lamb meat samples by near infrared reflectance spectroscopy. Meat science, 2007; 76(3): 509–516.
[7] Sharma G P, Verma R C, Pathare P B. Thin-layer infrared radiation drying of onion slices. Journal of Food Engineering, 2005; (67): 361–366
[8] Heybeli N, Ertekin C. Effects of different drying techniques on apple drying process: A review. Proceedings of the VI. International CIGR Technical Symposium on Towards a Sustainable Food Chain-Food Process, Bioprocessing and Food Quality Management, 2011: 18–20.
[9] Gou P, Comaposada J, Arnau J. NaCl content and temperature effects on moisture diffusivity in the Gluteus medius muscle of pork ham. Meat Science, 2003; 63(1): 29–34.
[10] Sa-Adchom P, Swasdisevi T, Nathakaranakule A, Soponronnarit S. Drying kinetics using superheated steam and quality attributes of dried pork slices for different thickness, seasoning and fibers distribution. Journal of Food Engineering, 2011; 104(1): 105–113.
[11] AOAC. Official methods of analysis of the association of official’s analytical chemists, Alington, Virginia. 2000. [12] Models MA100/MA50 Electronic moisture analyzer
pperating instructions. Beijing Sartorius, 2004.
[13] Wang J, Zhang Y, Qin T. Application of self-adjusting parameter fuzzy controller in the temperature control system with moisture analyzer. Control and Automation, 2007. ICCA 2007. IEEE International Conference on. IEEE, 2007; 1139–1142.
[14] MA50 and MAl00 User’s manual. Beijing Sartorius, 2004. [15] Luo D L, Liu J, Liu Y H, Ren G Y. Drying characteristics
[16] Ipsita D, Das S K, Satish B. Drying kinetics of high moisture paddy undergoing vibration-assisted infrared (IR) drying. Journal of Food Engineering, 2009; 95(1): 166–171. [17] Karathanos V T. Determination of water content of dried
fruits by drying kinetics. Journal of Food Engineering, 1999; 39(4): 337–344.
[18] Adak N, Heybeli N, Ertekin C. Infrared drying of strawberry. Food Chemistry, 2016; 219: 109–116.
[19] Doymaz İ. Influence of blanching and slice thickness on drying characteristics of leek slices. Chemical Engineering and Processing: Process Intensification, 2008; 47(1): 41–47. [20] Cernaianu C D, Stancut A E. Humidity relationship
determined in the drying cereal seed fluidized bed. Bulletin of the Transilvania University of Braşov, 2009; 2(51): 157–164.
[21] Khir R, Pan Z, Salim A, Hartsough B R, Mohamed S. Moisture diffusivity of rough rice under infrared radiation drying. LWT-Food Science and Technology, 2011; 44(4): 1126–1132.
[22] Lewis W K. The rate of drying of solid materials. Industrial & Engineering Chemistry, 1921; 13(5): 427–432. [23] Page G E. Factors influencing the maximum rates of air
drying shelled corn in thin layers, 1949.
[24] Overhults D G, White G M, Hamilton H E, Ross I J. Drying soybeans with heated air. Transactions of the ASAE, 1973; 16(1): 112–113
[25] Yağcıoğlu A, Değirmencioğlu A, Çağatay F. Drying characteristics of laurel leaves under different drying conditions. 7th Int Congress on Agricultural Mechanization
and Enerdy, 1999: 565–569.
[26] Akpinar E K, Bicer Y, Yildiz C. Thin layer drying of red pepper. Journal of food engineering, 2003; 59(1): 99–104 [27] Westerman P W, White G M, Ross I J. Relative humidity
effect on the high-temperature drying of shelled corn. Transactions of the ASAE, 1973; 16(6): 1136–1139.
[28] Midilli A, Kucuk H, Yapar Z. A new model for single-layer drying. Drying technology, 2002; 20(7): 1503–1513. [29] Karathanos V T. Determination of water content of dried
fruits by drying kinetics. Journal of Food Engineering, 1999; 39(4): 337–344.
[30] Wallisch P, Lusignan M E, Benayoun M D, Baker T I, Dickey A S, Hatsopoulos N G. MATLAB for neuroscientists: an introduction to scientific computing in MATLAB. Academic Press, 2014.
[31] Correa P C, Martins J H, Christ D. Thin layer drying rate and loss of viability modelling for rapeseed (canola). Journal of agricultural engineering research, 1999; 74(1): 33–39.
[32] Corzo O, Bracho N, Vásquez A, Pereira A. Optimization of a thin layer drying process for coroba slices. Journal of Food Engineering, 2008; 85(3): 372–380.
[33] Ertekin C, Yaldiz O. Drying of eggplant and selection of a suitable thin layer drying model. Journal of Food Engineering, 2004; 63(3): 349–359.
[34] Crank J. The Mathematics of Diffusion: 2d Ed. Clarendon Press, 1975.
[35] Gupta P, Ahmed J, Shivhare U S, Raghavan G S V. Drying characteristics of red chilli. Drying technology, 2002; 20(10): 1975–1987.
[36] Doymaz İ. Evaluation of some thin-layer drying models of persimmon slices (Diospyros kaki L.). Energy conversion and management, 2012; 56: 199–205.
[37] Uengkimbuan N, Soponronnarit S, Prachayawarakorn S, Nathkaranakule A. A comparative study of pork drying using superheated steam and hot air. Drying Technology, 2006; 24(12): 1665–1672.