Published online January 08, 2015 (http://www.sciencepublishinggroup.com/j/ajtas) doi: 10.11648/j.ajtas.s.2014030601.15
ISSN: 2326-8999 (Print); ISSN: 2326-9006 (Online)
The use of Advanced Oxidation Processes (AOPs) in dairy
effluent treatment
Carla Cristina Almeida Loures
1, 3, Gisella Rossana Lamas Samanamud
2,
Ana Paula Barbosa Rodrigues de Freitas
1, Ivy S. Oliveira
3, Leandro Valim de Freitas
1, 4,
Carlos Roberto de Oliveira Almeida
31
Production Engineering Department, São Paulo State University (UNESP), Guaratinguetá, Brazil 2
Department of Civil & Environmental Engineering, The University of Texas at San Antonio (UTSA), San Antonio, USA 3
Chemical Engineering Department, São Paulo University (USP), Lorena, Brazil 4
Quality and Optimization Department (PETROBRAS), São José dos Campos, Brazil
Email address:
[email protected] (C. C. A. Loures), [email protected] (G. R. L ,Samanamud), [email protected] (A. P. B. R. Freitas), [email protected] (I. S. Oliveira), [email protected] (L. V. de Freitas), [email protected] (C. R. O. Almeida)
To cite this article:
Carla Cristina Almeida Loures, Gisella Rossana Lamas Samanamud, Ana Paula Barbosa Rodrigues de Freitas, Ivy S. Oliveira, Leandro Valim de Freitas, Carlos Roberto de Oliveira Almeida. The Use of Advanced Oxidation Processes (AOPs) in Dairy Effluent Treatment. American Journal of Theoretical and Applied Statistics. Special Issue: Statistical Engineering. Vol. 3, No. 6-1, 2014, pp. 42-46. doi: 10.11648/j.ajtas.s.2014030601.15
Abstract:
There are several studies in this same sense aiming to develop new processes and new technologies to minimize the volume and toxicity of effluents generated by chemical industries. Currently, technology advances in effluent and residues treatment is based on environmental sustainability (residual reuse) and in the degradation of pollutant substances with easier natural degradation. Technology has improved, Advanced Oxidation Processes (AOPs) for instance, being based on the generation of hydroxyl radicals as oxidant agent, seems to have great efficiency in the treatment of industrial detriments promoting the reduction of coloration in effluents and environmental decontamination. This project represents the efforts in making the effluent treatment of dairy industries using AOPs (Fenton Reagent, UV), produced by YAKULT, unit of Lorena, State of Sao Paulo viable. There have been evaluated, in the bench level, in batch process, different parameters such as time of exposition to UV radiation, pH range, temperature and different Fenton Reagent concentration. Due to these procedures, the reduction of COD was the main control variable in the results provided by the experiments, with 94.17% of organic matter degradation in the effluent.Keywords:
Advanced Oxidation Process, Dairy Effluent Treatment, Homogeneous Photocatalysis1. Introduction
The high volume of water needed in milk processing puts dairy industries as one of the main generators of industrial effluents with high organic content (Goblos et al., 2008). To every liter of milk that is processed. 2.5L of effluent are generated (PupoNogueira, 2007). The annual milk production in Brazil is above 15 billion liters that corresponds to a generation of over 40 billion liters of effluent per year (Camposet. al., 2004). These effluents present high chemical and biochemical demand of oxygen as a consequence of high content of lipids, carbohydrates and proteins that confer a high organic content (CORDI et al., 2008). When disposed onto water bodies they drastically reduce the concentration of
oxygen dissolved in the media putting in risk all aquatic ecosystem. Thus, the environmental control must attend alternatives that could be able to minimize these impacts (BRAGA et al., 2005).
In the past decades, environmental concerns have become more critical and frequent, mainly due to population growth and the increase in industrial activities. Residues produced, in general, of diversified composition frequently have pollutants that are toxic and resistant to conventional treatments (MULBRY et al., 2008; AL-MOMANI et al., 2007), being discharged inadequately causing great impacts on the environment.
water bodies, the contribution of industries in terms of hydric pollution mainly related to organic matter is considerable. The problem aggravates if considered that 90% of current dairy industries are either small or medium size industries without qualification to deal with needed changes to the implementation of clean Technologies and with operational systems of effluent industries (Machado et al., 1999).
The effluent generated by milk processing, for instance, contains a Chemical Oxygen Demand (COD) of about 3,000 mgO2/L. In areas in which there is a big production of cheese
and derivate, COD is in the order of 50,000 mgO2/L
(GAVALA et al., 1999).
Biological treatment plants are preferential in effluent treatment. However, restrictions in optimal pH to an efficient biodegradation, organic content variations as well as physical-chemical characteristics may overload treatment and cause of swelling of sludge (Janczukowicz et al., 2008, KUSIC et al., 2006). In this sense, procedures known as Advanced Oxidation Processes (AOPs) are being studied and applied to mineralize non-biodegradable organic compounds or oxidize biodegradable compounds, that is, convert them completely into CO2, H2O (HOFFMAN et al., 1995). Most of
AOPs involve a significant amount of generation of free hydroxyl radicals •OH, an oxidant agent very effective (POULOPOULOS et al., 2006). Hydroxyl radical, of high energy, start up the oxidation of organic species present in the effluent, mineralizing it, according to Equation 1:
R-CH3 + •OH⇒CO2 +H2O (1)
These studies (ALMEIDA et al., 2004; DOMENECH et al., 2001; GUEDES,2000) are commonly used with ozone (combined or not with H2O2 and/or UV), UV/H2O2 and
Fenton reagent (combined or not with UV).
Dalla Villa et. al. (2007), studied the potential of the application of photo-Fenton/solar process with pre-treatment of dairy industry effluent and verified the efficiency of Fenton and photo-Fenton process in the removal of a wide range of organic content of dairy effluent.
To verify the viability of Photo-Fenton process a design of experiment was developed in which the response factor was given by the COD analysis.
Chemical Oxygen Demand, COD is a parameter related to the amount of oxygen consumed by materials and by organic and mineral substances that are oxidized under defined conditions. In the case of water, the parameter is particularly important to estimate the pollutant potential (in the case of oxygen consumption) of domestic and industrial effluents. Studies like Xu Qiu-jin et al (2006), indicated that high concentrations of COD may cause a substancial damage on submersive plants and according to Wang et al. (2002), COD is an indicator of organic pollutant that may induce lipidic peroxidation and toxicity to submersive plants. In the practical impossibility of quantifying the demand of such oxygen, the same is conventionally substituted by chemical oxidant substances that having its quantity measured prior and after the contact with the studying material, reveal the reductor power or demanding the oxygen of itself (HANSON,
1973; ROCHA et al., 1990). The oxidizing chemical substance to this purpose was dichromate.
This work aimed the effluent treatment generated by Yakult through AOPs mainly through Fenton and Photo-Fenton reaction.
2. Methodologies
2.1. AOP Procedure
AOPs were carried out with a fixed volume of 2.5L and tubular disinfection reactor (with UV lamp). The scheme consisted of basically a peristaltic pump, a glass reservoir and a thermostatic bath for temperature control. To the Fenton reagent the volume of reagents was (H2O2 30% w/v and
FeSO4.7H2O at 0.18 mol.L-1) added to the system using a
burette accordingly: H2O2 was added drop by drop followed
by FeSO4.7H2O.
Step procedures were as follows:
1.2.5L of dairy effluent were measured and conditioned to room temperature and homogenized prior to add it to glass reservoir;
2.Thermostatic bath and recirculation pump were initiated; 3.Temperature was adjusted to 25ºC;
4.pH was adjusted to 3.0;
5.Sample denominated 0 was collected (20 mL), reactor was started up so that UV radiation could begin; 6.Concomitantly, iron solution was added (0.18 mol.L-1)
and H2O2 (30 % m/v);
7.After all parameters were adjusted the reaction time of 1h was considered so that during the reactional time pH was controlled with solutions of NaOH and H2SO4, both
at 5 eq L-1;
8.Final sample was collected and adjusted to pH 8.0 to 9.0 to iron ions precipitation and after the sedimentation step they were filtered in quantitative filter paper. Samples were then submitted to analysis for determination of COD concentration, color and turbidity.
2.2. COD Analysis Procedure
2.2.1 Preparation of solution of each tube to COD analysis0.04g of HgSO4 were weighed and then added to the
tubes containing: 2.5 mL of solution of Ag2SO4/H2SO4
concentrated; 0.5 mL of K2Cr2O7 1.0 Eq.L-1 and 0.3 mL of
distilled H2O.
These tubes were stored until their use in sealed isopor boxes.
Reaction: Organic Matter + Cr2O72- + H+ → Cr3+ + CO2 +
H2O
To the COD analysis the methodology consisted of the reduction of Cr6+ to Cr3+ by reduction agents present in the sample, after digestion (150°C) for two hours in the presence of H2SO4, HgSO4 and Ag2SO4 (catalyst). After the digestion,
Cr3+ formed, with green coloration. The calibration curve is in Appendix A.
Color analysis was determined by spectrophotometer UV-visible (Shimadzu). Absorbance readings were carried out at 400nm and expressed in mgPt-Co/L as in Appendix B.
Turbidity was carried out using turbidimeter model TB1000, with Tungstenium lamp, photovoltaic detector of silicic, range of 0-1000 NTU, 2% accuracy. 20mL of samples were used.
3. Results and Discussion
3.1. Physical-Chemical Characteristics of in Natura Effluent
Preliminary characteristics determined of the effluentare listed in Table 1.
Table 1. Physical-chemical characteristics of input and output of dairy effluent.
Parameters Characteristics
Efluentin natura Treated effluent
Aspect Not clear Clear
Color 464.60 Pt Co 2.30 Pt Co
pH 4.0-5.0 7.0-8.0
Odor Irritant No odor
COD 1,880.15 mgO2.L-1 109.55 mgO2.L-1
Turbidity 399 NTU 0.19 NTU
The analysis of values of parameters in table 1 allows us to conclude that COD reduction was of 94.17% which indicated a good efficiency in the dairy effluent treatment with Photo-Fenton process.
The legislation of the State of São Paulo and the Federal legislation do not state a specific value for COD in the discharge of the effluent in water bodies, however, it recommends a minimum efficiency reduction of treatment processes of at least 80%.
Results in color and turbidity showed to be satisfactory since they presented a reduction of 99% in color and 99.9% in turbidity to the hybrid process.
4. Conclusion
COD reduction was highly significant which suggests that Fenton reagent was efficient and, therefore, AOPs are efficient methodologies that can be used in dairy effluent treatments. After AOPs treatment, this effluent can be discharged in a conventional wastewater treatment facility where there might be the degradation of organic matter that has not been degraded chemically; in general, it concludes that technological solutions must be part of a system of management and environmental control aiming optimize industrial process and promote training and awareness of employers and employees in terms of environmental matters so that efficient and thorough solutions can be adopted. Results obtained in this treatment suggest that it is possible to minimize water contamination of Rio Paraíba do Sul, whether by effluent generated by YAKULT or by other
recalcitrant effluents generated by other companies.
Appendix A
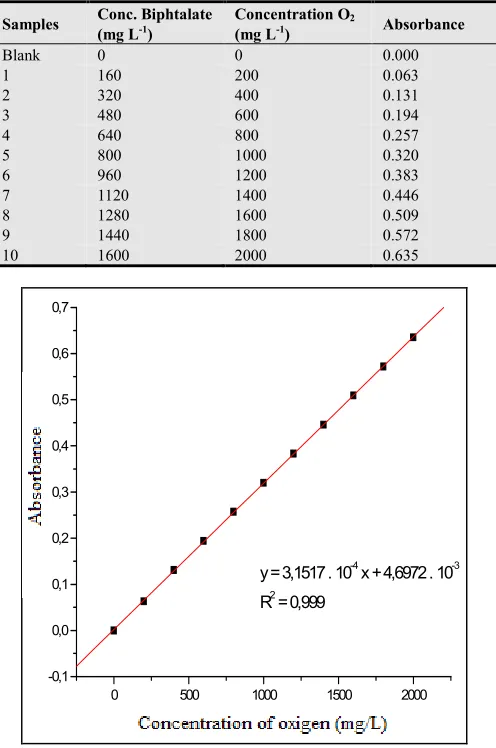
After the spectrophotometric measurement of each digested tube, coordinates were plotted for COD concentration in mg L-1 (axis X) and absorbance values (axis Y), and then a linear regression was carried out among several points, as shown in Figure A1.
Table A1. Preparation of analytic curve to determine high range COD
Samples Conc. Biphtalate (mg L-1)
Concentration O2
(mg L-1) Absorbance
Blank 0 0 0.000
1 160 200 0.063
2 320 400 0.131
3 480 600 0.194
4 640 800 0.257
5 800 1000 0.320
6 960 1200 0.383
7 1120 1400 0.446
8 1280 1600 0.509
9 1440 1800 0.572
10 1600 2000 0.635
0 500 1000 1500 2000
-0,1 0,0 0,1 0,2 0,3 0,4 0,5 0,6 0,7
y = 3,1517 . 10-4 x + 4,6972 . 10-3
R2 = 0,999
鈔
A
b
s
o
rv
c
ia
[O2] ug L-1
Figure A1. Analytic curve to COD spectrophotometric determination
As observed in Figure A1, the linear correlation between the data was significant which characterizes the accuracy of the spectrophotometric measurement.
Appendix B
Procedure and reagents employed to determine color by spectrophotometer (Standard Method)
Reagents: chloroplatinic acid of potassium P.A. (K2PtCl6);
cobalt chloride hexahydrate P.A. (CoCl2·6H2O); solution of
Equipment: UV-visible spectrophotometer UV-Visível (DR 4000 – Hach) and digital pHmeter.
Conditioning of Sample
After conditioning sample to room temperature pH of sample was verified. If it is out of range 4 to 10, preferably adjust to 7. If the color is measured, filtrate the sample in filter membrane with porosity of 0.45 to 0.80 µm. In the filtration step discard the first 5 mL of filtrate to clean the filter. If apparent color is measured then filtering is not needed. In both situations (true color and apparent) sample should not present suspension. If necessary, filter the sample before proceeding the color determination (true or apparent).
Preparation of Standard Pt-Co
Dissolve 1.246 g of K2PtCl6 and 1.00 g of CoCl2·6H2O in
deionized water with 100 mL of concentrated HCl and dilute it to 1,000.0 mL, in volumetric flask and complete it with deionized water (100.0 mL can be prepared enough to the calibration curve). This standard solution will have the concentration of 500 expressed in mg.L-1Pt-Co.
The absorbance of standard solution of Pt-Co equivalent to 500 units of color, measure in glass cube beads of 10 cm must be within limits of data in Table B1 using deionized water as blank.
The result is expressed in mg.L-1Pt-Co to color (filtered sample) in mg.L-1Pt-Co to apparent color (sample without filtration).
To standard solution (500 Pt-Co), calibration curve can be prepared with dilution of 100.0 mL (volumetric flask) with deionized water according to Table B2.
Table B1. Value of absorbances to standard PT-Co for different wavelength.
Wavelength (nm) Absorbance
430 0.110 to 0.120
455 0.130 to 0.145
480 0.105 to 0.120
510 0.055 to 0.065
Table B2. Data to standard curve of determination of true color in Pt-Co
Samples V (mL) [Standard] mg L-1 Absorbance
Blank 0 0 0
1 1.0 50 0.043
2 2.0 100 0.089
3 3.0 150 0.143
4 4.0 200 0.180
5 5.0 250 0.220
6 6.0 300 0.275
7 7.0 350 0.324
8 8.0 400 0.387
9 9.0 450 0.440
10 10.0 500 0.468
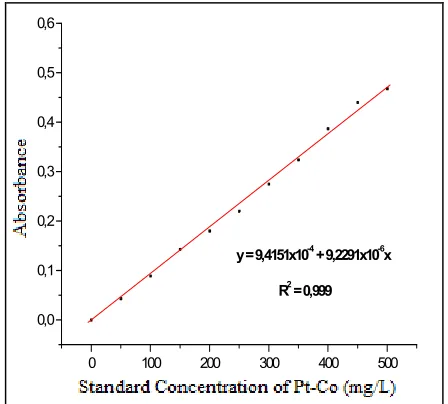
After spectrophotometric measurement of standard points standard concentration coordinates of color expressed in PtCo (axis X) and absorbance values (axis Y), and then linear regression between several points as shown in Figure B1.
0 100 200 300 400 500
0,0 0,1 0,2 0,3 0,4 0,5 0,6
R2 = 0,999 y = 9,4151x10⁻⁴ + 9,2291x10⁻⁶x
A
b
s
o
rb
鈔鈔鈔鈔
c
ia
(
D
Q
O
)
Concentra玢玢玢玢o do Padr鉶鉶鉶鉶 (PtCo)
Figure B1. Analytic curve of spectrophotometric determination of color
References
[1] GOBLOS, S. S.; PORTORO, P., BORDÁS, D., KÁLMAN, M.;KISS, I. RenewableEnergy.2008, 33, 960-965.
[2] PUPO NOGUEIRA, R. F., TROVÓ, A. G., SILVA, M. R. A., VILLA, R. D. Quím. Nova, 2007, 30 (2), 400 - 408.
[3] CAMPOS, C. M. M.;LUIZ, F. A. R.; BOTELHO, C. G.; DAMASCENO L. H. S.; Revista de CiênciasAgrotécnica de Lavras.2004, 28, 1376.
[4] CORDI, S., ASSALIN, M.R., DIEZ, M.C. E DURAN, N. Montagem, partida e operação de um sistema de lodosativados para o tratamento de efluentes: parâmetrosfísico-químicos e biológicos. EngenhariaAmbiental. Espírito Santo do Pinhal, jan/abr 2008, 5(1), 97-115.
[5] BRAGA, B., HESPANHOL, I, CONEJO, J. G. L, MIERZWA, J. C., BARROS, M. T. L, SPENCER, M., PORTO, M., NUCCI, N., JULIANO, N., EIGER, S. Introdução à
EngenhariaAmbiental- O desafio do
desenvolvimentosustentável, 2ª ed. Pearson, Prentice Hall: São Paulo, 2005.
[6] MULBRY, W.; KONDRAD, S.; PIZARRO, C.; KEBEDE-WESTHEAD, E. Bioresource Technology. 2008, 99, 8137 – 8142.
[7] AL-MOMANI, F.; TOURAUD, E.; DEGORCE-DUMAS, J.R.; ROUSSY, J.; THOMAS, O. J. Photochemistry and Photobiology, A: Chemistry. 2007, 153, 191– 197.
[8] MACHADO, R.M.G., SILVA, P. C., CASSEB, M. M. S., PRINCE, A.A., FREIRE, V.H. Sistemas de Tratamentoutilizados para efluenteslíquidos de laticínios. In: XXCONGRESSO BRASILEIRO DE ENGENHARIA SANITÁRIA E AMBIENTAL, 20, 10-14 maio1999. Rio de Janeiro. Anais ... CD-ROM (1011/A81).
[9] GAVALA, H. N. et al. J. Agricultural Engineering Research. 1999, 73, 59-63.
[11] KUSIC, H.; KOPRIVANAC, N.; SRSAN, L. J. Photochemistry and Photobiology A: Chemistry, 2007, 181, 195–202.
[12] HOFFMANN, M.; MARTIN, S.T.; CHOI, W; BAHNEMANN. Chem. Rev. 1995, 95, 69.
[13] POULOPOULOS, S.G.; ARVANITAKIS, F.; PHILIPPOPOULOS, C. J. J. Haz. Mat.2006, 129, 64–68. [14] ALMEIDA, E.; ASSALIN, M. R., ROSA, M. A., DURÁN, N.
Quim. Nova. 2004, 27, 8, 818-824.
[15] DOMÈNECH, X.; JARDIM, W. F.; LITTER, M. I. Procesos avanzados de oxidación para la eliminación de contaminantes. In: Eliminación de Contaminantes por Fotocatálisis Heterogênea. La Plata: Rede CYTED, Cap. 1, 2001.
[16] GUEDES, A. M. F. M. Oxidaçãoquímica com reagente de Fenton: aplicaçõesàságuas de cozimento da cortiça.134 f. Dissertação (MestradoemEngenhariaQuímica) – Faculdade de Engenharia da Universidade do Porto, 2000.
[17] DALLA VILLA, R., SILVA, M.R.A., PUPO NOGUEIRA, R.F. Quim. Nova. 2007, XY (00), 1-x, 200.
[18] XU QIU-JIN' , NIAN YUE-GANG ' , JIN XIANG-CAN',", YAN CHANG-ZHOU', LTU JIN', JIANG GAO-MING. J. Environmental Sciences. 2007, 19, 211-221.
[19] WANG B. ZHOU L P, LI W. J. Wuhan Botanical Research. 2002, 20(2): 150-152.
[20] HANSON, N. W. Part 1. Standardized methods of Analysis. In: Official, standardized and recommended methods of analysis. 2. ed. London: Society for Analytical Chemistry. 1973, 323-327, 383-389.
[21] ROCHA, J. C. BARBIERI, R. S. CARDOSO, A. A., GRANER C. A. F. Quim. Nova. 1990, 13, 200-201.