Published online November 10, 2013 (http://www.sciencepublishinggroup.com/j/ajtas) doi: 10.11648/j.ajtas.20130206.14
Application of multivariate methods for assessment of
variations in rivers/streams water quality in Niger State,
Nigeria
Audu Isah
1, Usman Abdullahi
2, Muhammed Muhammed Ndamitso
31Department of Mathematics/Statistics; School of Natural and Applied Sciences, Federal University of Technology, Minna 2Academic Planning Unit; Federal University of Technology, Minna
3Department of Chemistry; School of Natural and Applied Sciences, Federal University of Technology, Minna
Email address:
[email protected](A. Isah), [email protected](U. Abdullahi), [email protected](M. M. Ndamitso)
To cite this article:
Audu Isah, Usman Abdullahi, Muhammed Muhammed Ndamitso. Application of Multivariate Methods for Assessment of Variations in Rivers/Streams Water Quality in Niger State, Nigeria.American Journal of Theoretical and Applied Statistics.
Vol. 2, No. 6, 2013, pp. 176-183. doi: 10.11648/j.ajtas.20130206.14
Abstract:
Multivariate statistical methods, Cluster Analysis (CA) and Canonical Discriminant Analysis (CDA) were applied to assess the temporal and spatial variations, and identify pollution sources in some rivers/streams of Niger State in Nigeria. Sixteen towns were sampled as medium-sized towns in which data were gathered on four physical, eleven chemical and two microbial parameters of water. Hierarchical CA grouped the sixteen sampled sites into four main seasonal clusters and three main groups of similar water quality. Stepwise selection for the temporal Discriminant Analysis (DA) identified the most significant parameters for discriminating between the four seasons as magnesium, Escherichia coli, total coliform, total dissolved solid (TDS) and total hardness with 83.3% apparent correct classification. The stepwise selection for the spatial Discriminant Analysis (DA) show that, Escherichia coli and magnesium is more prevalent in winter; while Escherichia coli and total dissolved solid (TDS) is higher in spring; and Escherichia coli and total coliform were more in summer and autumn with 94% total success rate of classification. The outcome of this study also show that the sources of water in groups one and two were more polluted than group three during summer and autumn than in the winter and spring. Based on these findings, it is recommended that the frequency of monitoring sites could be reduced to only sites in groups one and two while the seasons could be based on summer and autumn.Keywords:
Canonical Discriminant Analysis, Parameter, Classification, Monitoring Sites1. Introduction
Water is a chemical compound that is vital for the survival of all known forms of life. Water quality refers to the quality of those substances that are present in a particular water sample, making its chemical composition. The ecosystem services of watercourses such as rivers, streams and lakes directly or indirectly contribute to both human welfare and aquatic environment [2]. Rivers also play an important role in the assimilation and transportation of agricultural runoff, domestic and industrial wastewater which represent constant pollution sources that are temporal and commonly affected by climate [11, 14]. Rivers are highly vulnerable to pollution; therefore, it is important to control water pollution, monitor water quality in river basins [10], and interpret the temporal and spatial
variations in water quality [3, 11].
Niger State is underlain by sedimentary and basement complex rocks which have different capacities of retaining water all year round [7, 8]. During the raining season, the whole area is often flooded with water while in dry season some of the rivers do dry up. This gives rise to difficulties in accessing adequate safe quality water supply. With the increase in population, the situation of scrambling for domestic water is aggravated. Most of the medium-sized towns have been encountering similar problem of lacking adequate quality water supply since 1980. [6] is of the view that access to portable water in Niger State has been in continuous decrease since 1980s. On the average, less than 20% of the inhabitants of the study area currently have access to portable water.
tools for extracting meaningful information from data sets. For example, [10, 1] applied cluster analysis (CA) to delineate monitoring sites of surface/drinking water quality while [12, 9] used CA and discriminant analysis (DA) to identify significant parameters and optimize monitoring network of ground water quality data.
The main object of the present study is to assess the extent of resemblance among the monitoring sites and identify key water quality parameters which are responsible for seasonal variations (spatial and temporal) and the possible pollution sources.
2. Materials and Methods
2.1. Study Area
Niger State of Nigeria lies between Latitudes
0
8
20
'N
and 011
30
'N
and Longitudes3
030
'E
and0
7
20
'E
with twenty-five local government area councils.The state is endowed with some large rivers, but with no major water bodies. A sizeable amount of rainwater is lost through percolation to the ground while bulk of it flows as runoff into rivers and streams with some of it lost to the atmosphere by evapo-transpiration [16]. There are two major categories of settlements in the State, urban and rural settlements. The samples were taken from rural settlements. The rural dwellers engage basically in agriculture. Two of the hydro-electric power stations in the state are located within the sampled locations.
Niger State like the rest of Nigeria and other tropical lands has two seasons, the dry and rainy seasons. The dry season is accompanied by a dust laden airmass from the sahara desert, locally known as the harmattan. The rainy
season is influenced by the south west wind or the tropical maritime airmass. This wind involves Nigeria between February and June, depending on the location. For the purpose of this study, four seasons were used to enable us monitor the water quality parameters that are of interest to the study. Each of the seasons is subdivided to two. The rainy season (start and peak) and the dry season (harmattan and hot) which corresponds to spring, summer, autumn and winter respectively [17].
2.2. Data
Sixteen towns with the population between 5,000 and 20,000 people across the state were sampled as medium-sized towns (see Fig. 1). Each sampled town was divided into wards and ten per cent of the total wards were systematically sampled. Water samples were collected from rivers/streams of each of the sampled medium sized towns during winter, spring, summer and autumn seasons respectively. Seventeen (17) water quality parameters were monitored between December 2010 and November 2011 to cover the four seasons of the year. This was based on the guidelines of [13] procedure for analyzing the quality of surface water which involves information on chemical, physical and biological parameters. The chemical parameters examined in this study are: iron, sulphate, chloride, calcium, total hardness (TH), total dissolved solids (TDS), dissolved oxygen (DO), magnesium, sodium, copper and alkalinity; the physical parameters are: pH, temperature, turbidity and electrical conductivity (EC), while the biological parameters are: total coliform and
Escherichia coli.
2.3. Multivariate Analysis
2.3.1. Cluster Analysis (CA)
Cluster analysis is concerned with group identification. The objective of cluster analysis is to partition a set of parameters into a distinct number of unknown groups or clusters in such a manner that all objects within a group are similar, while objects in different groups are not similar. Hierarchical cluster analysis, the most common approach, starts with each object in a separate cluster and joins the clusters together step by step until only one cluster remains [20,21].The Euclidean distance usually gives the similarity between two samples, and a distance can be represented by the difference between transformed values of the samples [22].
Hierarchical cluster analysis was performed on the standardized data using Ward’s minimum-variance method with squared Euclidean distances as a measure of similarity. The Ward's minimum-variance method is given as below:
2
1
1
K L
KL
K L
x
x
D
n
n
−
=
+
(2.1)
where K and L are two different clusters and
n
K andL
n
are the number of points in clusters K and L, respectively. In this study, four clusters were used which is in line with the seasons.Temporal cluster analysis was carried out for the whole data and spatial variations cluster analysis was conducted for the four seasons. A similar approach was applied to the assessment of water quality in [1, 5, 9, 11, 12, 15].
2.3.2. Discriminant Analysis (DA)
Discriminant analysis (DA) is a method of analyzing dependence that is a special case of canonical correlation, and one of its objectives is to determine the significance of different variables, which can allow the separation of two or more naturally occurring groups. DA operates on original data, and the method constructs a discriminant function for each group [15, 19, 20] as follows:
1
( i) i kj ij ij
F G =c +
∑
=W X (2.2) where i is the number of groups (G),c
i is an interceptinherent to each group, k is the number of parameters used to classify a set of data into a given group,
W
i is the weight coefficient, assigned by DA to a given parameter (X
ij).2.3.3. Canonical Discriminant Analysis (CDA)
Canonical discriminant analysis is a combination of principal component and canonical correlation analysis [23]. From principal component analysis, linear combinations of the original variables that account for as much of the total variation as possible are constructed. From canonical
correlation, a linear association between predictor variables and criterion measured are determined [18].
The CA, DA and CDA were performed on R2.14.1 (2011-12-22), a language and environment for statistical computing; using the data from the sixteen monitoring sites.
Temporal cluster analysis was carried out for the whole data and spatial variation cluster analysis was conducted for the four seasons. A similar approach was applied to the assessment of water quality by [1, 5, 10, 12, 15]. The study further carried out the classification of sampled locations (monitoring sites) and the water quality parameters to derive canonical variables. Differences between monitoring sites were also obtained by the F-test (P < 0.05) over the square Mahalanobis distance by using equation (2.1):
2 / 1
(
i j)
(
i j)
D
=
X
−
X
S
−X
−
X
(2.3)where
X
i andX
jare mean vectors for ecotype i and j andS
−1 is the inverse matrix for sample variance and sample covariance common to all sites.The stepwise discriminant analysis was employed to determine the best combination of parameters that would separate between four seasonal variations in the surface water quality parameters. The stepwise procedure selected a subset of quantitative parameters to produce a good discrimination model using stepwise selection. The set of parameters that made up each group was assumed to be a multivariable normal with a common covariance matrix. The best discriminant functions for each estimate were constructed considering the quality of the classification matrix and the number of parameters. The monitoring sites and periods were the grouping variables and the measured parameters were the independent variables.
3. Results and Discussions
Table 1: Descriptive Statistics (Mean ± Standard Deviation) of Water Quality Parameters
S/N Parameter Summer Autumn Winter Spring WHO
1 2 3 4 5 6 7 8 9 10 11 12 13 14 15 16 17 WT pH Electric Cond. Turbidity DO TDS Chloride Sodium Sulphate Magnesium Calcium Iron Copper Alkalinity TH Total Coliform E.coli
27.62± 6.25 5.36± 1.04 142.09±68.15 61.21±13.52 6.51± 1.46 94.17±48.32 37.25±16.62 7.03± 4.13 4.86± 7.22 11.03± 2.11 15.22± 5.60 1.16± 1.25 0.98± 0.33 90.75±30.64 42.06±21.35 93.16±41.57 6.21± 1.96
27.19± 5.87 5.36± 1.04 146.31±64.93 61.21±13.52 5.95± 1.22 96.08±46.74 37.25±16.62 7.03± 4.13 4.86± 7.22 11.03± 2.11 15.22± 5.60 1.16± 0.25 0.98± 0.33 90.75±30.64 42.06±21.35 95.42±42.60 6.97± 2.96
29.20± 9.37 5.79± 1.28 109.22±60.17 46.81±19.10 11.91± 3.67 93.05±36.42 37.25±18.16 6.90± 2.03 5.72± 5.03 4.04± 1.75 11.16± 5.38 3.16± 1.25 1.06± 0.33 48.75±27.64 41.41±21.30 42.16±28.07 89.55±51.09
31.12± 9.80 5.79± 1.28 109.22±60.17 46.81±19.10 11.91± 3.67 93.05±36.42 37.25±18.16 6.90± 2.03 5.72± 5.03 4.04± 1.75 11.16± 5.38 3.16± 1.25 1.06± 0.33 48.75±27.64 42.73±23.01 41.23±27.96 90.03±56.17 - 6.5-8.5 1000 5 7.5 500 250 200 100 50 200 0.3 2.0 - 500 10 0
3.1. Temporal CA
The temporal CA of 16 monitoring sites sorted by seasons generated a dendrogram (see fig.2). Labels at leaves were the 12 months classification into four clusters (seasons). Clusters of each season were indicated by the rectangles and the first rectangle from the left is a cluster which comprised of June, August, September and July representing summer. April and May formed the second cluster representing spring. The third cluster is winter which comprised January, December, February and March while November and December formed the fourth cluster representing autumn. The study shows that the temporal status of the water quality parameters follows the four seasonal variations in a year with exception of March and September which were miss-matched to winter and summer respectively as identified by CA in figure 2, and DA in table 2.
Figure 2: Dendrogram of Temporal Clustering of Seasons
Figure 3.1through figure 3.4 shows the box plots for the descriptive statistics (means) of water quality of the four most influential parameters. The box plot represents the
distribution of the means against the parameter with respect to (summer, spring, winter, and autumn) seasons. Taking Escherichia Coli box plot, it shows that half the summer’s means are between 6ml and 7ml, half the spring’s means are between 7ml and 89ml, half the winter’s means are between 89ml and 90ml; whereas half the autumn’s mean are 90ml. This means that between spring and winter seasons, Escherichia Coli constituent concentration was higher. Magnesium chemical property was low between winter and spring seasons and high between summer and autumn seasons. Total dissolved solids (TDS) was high throughout the year; their chemical properties did not vary significantly. Total Coliform box plot shows that between summer and spring, Total Coliform concentration was higher than between winter and autumn.
The abnormal situation in coliform counts in summer and spring could be attributed to poorly drained, porous soils with seasonally high water tables which is in line with findings in [27].
Figure 3.2. shows seasonal trends in Magnesium
Figure3.3. shows seasonal trends in TDS
Figure3.4. shows seasonal trends in Total Coliform
3.2. Spatial CA
Spatial CA produced a dendrogram with three groups (see figure 4), the height in figure four represents the distance between the monitoring sites. The group classifications varied with significance level because the sites in these groups had similar features and natural backgrounds that were affected by similar sources. Group one consisted of four rivers, group two consisted of seven rivers and group three consisted of five rivers. In group one; the rivers are located in Gurara, Paiko, Sarkin Pawa and Shiroro which were highly polluted sites that received pollution from point and non-point sources (agricultural farms and surface runoff from Shiroro and Gurara dams). Group two consisted of relatively moderately polluted sites most of which were upstream where the major pollution sources were discharged from village streams and livestock farms. The rivers are located in Wawa, Agwara, Magama, Kagara, Mariga, Rijau and Zungeru while Group three rivers are located in Gbajibo, Agaie, Katcha, Lavun and Gbako which were free from major point and non-point pollution sources.
Figure 4: Dendrogram of Spatial Clustering of Monitoring Sites
The height in figure is the distance between the monitoring sites.
Table 2: Classification Result for DA of Temporal Variation
Season Winter Spring Summer Autumn Winter
Spring Summer Autumn
3 1 0 0
0 2 0 0
0 0 3 1
0 0 0 2
Apparent Correct Classification = 83.3%
been successful in cluster grouping or distinction amongst various groups. From the analysis, winter and summer were the most correctly classified seasons (33.33% each) while the spring and autumn were the least (16.67% each).
Table 3: Classification Result for DA of Spatial Variation
Group Group1 Group2 Group3 Group1
Group2 Group3
5 0 0 0 6 1 0 0 4
Apparent Correct Classification = 94%
The group classifications of the monitoring sites are 94% apparently correctly classified as in Table 3. The table shows that group two was wrongly classified with an error rate of about 0.06%.
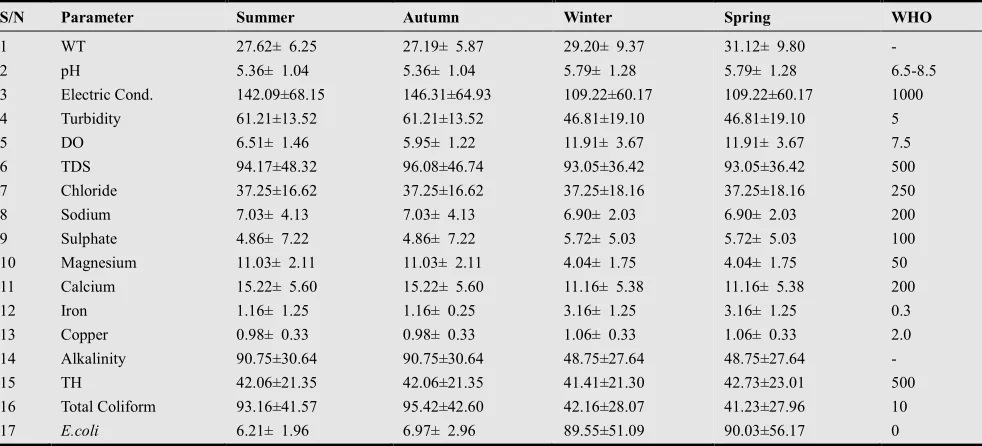
3.3. Stepwise Selection for the Temporal DA
The result of the stepwise discriminant analysis is presented in Table 4. The most important parameters for discriminating between the four seasons for the temporal variation of water quality was the Escherichia coli with chi-square 121.04 closely followed by total hardness, total coliform, magnesium and total dissolved solids with chi-squares as 109.64, 96.74, 79.52 and 65.19 respectively. This result shows the importance of Escherichia coli, total hardness and magnesium in discriminating between dry and wet seasons as earlier reported [4].
Table 4. Summary of Stepwise Selection for the Temporal DA
Step Parameters Wilks’ Lambda
Chi-square Df
p-value 1 2 3 4 5 Magnesium Escherichia coli Total Coliform TDS TH 0.501 0.306 0.512 0.805 0.314 79.519 121.037 96.744 65.188 109.640 3 4 3 2 3 <0.05 <0.05 <0.05 <0.05 <0.05
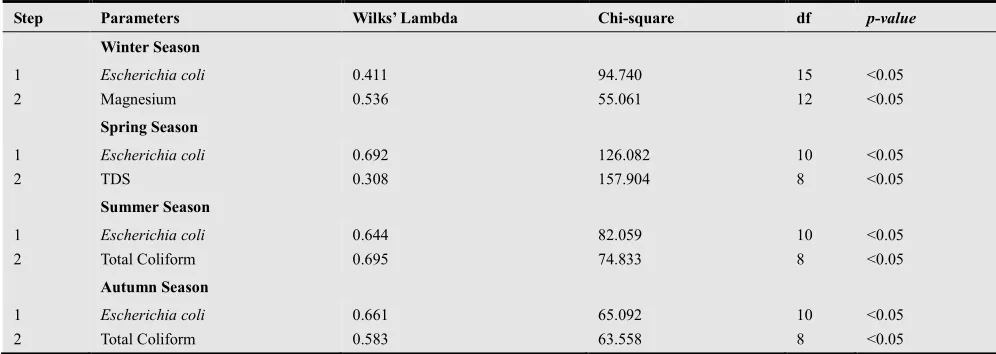
3.4. Stepwise Selection for the Spatial DA
Table 5 shows that Escherichia coli, magnesium, total dissolved solids and total coliform were the contributing parameters for discriminating among the three groups for the spatial variation of water quality parameters. The high bacteria (Escherichia coli, and total coliform) and magnesium levels found in the samples suggested large – scale anthropogenic influence from a combination of land run off and waste water discharges from areas bordering the water sources during the wet season, and since little flushing occurs, this tends to lead to a build-up of the bacteria and this metal giving the fact that in the tropics, studies have shown that faecal coliforms may be part of the environmental microflora [25]. Magnesium levels of the samples were higher in the dry season which showed that the lower values of this parameter suggest that the runoff water only contributed to dilution of the parameter in the rainy season as observed by [26]. The greater water flow into monitoring sites resulted in the higher faecal coliform levels with rainfall having single most important effect on faecal coliform densities in line with the findings of [25].
Table 5. Summary of Stepwise Selection for the Spatial DA
Step Parameters Wilks’ Lambda Chi-square df p-value
Winter Season 1 2 Escherichia coli Magnesium 0.411 0.536 94.740 55.061 15 12 <0.05 <0.05 Spring Season 1 2 Escherichia coli TDS 0.692 0.308 126.082 157.904 10 8 <0.05 <0.05 Summer Season 1 2 Escherichia coli Total Coliform 0.644 0.695 82.059 74.833 10 8 <0.05 <0.05 Autumn Season 1 2 Escherichia coli Total Coliform 0.661 0.583 65.092 63.558 10 8 <0.05 <0.05
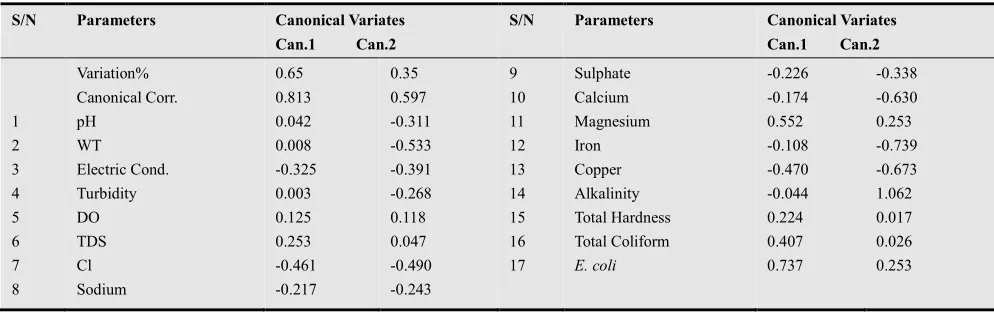
3.5. Variation Explained by Each Canonical (Can).
Table 6 presents the total-sample standardized canonical coefficient, canonical correlation and total variation explained by each canonical variable. The first canonical variable or discriminant function explained 65% of the total variation which can be considered reasonable and the second canonical explained 35% of the total variation, the
two canonical variates extracted explain 100% of the total variation. This shows how each parameter aligned to the two canonical variates. Weighing each parameter according to its contribution on each canonical discriminant function;
while alkalinity loaded high in Can2.
The two canonical variables presented high weighing for
Escherichia coli demonstrating its importance in discriminating. Can1 had higher discriminant power than Can2 because its axis showed higher distinction and disposition of variates between sites than the latter indicating that Escherichia coli, total coliform, total dissolved solids, dissolved oxygen, magnesium, electrical conductivity and total hardness weighing higher in the
former can serve as the most discriminating parameters in distinguishing between the monitoring sites. The significant canonical correlation between the monitoring sites and the first canonical variate (rc = 0.813) and the monitoring sites and the second canonical variate (rc= 0.597), indicated that the variates explained the differentiation of the sites, though Can1 explained most of the variations better than Can2. The relative contribution for each parameter is given in equation (3.1)
0.042
0.082
0.325
. 0.003
0.125
0.253
D
=
pH
+
WT
−
Electrical Cond
+
Turbidity
+
DO
+
TDS
0.0461
Cl
−0.217
Sodium
0.226
Sulphate
0.174
Calcium
0.452
Magnesium
0.108
Iron
−
−
−
−
+
−
(3.1)0.470
Copper
0.044
Alkalinity
0.224
TH
0.407
Total Coliform
0.737
Escherichia C
.
−
−
+
+
+
Table 6. Total–Sample Standardized Canonical Coefficient, Canonical Correlation and Total Variation Explained by each Canonical Variable.
S/N Parameters Canonical Variates Can.1 Can.2
S/N Parameters Canonical Variates Can.1 Can.2
1 2 3 4 5 6 7 8
Variation% Canonical Corr. pH
WT Electric Cond. Turbidity DO TDS Cl Sodium
0.65 0.813 0.042 0.008 -0.325 0.003 0.125 0.253 -0.461 -0.217
0.35 0.597 -0.311 -0.533 -0.391 -0.268 0.118 0.047 -0.490 -0.243
9 10 11 12 13 14 15 16 17
Sulphate Calcium Magnesium Iron Copper Alkalinity Total Hardness Total Coliform
E. coli
-0.226 -0.174 0.552 -0.108 -0.470 -0.044 0.224 0.407 0.737
-0.338 -0.630 0.253 -0.739 -0.673 1.062 0.017 0.026 0.253
3.6. Conclusion
Hierarchical CA provided a classification of rivers/streams into four main seasonal clusters and three main groups of similar water quality parameters that would aid in designing an optimal spatial monitoring plan in Niger State. In group one; rivers are located in Gurara, Paiko, Sarkin Pawa and Shiroro which were highly polluted sites that received pollution from point and non-point sources (agricultural farms and surface runoffs from the Shiroro and Gurara dams). Group two consisted of relatively moderately polluted monitoring sites most of which were upstream where the major pollution sources are discharged from village streams and livestock farms. Group three; rivers are located in Gbajibo, Agaie, Katcha, Lavun and Gbako which are free from major point and non-point pollution sources. The number of monitoring sites could be reduced and only chosen from groups one and two monitoring sites given in spatial hierarchical CA dendrogram. Stepwise selection for the temporal and spatial DA identified the most significant parameters for discriminating between the four seasons with 94% apparent correct classification; Escherichia coli and magnesium;
Escherichia coli and TDS; Escherichia coli and total coliform; Escherichia coli and total coliform were for winter, spring, summer and autumn respectively.
References
[1] Astel, A., Biziuk, M., Przyjazny, A. and Namiesnik, J., Chemometrics in monitoring spatial and temporal variations in drinking water quality. Water Research, 8, 1706–1716, 2006.
[2] Costanza R., dArge R., deGroot R., Farber S., Grasso, M. and Hannon, B., et al., The value of the world’s ecosystem services and natural capital. Nature, 387, 253–260, 1997. [3] Dixon W. and Chiswell B., Review of aquatic monitoring
program design. Water Research, 30, 1935–1948, 1996. [4] Ibrahim S. I. and Ajibade L. T., Assessment of water quality
and domestic uses in medium-sized towns of Niger State, Nigeria. Transnational Journal of Science and Technology edition vol. 2, No.5, 2012.
[5] Kowalkowski T., Zbytniewski R., Szpejna J. and Buszewski B., Application chemometrics in river water classification. Water Research, 40, 744–752, 2006.
[6] Morenikeji W., Sanusi Y. A, and Jinadu A. M., The Role of Private Voluntary Organizations’ in Community and Settlement Development in Niger State, A Research Report Submitted to the Centre for Research and Documentation, Kano, 2000.
Lecture Notes in Earth Sciences. Published by Springer Dordreccht Heidelberg, New York, 2009.
[8] Olasehinde P. I., The Groundwater of Nigeria: A Solution to Sustainable National Water Needs. Inaugural Lecture Series 17, Federal University of Technology, Minna. September, 2010.
[9] Shrestha S. and Kazama F., Assessment of surface water quality using multivariate statistical techniques: A case study of the Fuji river basin, Japan. Environmental Modelling and Software, 22, 464–475, 2007.
[10] Simeonov V., Stratis J. A., Samara C., Zachariadis G., Voutsa D. and Anthemidis A. et al., Assessment of the surface water quality in Northern Greece. Water Research, 37, 4119–4124, 2003.
[11] Singh K. P., Malik A., Mohan D. and Sinha S., Multivariate statistical techniques for the evaluation of spatial and temporal variations in water quality of Gomti River (India) – A case study. Water Research, 38, 3980–3992, 2004. [12] Singh K. P., Malik A., Singh V. K., Mohan D. and Sinha S.,
Chemometric analysis of groundwater quality data of alluvial aquifer of Gangetic Plain, North India. Analytica Chimica Acta, 550, 82–91, 2005.
[13] UNEP/ WHO, Water quality Monitoring, A practical guide to the design and implementation of freshwater quality Studies and Monitoring Programmes edited by Jamie Bartram and Richard Balance. Printed in Great Britain by TJ Press (Padstow) Ltd, Padsow, Cornwell, 1996.
[14] Vega M., Pardo R., Barrado E. and Deban L., Assessment of seasonal and polluting effects on the quality of river water by exploratory data analysis. Water Research, 32, 3581– 3592, 1998.
[15] Wunderlin D. A., Diaz M. D. P., Ame M. V., Pesce S. F., Hued A. C. and Bistoni M. D., Pattern recognition techniques for the evaluation of spatial and temporal variations in water quality. A case study: Suquia River Basin (Cordoba Argentina). Water Research, 35, 2881–2894, 2001.
[16] Niger State Bureau of Statistics. Facts and Figures about Niger state of Nigeria, 2012 edition.
[17] en.wikipedia.org/wiki/Geography_of_Nigeria
[18] Dillon, W.R., and M. Goldstein. Multivariate analysis methods and applications. John Wiley and Sons, New York. 1984.
[19] Johnson, R. A., & Wichern, D. W.. Applied multivariate statistical analysis (5th edn.). New Jersey: Prentice-Hall. 1992.
[20] Lattin, J., Carroll, D., & Green, P.. Analyzing multivariate data. New York: Duxbury. 2003.
[21] McKenna, J.. An enhanced cluster analysis program with bootstrap significance testing for ecological community analysis. Environmental Modelling and Software, 18, 205– 220. 2003.
[22] Otto, M.. Multivariate methods. In: Kellner, R., Mermet, J. M., Otto, M., & Widmer, H. M. (Eds.), Analytical Chemistry. Weinheim: Wiley-VCH. 1998.
[23] Vaylay, R., and. Van Santen. E. Application of canonical discriminant analysis for the assessment of genetic variation in tall fescue.Crop Sci. 42:534–539. 2002
[24] R. Core Team (2011-12-22). R: A language and environment for statistical computing. R Foundation for Statistical Computing, Vienna, Austria. ISBN 3-900051-07-0, URL http://www.R-project.org/.
[25] Christine A. B. and Indar M. Potential sources of bacteriological pollution for two bays with marinas in Trinidad. Rev. biol. Trop, 53 (1): 2005.
[26] Izonfuo L. W.A. and Bartweni A. P. The Effect of Urban Runoff Water And Human Activities On Some Physico-Chemical Parameters of The Epie Creek In The Niger Delta. Journal of Applied Science and Environmental Management, 5(1):47-55. 2001.