MODELS OF HOURLY DRY BULB TEMPERATURE AND RELATIVE
HUMIDITY OF KEY SELECTED AREAS IN NIGERIA FOR
ENGINEERING APPLICATIONS
J. A. Olorunmaiye
1, *and O. O. Awolola
21 DEPARTMENT OF MECHANICAL ENGINEERING,UNIVERSITY OF ILORIN,P.M.B.1515,ILORIN,KWARA STATE,NIGERIA 2 DEPARTMENT OF MECHANICAL ENGINEERING,FEDERAL POLYTECHNIC,ILARO,P.M.B.50,ILARO,OGUN STATE,NIGERIA
E-mail addresses: 1 [email protected], 2 [email protected]
ABSTRACT
Hourly meteorological data of both dry bulb temperature and relative humidity for 18 locations in Nigeria for the period 1995 to 2009 were analysed to obtain the mean monthly average and monthly hourly average of each of the two meteorological variables for each month for each location. The difference between the maximum and minimum values of the monthly hourly averages of each variable for each month were also computed and taken as the range of that variable for each location. The monthly hourly averages of each variable for each month and for each location were standardized by subtracting the mean monthly average from it and dividing it by the computed range and plotted against time. Twelve curves for the months of the year were obtained for each of the eighteen locations making a total of 216 curves for each meteorological variable. The average of the 216 curves was used to develop Fourier series for each variable. Mean Forecast Error (MFE), Mean Absolute Deviation (MAD) and Mean Absolute Percentage Error (MAPE) were used to compare results of the models with results from the meteorological data. The agreements between them were very good. The values of the mean monthly averages and the ranges for dry bulb temperature and relative humidity were presented in Tables so that these input values that need to be fed into the models are readily available. Since the eighteen locations are well spread out over Nigeria, it is appropriate to use these models as inputs in computer programs for simulation of refrigerator, air conditioning systems and internal combustion engines operating anywhere in Nigeria.
Keywords: Dry bulb temperature, Relative humidity, Air conditioning systems, Models, Fourier series.
1. INTRODUCTION
Nigeria is a tropical country in the West African sub-region having only two seasons in a year (Dry and Rainy seasons). The country is divided into the Federal Capital Territory and thirty-six States which are grouped into six geo-political zones, each zone consisting of not less than five States.
The Nigerian Meteorological Agency (NiMet) has been gathering weather data since 1893 [1]. Among these are hourly dry bulb and relative humidity data. Erbs [2] used 20 years hourly data to develop a single Fourier series model for each of dry bulb temperature and relative humidity for nine cities in United States of America. Ariyo [3] developed Fourier series models for dry bulb temperature and relative humidity for each of Ikeja and Ilorin using 1978 to 1992 meteorological data of the two locations. Olorunmaiye et al. found that
these models developed from the 1978 to 1992 data were applicable to the meteorological data for 1995 to 2008 for Ilorin and Ikeja despite the evidence of global warming observed from the analysis of the sets of data for the two periods [4].
Akor and Ideriah [5] carried out a study in developing Fourier series model which fit the data for solar zones. The model could be used to predict the average monthly solar radiation on a horizontal surface in any location of solar zones in Nigeria. The models are useful for providing information for power generation and prediction of climate change due to periodic variation in solar radiation.
In an investigation of the evidences of climate change in Ghana, Agyirifo and Otwe [6] analyzed the available rainfall and temperature records of mean monthly minimum and maximum temperature for the periods
Copyright© Faculty of Engineering, University of Nigeria, Nsukka,
1931 to 1960, 1961 to 1990 and 1991 to 2008 for the following seven synoptic stations: Kumasi, Akusa, Teme, Accra, Saltpond, Navrongo and Axim. From their comparison of the weather statistics for the three periods, they saw evidence of global warming. They developed both Fourier series and polynomial models to fit these temperature data and they were found to be good with coefficient of determination of 80% for the equations in all the stations. Their models can be used for temperature profile monitoring, forecasting mean monthly temperatures and creating awareness of increasing temperature due to global warming. In a recent work, King used functional data analysis methods to check climate change in selected group of 16 cities in the United States and he reiterated the appropriateness of fitting a Fourier series to the full data set as a functional data technique [7].
Fagbenle obtained monthly-averaged ten-year data series of global solar irradiation, average ambient temperature and mean relative humidity for Ibadan and he developed Fourier series for each year for meteorological variable [8].
Ciprain and Lehman [9] developed a model on the effect of relative humidity, moisture and extreme environmental condition on power electronics performance. They discussed the effect of relative humidity on power electronic performance. The study of the diurnal variation of dry bulb temperature and relative humidity is of great importance to air conditioning system design.
The operation of air breathing engines is controlled so that aspiration of surrounding air at different dry bulb temperature and relative humidity will not significantly affect power output, fuel efficiency, combustion stability and exhaust gas emissions [10]. Gas turbines are very sensitive to high ambient temperatures [11]. Hart [12] reported that high dry bulb temperature and coincident high relative humidity that often occurs in the Niger-Delta is not conducive for optimum performance of gas turbine and he proposed that cooling and humidifying unit be installed at the inlet of the compressor to prevent condensation of water vapour in the first row of compressor blade.
The objective of this work is to develop a single Fourier series for each of dry bulb temperature and relative humidity from the data obtained from eighteen meteorological stations scattered throughout the six geo-political zones of Nigeria. Developing such models will be an improvement over the earlier work reported by Olorunmaiye et al [5] in which a separate Fourier series model was developed for each of the
two weather variables for each of the two meteorological stations. Such models can be used as input for simulation models for refrigerators and air-conditioners all over Nigeria.
2. METHODOLOGY
Hourly dry bulb and relative humidity data for the period 1995 to 2009 were obtained from NiMet for eighteen locations in Nigeria. The selected meteorological stations are: Abuja in the Federal Capital Territory, Bauchi, Benin city, Calabar, Enugu, Ibadan, Ikeja, Ilorin, Jos, Kaduna, Kano, Maiduguri, Minna, Ondo, Owerri, Port-Harcourt, Sokoto and Yola. The Seventeen locations apart from Abuja include three places from each geo-political zone except the South-East with two stations
The mean monthly average of each of the two meteorological variables, ̅and ̅and the monthly hourly average of dry-bulb temperature ( ̅ ) and relative humidity ( ̅ ) were computed for each month of the year for each of the eighteen locations using the fifteen-year hourly data. The difference between the maximum and minimum values of the hourly averages of each variable for each month, ( ̅ ̅ ) and
( ̅ ̅ ) were also computed and taken as the
range of that variable for each location.
The ̅ and ̅ versus time for each month for each of the eighteen locations were standardized by changing them to ̅ ̅
̅ ̅ versus time and
̅ ̅ ̅ ̅
versus time.
A curve for each month of the year for each location was obtained for each variable. This gave 216 (12 x 18) curves for each of the two meteorological variables.
The ̅ versus time and ̅ versus time curves for each month were standardized by changing them to
̅ ̅
̅ ̅ versus time and
̅ ̅
̅ ̅ versus time,
respectively. The average of the 216 standardized
temperature variable ̅ ̅ ̅
̅ versus time were
3. RESULTS
As was observed by Erbs in his work [2], only the first four harmonics were found to be significant also in this work. Therefore the Fourier series containing the first four harmonics are presented in equations 1 and 2 below for dry bulb temperature and relative humidity respectively.
̅ ̅ ̅ ̅
.4 ( . 2)
.12 (2 . ) . 14 ( . 2 )
. 212 (4 .2 4) (1) ̅ ̅
̅ ̅
.4 2 ( . )
.12 (2 . 42 ) . 212 ( 4.2 )
. 2 (4 . ) (2) Where t* 2πt/24 and t , 1, 2, …………, 2
Greenwich Mean Time (GMT) (3)
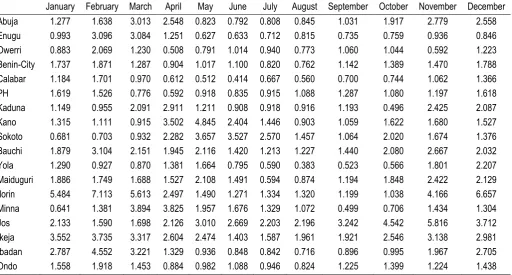
The values for the monthly ranges and monthly averages of dry bulb temperature and relative humidity which are the input values for the developed Fourier series are presented in Tables 1 & 2, and Tables 3 & 4, respectively.
3.1 Checking for the Accuracy of the Models
The accuracy of the results were checked using the following Statistical tools: Mean Forecasting Error (MFE), Mean Absolute Deviation (MAD) and Mean Absolute Percentage Error (MAPE).
The equations for MFE and MAD given by Yacko [14] are:
1∑( ) (4)
and
1∑ | | ( )
Where AVi is the ith Actual Value, FVi is the ith forecast Value, and n is the number of data points (=24)
The equation for mean absolute percentage error (MAPE) given by Stellwagen [15] is:
(1∑| |
| | ) 1 ( )
The results predicted using Fourier series Models were compared with results obtained directly from Weather Data for the eighteen locations. Tables 5 to 7and Tables 8 to 10show the Mean Forecasting Error, Mean Absolute Deviation and Mean Absolute
Percentage Error for dry bulb temperature and relative humidity, respectively.
4. DISCUSSION OF RESULTS
Mean Forecast Error (MFE) is a measure of predicting model bias and its ideal value is zero [16]. Therefore the smaller its magnitude, the better the model forecasts the diurnal variation of that variable for that month. Bozart regarded an MFE of magnitude 0.33 as a case in which the forecasted values obtained from the model differed slightly from the actual values of the variables [16]. Only 16 out of the 216 MFE values for dry bulb temperature had magnitude greater than 0.33. The highest absolute values of the MFE for dry bulb temperature occurred for Sokoto and Bauchi. They were all negative showing that the model slightly or somewhat over-forecasts the diurnal dry bulb temperature for all the months. Only 23 of the MFE values for relative humidity had magnitude greater than 0.33. Most of the MFE values for relative humidity model had values that were about a hundredth or a thousandth of 0.33. Again the highest MFE values computed were for Sokoto and Bauchi but they were all positive showing that the Fourier model for relative humidity under-forecast the diurnal relative humidity for all the months. See Figures 3 and 4 for the comparisons of the Fourier models with actual data for the cases with the worst MFE values and the cases with the best MFE values, respectively.
From Mean Absolute Deviation (MAD) table for dry temperature (Table 6), the highest average error was 1. ºC (≈1.4ºC) which occurred for Kano in the month of February. The lowest MAD was 0.143ºC which occurred at Calabar in the month of August. Only thirteen of the 216 MAD values were greater than 1.0ºC.
From Table 9, the highest and lowest MAD values for relative humidity was 7.113which occurred at Ilorin for the month of February. The lowest average error was 0.383 and it occurred at Yola in the month of August. Only 26 of 216 MAD values in Table 9 are greater than 3.
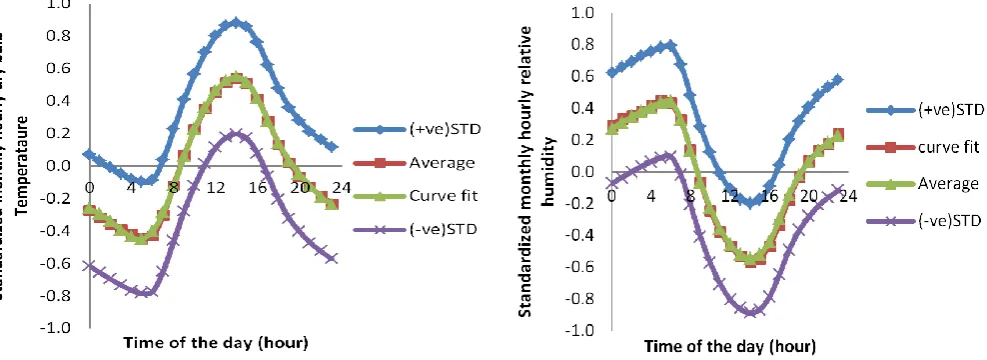
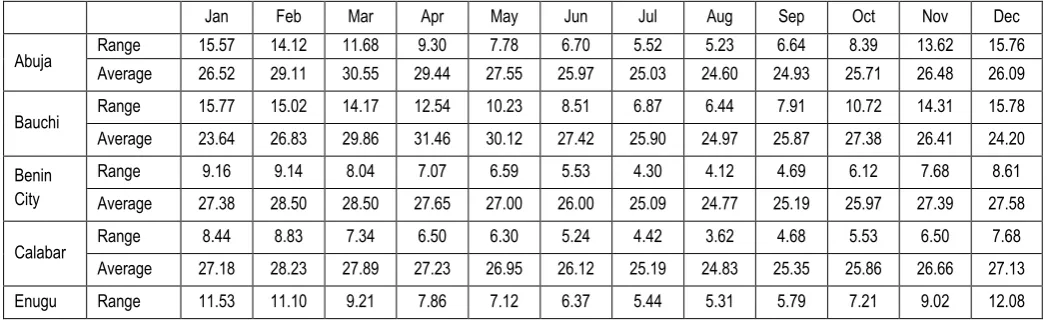
Fig. 1: The average of 216 diurnal variation of standardized monthly hourly dry bulb temperature , ̅ ̅
̅ ̅
Fig. 2: The average of 216 diurnal variation of standardized monthly hourly relative humidity ̅ ̅
̅ ̅
Fig. 3: Worst cases of MFE for Dry bulb temperature and Relative humidity
Fig. 4: Best cases of MFE for Dry bulb temperature and Relative humidity
5. CONCLUSION
A single Fourier series model has been developed for each of the two variables (hourly dry bulb temperature and hourly relative humidity) for eighteen locations widely spread throughout Nigeria. Using three error estimate statistical tools, the models developed were found to be excellent for all the 18 locations except for
Bauchi and Sokoto where the models can be said to be good. Considering the spread of the eighteen locations, the Fourier series models can be used for all locations in Nigeria as input for simulation of refrigeration and air conditioning systems and internal combustion engines. 10.0 15.0 20.0 25.0 30.0 35.0 40.0
0 4 8 12 16 20 24
M e an D ry -B ul b Tem p. (° C e lci us )
Time of Day (hours) (a) Bauchi-March
MFE = -0.8218
Model Data 30.0 40.0 50.0 60.0 70.0 80.0 90.0
0 4 8 12 16 20 24
M e an R e lat iv e hum idi ty (% )
Time of Day (hours) (b) Bauchi-October
MFE = 1.5373
Model Data 10.0 15.0 20.0 25.0 30.0
0 4 8 12 16 20 24
M e an D ry -B ul b Tem p. (° C e lci us )
Time of Day (hours) (a) Ondo-August
MFE = 0.0001
Model Data 80.0 84.0 88.0 92.0 96.0 100.0
0 4 8 12 16 20 24
M e an R e lat iv e hum idt y (% )
Time of Day (hours) (b) Calabar-August
MFE = -0.0005
6. REFERENCES
[1] Nnodu, I. D. and Wilson, S. M. Climate Change and Environmental Development, Book of Abstracts of the Second Joint International Conference of University of Ilorin, Ilorin, Nigeria and University of Cape Coast, Cape Coast, held on May 1-5, 2011, themed; Climate change and sustainable development pp 74-75
[2] Erbs, D. G., “Models and Applications for Weather Statistics Related to Building Heating and Cooling Loads”, Ph. D. Thesis, Department of Mechanical Engineering, University of Wisconsin, Madison, 1984.
[3] Ariyo, D. O., “Models for Ambient Dry bulb Temperature and Relative Humidity Statistics related to Building Cooling Loads for Ilorin and Ikeja”, M.eng. Project Report, Department of Mechanical Engineering, University of Ilorin, Ilorin, Nigeria, 1997
[4] Olorunmaiye, J. A., Ariyo, D. O., Awolola, O. O., and
Omolehin, I. S. “Models of Dry-Bulb Temperature and Relative Humidity for Ilorin and Ikeja Suitable For Engineering Applications” Journal of Engineering Research, Volume 20, No. 1, 2015, pp. 81-93.
[5] Akor, A. J. and Ideriah, F. K. J. “A Study of Solar Radiation Distribution in Nigeria” Book of Proceeding of Global Climate Change Impact on energy development conference, 1995, pp 67-71
[6] Agyirifo, D. S. and Otwe, E. P., “Temperature Profile Cycles Over year Period in Ghana”, Book of Abstracts of the Second Joint International Conference of University of Ilorin, Ilorin, Nigeria and University of Cape Coast, Cape Coast held on May 1-5, 2011, themed: Climate Change and Sustainable Development 2011, pp 60.
[7] King, K, “Functional Data Analysis with Application to United States Weather Data”May 1 , 2 14 available @http://scholarworks.uvm.edu/
hcoltheses/10/ accessed on11th February, 2016
[8] Fagbenle, R. L., “Fourier analysis of climatological data series in a tropical environment”, International Journal of Energy Research, vol. 19, No 2, pp. 117 – 123, 1995.
[9] Ciprian, R. and Lehman, B., “Modeling effects of relative humidity, moisture, and extreme environmental conditions on power electronic performance”, 2 @ -1-4244-2893-9/09/$25.00 IEEE
[10] Valo, J. and Paasima, S.,“Measuring Ambient Conditions”, WARTSILA Technical Journal in Detail, Issue No. 2, 2009, pp14 – 16.
[11] Wideskog, M., and Astrand,U., “The Wartsila 4SG Gas Engine’s Output Increased to 1 MW”, WARTSILA Technical Journal in Detail, Issue No 01, 2010, pp17 – 20.
[12] Hart, H. I., “Design for Gas Turbine Performance Improvement in the Niger – Delta Area of Nigeria”, NSE Technical Transactions, vol. 29, No. 3, 1994 pp46 – 57.
[13] Beckwith, T. G., Buck, N. L., and Marangoni, R. D., Mechanical Measurements, 3rd Edition,
Addison-Wesley Publishing Co. Reading, Massachusetts, pp. 37 – 46, 1982.
[14] Yacko, S, “Measuring Forecast Accuracy”, https://leve.rs/blog/how-to-measure-forecast- accuracy/, 2013 accessed on 7th June, 2015.
[15] Stellwagen, E, “Forecasting 1 1: A Guide to Forecast Error Measurement Statistics and How to Use Them”, http://www.forecastpro.com/
Trends/forecasting101August2011.html,201,
5accessed on 7th June, 2015.
[16] Bozarth, C., “SCRC Article Library: Measuring Forecasting Accuracy: Approaches to Forecasting: A Tutorial, cm.ncsu.edu/scm-articles/article/ measuring-forecsat-accuracy-approaches-to-forecasting-a-tutorial, 2011, accessed on 28th
December, 2015.
Table 1: The range (Thmax - Thmin) and average values of dry bulb temperature for Abuja, Bauchi, Benin City, Calabar, Enugu, Ibadan, Ikeja, Ilorin and Jos.
Jan Feb Mar Apr May Jun Jul Aug Sep Oct Nov Dec
Abuja Range 15.57 14.12 11.68 9.30 7.78 6.70 5.52 5.23 6.64 8.39 13.62 15.76
Average 26.52 29.11 30.55 29.44 27.55 25.97 25.03 24.60 24.93 25.71 26.48 26.09
Bauchi Range 15.77 15.02 14.17 12.54 10.23 8.51 6.87 6.44 7.91 10.72 14.31 15.78
Average 23.64 26.83 29.86 31.46 30.12 27.42 25.90 24.97 25.87 27.38 26.41 24.20
Benin City
Range 9.16 9.14 8.04 7.07 6.59 5.53 4.30 4.12 4.69 6.12 7.68 8.61
Average 27.38 28.50 28.50 27.65 27.00 26.00 25.09 24.77 25.19 25.97 27.39 27.58
Calabar Range 8.44 8.83 7.34 6.50 6.30 5.24 4.42 3.62 4.68 5.53 6.50 7.68
Average 27.18 28.23 27.89 27.23 26.95 26.12 25.19 24.83 25.35 25.86 26.66 27.13
Jan Feb Mar Apr May Jun Jul Aug Sep Oct Nov Dec
Average 27.17 29.03 29.63 28.55 27.21 26.36 25.70 25.57 25.70 26.39 27.26 26.66
Ibadan Range 9.70 10.28 9.27 7.65 7.20 5.77 4.78 4.65 5.46 6.76 9.09 9.22
Average 27.53 28.82 28.68 27.88 27.16 25.86 24.87 24.54 25.13 25.98 27.07 27.62
Ikeja Range 8.45 8.00 7.15 6.29 5.67 4.62 4.11 4.20 4.53 5.44 6.81 7.86
Average 27.49 28.61 28.91 28.44 27.66 26.20 25.51 25.27 25.60 26.37 27.47 27.74
Ilorin Range 13.16 12.74 11.39 9.15 7.73 6.78 5.71 5.45 6.50 7.80 11.09 13.15
Average 26.85 28.73 29.44 28.37 27.09 25.77 24.94 24.53 25.01 25.85 27.05 26.74
Jos Range 15.15 14.95 13.35 10.23 7.78 6.65 5.09 5.12 7.06 9.63 13.45 14.96
Average 19.25 21.66 24.03 23.82 22.35 21.17 19.78 19.73 20.56 21.32 20.37 19.59
Table 2: The range (Thmax - Thmin) and average values of dry bulb temperature for Kaduna, Kano, Maiduguri, Minna, Ondo, Owerri, Port Harcourt, Sokoto and Yola
Jan Feb Mar Apr May Jun Jul Aug Sep Oct Nov Dec
Kaduna Range 14.73 14.59 13.83 11.27 9.45 7.98 6.77 6.16 8.03 9.85 14.98 15.33
Average 23.12 25.67 28.78 29.04 27.16 25.23 24.34 23.77 24.36 25.19 24.72 23.27
Kano Range 15.21 15.33 15.11 13.49 11.60 9.61 7.77 7.00 8.56 11.85 15.31 15.72
Average 21.72 24.56 28.69 31.85 31.30 28.72 26.57 25.63 26.72 27.73 25.33 22.30
Maidugu ri
Range 17.83 17.48 17.40 14.84 12.39 9.64 7.74 6.46 8.47 13.19 17.68 18.54
Average 22.23 25.21 29.43 32.99 32.90 30.34 28.05 26.46 27.56 28.44 25.87 22.90
Minna Range 12.57 12.50 11.28 9.85 7.96 7.01 5.90 5.14 6.36 8.38 12.90 13.96
Average 27.54 30.06 31.97 31.00 28.57 26.64 25.60 25.11 25.54 26.54 27.69 27.42
Ondo Range 10.31 10.62 9.14 7.57 7.09 6.23 4.99 4.72 5.58 7.02 8.57 9.40
Average 26.97 28.06 27.78 26.93 26.39 25.32 24.44 24.08 24.63 25.44 26.86 27.13
Owerri Range 9.46 9.46 8.53 7.87 7.20 6.18 5.24 5.05 5.68 6.58 7.75 9.45
Average 28.36 29.37 29.09 28.37 27.61 26.62 25.85 25.73 25.96 26.75 28.07 28.65
Port Harcourt
Range 10.06 9.70 8.15 7.11 6.61 5.36 4.61 4.66 4.81 5.58 7.52 9.07
Average 26.80 27.81 27.76 27.32 26.81 25.96 25.34 25.31 25.38 25.86 26.76 26.72
Sokoto Range 14.90 15.20 14.73 12.97 10.87 9.50 7.77 6.82 8.44 12.49 15.56 15.51
Average 24.59 27.18 31.24 34.30 33.21 30.91 28.28 26.81 27.86 30.14 29.12 26.19
Yola Range 15.39 14.78 13.64 11.20 9.10 7.14 6.37 5.73 6.68 8.50 15.35 16.40
Average 26.05 29.07 32.67 33.35 30.93 28.20 27.29 26.43 26.72 27.82 27.47 25.71
Table 3: The range (Rhmax - Rhmin) and average values of relative humidity for Abuja, Bauchi, Benin City, Calabar, Enugu, Ibadan, Ikeja, Ilorin and Jos
Jan Feb Mar Apr May Jun Jul Aug Sep Oct Nov Dec
Abuja Range 36.49 29.79 34.48 36.49 31.48 27.68 23.56 22.39 26.23 31.56 47.60 45.49
Average 44.70 40.10 48.82 65.01 76.53 81.91 86.06 87.40 85.75 82.43 66.71 52.20
Bauchi Range 23.91 20.15 18.00 29.52 33.10 30.79 24.62 22.05 25.75 33.32 28.98 26.58
Average 33.88 28.97 25.75 40.92 56.91 68.30 75.52 79.98 76.32 62.23 39.73 35.48
Benin City
Range 40.71 42.75 35.49 29.07 26.06 22.02 16.90 16.39 18.43 24.15 34.40 40.72
Average 71.68 74.11 79.81 83.79 85.65 88.51 90.92 91.62 90.90 88.08 82.41 77.50
Calabar Range 36.54 41.69 32.55 27.22 26.06 21.33 18.26 14.74 19.16 22.70 27.90 35.56
Average 75.72 76.25 81.72 84.95 85.85 88.18 90.29 91.70 89.94 88.21 86.24 81.25
Jan Feb Mar Apr May Jun Jul Aug Sep Oct Nov Dec
Average 54.85 55.56 65.49 75.46 80.96 83.29 84.77 84.86 85.51 83.47 74.63 63.41
Ibadan Range 36.46 46.83 42.98 34.41 31.13 26.05 20.79 19.73 23.43 28.68 40.30 41.34
Average 60.85 62.86 71.25 78.20 81.10 84.03 86.91 87.18 86.03 83.58 74.84 67.34
Ikeja Range 37.10 38.18 32.89 28.45 23.91 18.53 18.69 20.11 19.41 22.00 28.35 34.80
Average 77.13 77.58 79.47 82.17 84.81 88.69 88.32 87.39 88.82 87.70 85.26 81.82
Ilorin Range 43.96 47.66 48.25 38.97 33.45 29.70 25.10 23.12 27.69 34.06 53.68 54.31
Average 49.16 48.89 60.24 72.69 78.64 82.46 84.61 85.48 84.94 81.88 66.60 56.24
Jos Range 23.79 23.00 32.51 44.31 38.55 29.16 22.80 20.80 31.80 45.72 40.01 27.85
Average 31.31 29.13 37.32 63.08 76.41 84.29 88.58 89.76 84.33 72.18 45.19 35.67
Table 4: The range (Rhmax - Rhmin) and average values of relative humidity for Kaduna, Kano, Maiduguri, Minna, Ondo, Owerri, Port Harcourt, Sokoto and Yola
Jan Feb Mar Apr May Jun Jul Aug Sep Oct Nov Dec
Kaduna Range 19.88 17.07 22.54 34.13 36.55 31.96 29.55 26.94 32.14 41.57 39.13 27.37
Average 27.71 24.79 28.37 50.94 68.08 76.24 79.96 82.48 79.61 70.01 42.08 32.06
Kano Range 27.93 23.32 20.54 30.12 38.38 34.52 29.78 27.66 32.76 43.41 33.51 30.80
Average 31.94 26.44 23.37 33.49 47.86 63.73 75.46 80.54 76.12 56.20 36.75 36.70
Maiduguri Range 33.31 27.42 22.14 24.92 34.49 34.22 30.56 26.98 33.71 44.09 37.01 37.14
Average 28.95 23.21 18.85 26.45 40.74 56.92 70.70 79.89 75.42 56.40 34.13 31.82
Minna Range 17.17 16.19 26.77 33.81 31.37 28.48 23.71 22.06 25.37 31.77 37.69 25.01
Average 32.49 30.62 40.64 58.30 72.02 79.40 83.64 85.98 84.23 79.10 51.14 39.30
Ondo Range 37.99 44.28 39.83 30.17 27.04 22.81 18.41 17.32 20.37 26.01 36.41 40.02
Average 66.65 68.61 76.50 83.80 85.56 88.12 90.38 90.72 89.71 87.32 80.43 73.90
Owerri Range 37.62 39.17 35.57 31.15 28.65 24.60 20.61 20.00 21.63 25.59 33.43 41.94
Average 64.95 67.17 74.69 78.91 81.72 84.55 87.19 87.51 87.06 84.44 78.70 69.54
Port Harcourt Range 42.75 43.58 33.98 27.51 25.33 21.35 18.47 17.52 18.66 22.08 29.28 38.93
Average 74.72 75.46 80.87 83.83 85.68 88.06 89.47 89.92 89.91 88.04 85.14 80.29
Sokoto Range 16.69 13.96 13.12 22.50 33.10 34.32 31.39 27.62 32.11 40.83 22.78 18.53
Average 25.31 21.12 19.39 29.86 46.14 57.17 70.20 78.71 74.67 53.57 28.83 28.16
Yola Range 28.35 21.39 23.14 30.93 34.40 28.79 26.71 24.10 26.71 34.72 51.40 38.37
Average 33.56 27.86 28.93 46.16 63.17 75.47 79.98 83.75 82.80 76.99 53.86 42.21
Table 5: The Computed Mean Forecasting Error (MFE) of Dry bulb temperature for Comparison Results of Predicted Using Fourier series Models with Results Obtained Directly from Weather Data
January February March April May June July August September October November December
Abuja 0.0004 0.0027 0.0003 0.0003 0.0002 0.0002 0.0002 0.0001 0.0002 0.0002 0.0004 0.0004
Enugu 0.0003 0.0021 0.0003 0.0002 0.0002 0.0002 0.0002 0.0002 0.0002 0.0002 0.0003 0.0003
Owerri 0.0003 0.0018 0.0002 0.0002 0.0002 0.0002 0.0001 0.0001 0.0002 0.0002 0.0002 0.0003
Benin-City 0.0003 0.0003 -0.2151 0.0002 0.0002 0.0002 0.0001 0.0001 0.0001 0.0002 0.0002 0.0002
Calabar 0.0002 0.0003 0.0002 0.0002 0.0002 0.0001 0.0001 0.0001 0.0001 0.0002 0.0002 0.0002
PH 0.0003 0.0019 0.0002 0.0002 -0.0011 0.0002 0.0001 0.0001 0.0016 0.0002 0.0002 0.0003
Kaduna 0.0004 0.0028 0.0004 0.0003 0.0003 0.0002 0.0002 0.0002 0.0002 0.0003 0.0004 0.0004
Kano 0.0004 0.0029 0.0004 0.0004 0.0003 0.0003 0.0002 0.0002 0.0002 0.0003 0.0004 0.0004
Sokoto -0.1878 -0.0108 -0.2861 -0.5713 -0.2787 -0.1803 -0.0838 -0.0294 -0.1126 -0.4699 -0.7606 -0.5209
January February March April May June July August September October November December
Yola 0.0004 0.0028 0.0004 0.0000 0.0003 0.0002 0.0002 0.0002 0.0002 0.0002 0.0004 0.0005
Maiduguri 0.0005 0.0034 0.0005 0.0004 0.0004 0.0002 0.0002 0.0002 0.0002 0.0004 0.0005 0.0005
Ilorin -0.0934 -0.0978 -0.0735 -0.0069 0.0002 0.0003 -0.0538 -0.0479 -0.0605 -0.0693 -0.0974 -0.1234
Minna 0.0004 0.0024 0.0003 0.0003 0.0002 -0.0013 0.0002 0.0001 0.0002 0.0002 0.0004 0.0004
Jos 0.0004 0.0029 0.0004 0.0003 0.0002 -0.0005 0.0001 0.0001 0.0002 0.0003 0.0004 -0.1491
Ikeja -0.0489 -0.0378 -0.0510 -0.0456 -0.0558 -0.0327 -0.0433 -0.0514 -0.0326 -0.0405 -0.0476 -0.0445
Ibadan 0.0003 0.0020 0.0003 0.0002 0.0002 0.0002 0.0001 0.0003 0.0002 0.0002 0.0003 0.0003
Ondo 0.0003 0.0020 0.0003 0.0002 0.0002 0.0002 0.0001 0.0001 0.0002 0.0002 0.0002 0.0003
Table 6: The Computed Mean Absolute Deviation (MAD) of dry bulb temperature for Comparison of Results Predicted Using Fourier series Models with Results Obtained Directly from Weather Data
January February March April May June July August September October November December
Abuja 0.735 0.854 0.715 0.491 0.297 0.246 0.212 0.218 0.261 0.480 0.638 0.660
Enugu 0.624 0.781 0.600 0.394 0.313 0.229 0.178 0.198 0.187 0.224 0.285 0.411
Owerri 0.436 0.460 0.244 0.236 0.203 0.217 0.204 0.146 0.229 0.224 0.203 0.284
Benin-City 0.457 0.444 0.390 0.313 0.255 0.256 0.248 0.212 0.304 0.325 0.348 0.328
Calabar 0.479 0.432 0.251 0.218 0.202 0.175 0.150 0.143 0.181 0.234 0.253 0.298
PH 0.457 0.355 0.252 0.279 0.278 0.220 0.221 0.249 0.319 0.287 0.317 0.328
Kaduna 0.653 0.774 0.717 0.525 0.349 0.303 0.256 0.219 0.300 0.325 0.631 0.583
Kano 1.141 1.369 1.101 0.854 0.681 0.630 0.466 0.349 0.414 0.442 0.623 0.836
Sokoto 0.989 1.079 0.785 0.825 0.825 0.881 0.700 0.515 0.430 0.547 0.822 0.731
Bauchi 0.857 1.091 0.910 0.744 0.619 0.453 0.403 0.429 0.510 0.832 1.274 0.827
Yola 0.683 0.793 0.667 0.374 0.316 0.221 0.188 0.155 0.189 0.314 0.558 0.659
Maiduguri 0.683 0.748 0.716 0.654 0.380 0.265 0.210 0.223 0.348 0.607 0.889 0.767
Ilorin 0.447 0.446 0.300 0.340 0.349 0.294 0.232 0.145 0.303 0.487 0.595 0.423
Minna 1.061 1.133 1.075 0.874 0.482 0.477 0.414 0.337 0.227 0.283 0.526 0.565
Jos 0.643 0.616 0.598 0.628 0.667 0.538 0.415 0.417 0.569 0.888 1.212 1.027
Ikeja 0.468 0.604 0.647 0.648 0.552 0.401 0.421 0.485 0.497 0.633 0.758 0.585
Ibadan 1.068 1.013 0.609 0.344 0.337 0.194 0.276 0.296 0.271 0.285 0.343 0.747
Ondo 0.635 0.594 0.407 0.327 0.243 0.223 0.162 0.152 0.229 0.311 0.349 0.399
Table 7: The Computed Mean Absolute Percentage Error (MAPE) of dry bulb temperature for Comparison of Results Predicted Using Fourier series Models with Results Obtained Directly from Weather Data
January February March April May June July August September October November December
Abuja 2.97 3.03 2.33 1.64 1.04 0.93 0.83 0.87 1.05 1.87 2.47 2.64
Enugu 2.31 2.67 2.01 1.37 1.13 0.86 0.69 0.77 0.73 0.86 1.07 1.58
Owerri 1.53 1.54 0.83 0.84 0.74 0.81 0.79 0.57 0.88 0.83 0.73 1.00
Benin-City 1.68 1.55 1.41 1.14 0.95 0.99 0.98 0.86 1.20 1.25 1.29 1.20
Calabar 1.81 1.56 0.91 0.82 0.76 0.67 0.60 0.58 0.72 0.90 0.95 1.12
PH 1.74 1.31 0.93 1.04 1.03 0.85 0.87 0.97 1.25 1.10 1.19 1.25
Kaduna 2.99 3.13 2.53 1.80 1.23 1.17 1.03 0.91 1.23 1.31 2.57 2.62
Kano 5.40 5.70 3.88 2.69 2.15 2.16 1.74 1.36 1.57 1.66 2.63 3.96
Sokoto 4.30 4.11 2.60 2.49 2.47 2.83 2.46 1.90 1.54 1.90 3.03 3.07
Bauchi 4.22 4.37 3.36 2.50 2.17 1.72 1.62 1.80 2.06 3.21 5.23 3.75
Yola 2.66 2.74 2.04 1.14 1.00 0.78 0.69 0.60 0.71 1.13 2.09 2.64
Maiduguri 3.37 3.19 2.57 2.05 1.17 0.86 0.75 0.84 1.27 2.14 3.50 3.60
Ilorin 1.74 1.61 1.06 1.22 1.30 1.15 0.94 0.59 1.22 1.89 2.20 1.65
Minna 3.91 3.77 3.33 2.78 1.64 1.74 1.58 1.32 0.88 1.06 1.96 2.16
January February March April May June July August September October November December
Ikeja 1.69 2.08 2.19 2.24 1.96 1.51 1.64 1.91 1.93 2.37 2.69 2.07
Ibadan 3.93 3.52 2.11 1.24 1.26 0.76 1.12 1.21 1.09 1.10 1.29 2.75
Ondo 2.39 2.10 1.46 1.22 0.92 0.88 0.66 0.63 0.92 1.22 1.30 1.48
Table 8: The Computed Mean Forecasting Error (MFE) of Relative humidity for Comparison of Results Predicted Using Fourier series Models with Results Obtained Directly from Weather Data
January February March April May June July August September October November December
Abuja -0.0012 -0.0010 -0.0011 -0.0012 -0.0010 -0.0009 -0.0008 -0.0007 -0.0009 -0.0010 -0.0016 -0.0015
Enugu -0.0013 -0.0013 -0.0012 -0.0011 -0.0009 -0.0009 -0.0007 -0.0007 -0.0008 -0.0010 -0.0014 -0.0015
Owerri -0.0013 -0.0013 -0.0012 -0.0010 -0.0010 -0.0008 -0.0007 -0.0007 -0.0007 -0.0008 -0.0011 -0.0014
Benin-City -0.0014 -0.0014 -0.0012 -0.0010 -0.0009 -0.0007 -0.0006 -0.0005 -0.0006 -0.0008 -0.0011 -0.0014
Calabar -0.0012 -0.0014 -0.0011 -0.0009 -0.0009 -0.0007 -0.0006 -0.0005 -0.0006 -0.0007 -0.0009 -0.0012
PH -0.0014 -0.0015 -0.0011 -0.0009 0.0039 -0.0007 -0.0006 -0.0006 -0.0062 -0.0007 -0.0010 -0.0013
Kaduna -0.0007 -0.0006 -0.0008 -0.0011 -0.0012 -0.0011 -0.0010 -0.0009 -0.0011 -0.0014 -0.0013 -0.0009
Kano -0.0009 -0.0008 -0.0007 -0.0010 -0.0013 -0.0011 -0.0010 -0.0009 -0.0011 -0.0014 -0.0011 -0.0010
Sokoto 0.2667 0.0153 0.3130 0.7745 0.8010 0.6441 0.3501 0.1295 0.4714 1.6127 1.0741 0.7496
Bauchi 0.9135 0.4379 0.5658 1.0874 1.4582 1.2878 1.2128 1.1509 1.3810 1.5373 1.1301 0.9011
Yola -0.0009 -0.0007 -0.0008 -0.0008 -0.0011 -0.0010 -0.0009 -0.0008 -0.0009 -0.0012 -0.0017 -0.0013
Maiduguri -0.0011 -0.0009 -0.0007 -0.0008 -0.0011 -0.0010 -0.0010 -0.0009 -0.0011 -0.0015 -0.0012 -0.0012
Ilorin 0.1895 0.2023 0.1408 0.0248 -0.0011 -0.0037 0.2237 0.1933 0.2409 0.2551 0.3306 0.2823
Minna -0.0006 -0.0005 -0.0009 -0.0011 -0.0010 0.0053 -0.0008 -0.0007 -0.0008 -0.0011 -0.0013 -0.0008
Jos -0.0008 -0.0008 -0.0011 -0.0015 -0.0013 0.0022 -0.0008 -0.0007 -0.0011 -0.0015 -0.0013 0.3427
Ikeja 0.2270 0.2040 0.2455 0.2142 0.2479 0.1369 0.2026 0.2553 0.1431 0.1642 0.1911 0.2047
Ibadan -0.0012 -0.0016 -0.0014 -0.0011 -0.0010 -0.0009 -0.0007 -0.0009 -0.0008 -0.0010 -0.0013 -0.0014
Ondo -0.0013 -0.0015 -0.0013 -0.0010 -0.0009 -0.0008 -0.0006 -0.0006 -0.0007 -0.0009 -0.0012 -0.0013
Table 9: The Computed Mean Absolute Deviation (MAD) of Relative humidity for Comparison of Results Predicted Using Fourier series Models with Results Obtained Directly from Weather Data
January February March April May June July August September October November December
Abuja 1.277 1.638 3.013 2.548 0.823 0.792 0.808 0.845 1.031 1.917 2.779 2.558
Enugu 0.993 3.096 3.084 1.251 0.627 0.633 0.712 0.815 0.735 0.759 0.936 0.846
Owerri 0.883 2.069 1.230 0.508 0.791 1.014 0.940 0.773 1.060 1.044 0.592 1.223
Benin-City 1.737 1.871 1.287 0.904 1.017 1.100 0.820 0.762 1.142 1.389 1.470 1.788
Calabar 1.184 1.701 0.970 0.612 0.512 0.414 0.667 0.560 0.700 0.744 1.062 1.366
PH 1.619 1.526 0.776 0.592 0.918 0.835 0.915 1.088 1.287 1.080 1.197 1.618
Kaduna 1.149 0.955 2.091 2.911 1.211 0.908 0.918 0.916 1.193 0.496 2.425 2.087
Kano 1.315 1.111 0.915 3.502 4.845 2.404 1.446 0.903 1.059 1.622 1.680 1.527
Sokoto 0.681 0.703 0.932 2.282 3.657 3.527 2.570 1.457 1.064 2.020 1.674 1.376
Bauchi 1.879 3.104 2.151 1.945 2.116 1.420 1.213 1.227 1.440 2.080 2.667 2.032
Yola 1.290 0.927 0.870 1.381 1.664 0.795 0.590 0.383 0.523 0.566 1.801 2.207
Maiduguri 1.886 1.749 1.688 1.527 2.108 1.491 0.594 0.874 1.194 1.848 2.422 2.129
Ilorin 5.484 7.113 5.613 2.497 1.490 1.271 1.334 1.320 1.199 1.038 4.166 6.657
Minna 0.641 1.381 3.894 3.825 1.957 1.676 1.329 1.072 0.499 0.706 1.434 1.304
Jos 2.133 1.590 1.698 2.126 3.010 2.669 2.203 2.196 3.242 4.542 5.816 3.712
Ikeja 3.552 3.735 3.317 2.604 2.474 1.403 1.587 1.961 1.921 2.546 3.138 2.981
Ibadan 2.787 4.552 3.221 1.329 0.936 0.848 0.842 0.716 0.896 0.995 1.967 2.705
Table 10: The Computed Mean Absolute Percentage Error (MAPE) of Relative humidity for Comparison of Results Predicted Using Fourier series Models with Results Obtained Directly from Weather Data
January February March April May June July August September October November December
Abuja 3.16 4.60 6.76 4.21 1.20 1.03 0.98 1.01 1.23 2.41 4.45 5.45
Enugu 1.80 5.92 4.97 1.73 0.81 0.79 0.86 0.98 0.88 0.94 1.36 1.32
Owerri 1.37 3.25 1.71 0.66 0.99 1.25 1.11 0.91 1.26 1.29 0.80 1.80
Benin-City 2.64 2.77 1.69 1.12 1.21 1.27 0.93 0.85 1.29 1.62 1.88 2.49
Calabar 1.61 2.26 1.21 0.75 0.62 0.49 0.75 0.62 0.80 0.88 1.29 1.71
PH 2.39 2.18 0.99 0.73 1.14 0.99 1.05 1.25 1.47 1.28 1.47 2.16
Kaduna 4.36 3.98 7.95 6.07 2.00 1.26 1.20 1.16 1.57 0.73 6.53 7.40
Kano 4.64 4.71 4.36 11.29 10.72 4.06 2.06 1.20 1.50 3.14 5.31 4.65
Sokoto 2.72 3.54 4.73 8.06 8.43 6.56 3.82 1.96 1.44 3.90 6.11 4.88
Bauchi 6.07 11.29 8.97 5.22 3.95 2.19 1.58 1.50 1.81 3.40 7.34 6.36
Yola 4.10 3.53 3.52 3.25 2.86 1.11 0.76 0.47 0.64 0.75 3.53 5.65
Maiduguri 7.66 9.02 10.73 6.26 5.61 2.78 0.86 1.10 1.61 3.49 8.64 8.29
Ilorin 12.27 16.48 10.44 3.80 2.02 1.64 1.62 1.60 1.46 1.35 6.59 12.89
Minna 2.12 4.86 10.35 6.93 2.92 2.24 1.64 1.30 0.62 0.94 2.94 3.48
Jos 7.33 5.83 5.28 4.18 4.40 3.33 2.58 2.54 4.06 7.06 15.49 11.33
Ikeja 4.89 5.21 4.45 3.30 3.00 1.60 1.81 2.27 2.20 2.98 3.87 3.90
Ibadan 4.77 7.82 4.67 1.71 1.15 1.02 0.97 0.82 1.05 1.21 2.65 4.10