Speaker Emotion Recognition Using Multiclass
SVM for Evaluating the Best Kernel Functions
and Feature Vector Length to Obtain Optimum
Results
Keerthi R Shastry and A Sreenivasa Murthy
University Visvesvaraya College of Engineering, Bengaluru, India Email: {keerthirshastry, uvceasm}@gmail.com
Abstract—This paper presents an approach for robust automatic recognition of a speaker’s emotional states using a combination of prosody features (i.e. Pitch period, Short time energy and Short time zero crossings), quality feature (i.e. Formant frequencies) and the derived feature (i.e. MFCC -Mel-Frequency Cepstral Coefficients). Multilevel Support Vector Machine classifier is used for identification of four discrete emotional states namely boredom, anger, happy and sad for English language in Indian accent. The database was created by recording speeches of ten selected individuals who spoke sentences in all the four emotions. The experiment was carried out using both one versus all and one versus one methods of classification. The experiment was repeated using various kernel functions and by varying the feature vector length. The experiment aims at finding the kernel (such as linear, Gaussian radial basis function, multi-layer perceptron, polynomial and quadratic functions) and the feature vector length to get optimum results for the classification of each emotion.
Index Terms—prosody features, pitch period, zero crossings, energy, formant frequencies, Mel frequency cepstral coefficients, multi class support vector machine, statistical parameters, kernel functions, feature vector length
I. INTRODUCTION
Speech is the fundamental mode of communication [1] which tells about mental and psychological state of humans, associated with feelings, thoughts and behavior. In the past decades, we have seen intensive progress of speech technology and its applications in the field of robotics, automation and human computer interface. It has helped to gain easy access to information retrieval (e.g. voice-automated call center and voice search) and to access huge volumes of speech information (e.g. document retrieval using speech, speech understanding, and speech translation). In such frameworks, Automatic Speech Emotion Recognition (ASER) plays a major role. ASER aims at automatic identification of different human emotions or mental states through a human’s voice.
Manuscript received August 15, 2018; revised December 17, 2018.
The importance of automatically recognizing emotions from human speech has grown with the increasing applications of speaker emotion recognition in the fields of security, learning, medicine, entertainment, etc. It can act as a feedback system for real life applications in the field of robotics, where robot will follow human commands by understanding the emotional state of human. The successful recognition of emotions will open up new avenues for e-learning system with enhanced facilities in terms of student’s interaction with teaching machines. The idea can be incorporated in entertainment with the development of interesting games with virtual reality experiences. It can also be used in the field of medicine for analysis and diagnosis of cognitive state of a human being. With the advancement of the human-machine interaction technology, a user-friendly interface is becoming even more important for speech-oriented applications.
Besides human facial expressions, speech has proven to be one of the most promising modalities for automatic human emotion recognition. Speech is a spontaneous medium of perceiving emotions which provide in- depth information related to different cognitive states of a human being.
II. DATABASE DESCRIPTION
For this experiment, the speech utterances of various individuals was recorded to create a speech database and named as “English Emotional Speech Database”. Speech utterances were collected from 10 individuals selected randomly from a group of non-professional and first time trained volunteers. These individuals were requested to record speech samples in the emotions/moods of anger, happy, sad and boredom for selective sentences which comprise of a wide range of phonemes. The sentences which comprise of a wide range of phonemes are called pangrams.
III. EXTRACTION OF FEATURES
For recognizing different emotional states, various features of speech have to be considered. For analyzing the speech utterances three prosody features (short term energy, short term zero crossings and pitch period), quality features (first three formant frequencies) and derived feature ( ten Mel frequency cepstral coefficients) were used [1]-[5]. This sums up to 16 features for each frame of the utterances.
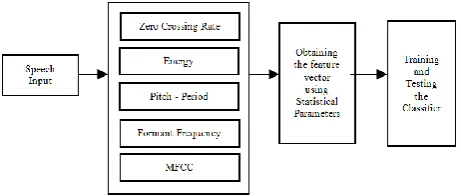
Figure 1. Block diagram describing the flow of the experiment
Fig. 1 illustrates the flow of steps followed during the experiment. Feature extraction is done in order to eliminate the redundancies in the speech signal and hence reduce the data used for analysis. Each speech utterance is divided into frames of 20ms. The speech samples were sampled at the audio sampling frequency [1]. Hence the length of each frame is 441. For each frame 16 features are obtained which are further used in the formation of feature vector. The features were found as mentioned below:
Pitch: It is defined as relative highness or lowness of a tone as perceived by the ear. It depends on the number of times the vocal folds vibrate per second. Pitch period in this experiment is found using autocorrelation function [1]. Energy: Energy represents the loudness of speech. The energy is calculated at every sample and the average is taken over the frame length to get the average energy per each frame [1].
Zero-crossings: A zero crossing is said to occur if the successive samples of a signal have different algebraic signs. The rate at which zero crossings occur is a measure of the frequency content of a signal. Zero-crossing rate is a measure of number of times in a given time interval/frame that the amplitude of the speech signals passes through the value zero. The total number of zero crossings was found for each frame [1].
Formants: The formants define how the air is
modulated as it traverses the vocal tract. The vocal tract acts as a tube whose resonance frequencies are the formant frequencies. These define the quality of every phoneme uttered. Formants are calculated by performing cepstral analysis followed by low time liftering for analyzing the low quefrency portion. The quefrencies corresponding to the first three peaks give the first three formant frequencies.
Mel frequency cepstral coefficients: MFCCs are found by taking the fast Fourier transform and transforming to the Mel scale. Now log followed by discrete cosine
window gives the value of the corresponding MFC coefficient.
A. Feature Vector Formation Using Statistical
Parameters
Now we have 16 features from each frame and each signal has several frames of frame length 441. To compare the various utterances we need a common parameter between each utterance. Hence we use statistical parameters [5]-[7] namely,
Mean
Minimum
Maximum
Standard deviation
Hence for each utterance we have a feature vector of length 64 which is used for training the classifier.
IV. CLASSIFICATION USING SUPPORT VECTOR MACHINE (SVM)
Support Vector Machine [8] is a supervised method of classification used for binary classification with associated learning algorithms that analyze data used for classification. An SVM model is a representation of the examples as points in space, mapped so that the examples of the separate categories are divided by a clear gap that is as wide as possible. In addition to performing linear classification, SVMs can efficiently perform a non-linear classification using what is called the kernel trick, which maps the inputs into another feature space which eases the classification [7], [9].
A. Multiclass Classification Using SVM
Support Vector Machine is a binary classifier and we need to classify the input speech utterances into four different emotions viz. boredom, anger, happy and sad.
We implement multiclass SVM classifier by using either one versus one or one versus all methods at a time.
In one versus all method, one SVM is built for each emotion. Each machine gives an output telling if the speech signal belongs to that particular emotion or not.
The drawback of this method is that more than one machine can give positive result for a given input. While in one versus one method, all the input speech signals are classified into one of the four categories unlike one versus all method.
B. Using Kernel Functions for Classification
In SVM all the data cannot be classified using a linear classifier and also there will be a few outliers which will be ignored. For such data a different technique is used which is called the kernel trick in which the data points are transformed into a different dimension in which they can be classified by a linear classifier. The various kernels used in our experiment are mlp (multi-layer perceptron), Gaussian radial basis function, polynomial and quadratic functions [7].
C. Need for Regulation of Feature Vector Length
repeated in various features. As a result of this even if we reduce the number of features we get the same efficiency. Hence we can reduce the number of features and still get the same efficiency of emotion classification [6].
V. EXPERIMENTAL RESULTS AND ANALYSIS
In this experiment speaker emotion recognition is achieved using short time zero crossing, short time energy, pitch period, formant frequencies and Mel frequency cepstral coefficients as features to analyse the speech and Support vector machine for classification of four emotions, namely, boredom, anger, happy and sad. The experiment was conducted using variable feature vector lengths and different kernels in SVM to determine the best method (one versus one or one versus all), kernel (linear, multi-layer perceptions, Gaussian radial basis function, polynomial and quadratic) and the feature vector length that is needed to achieve optimum results of classification. The features used are in the following order: zero crossings, pitch period, energy, and first three formants in order followed by ten MFC coefficients (In the order of 1 to 10).
The feature vector length was changed by choosing the various features in the order mentioned above. This means a feature vector length of 10 includes the statistical parameters of zero crossings, pitch period, energy, first three formants and the first four MFC coefficients. The SVM toolbox in MATLAB with built-in kernel functions is used. The optimized parameter setting for SVM is based on sequential minimization optimization (SMO) applied on the training set.
The experiment was conducted in one versus one and one versus all methods. The classification was done using different feature vector lengths (from using a single feature to using all 16 features) and using different kernels in both one versus one and one versus all methods. The average of the efficiencies obtained for each kernel was taken to evaluate the length of the feature vector which gives best results.
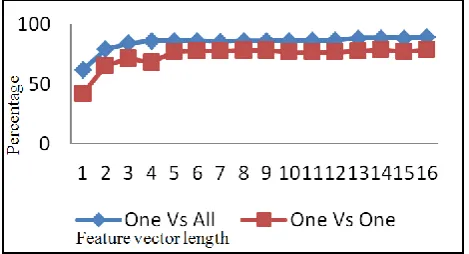
From the graphs (Fig. 2, Fig. 3, Fig. 4, Fig. 5) we can conclude that one versus all method gives better results when compared to one versus one method for speaker emotion recognition.
Figure 2. Comparison of one versus one and one versus all methods for the emotion boredom
Figure 3. Comparison of one versus one and one versus all methods for the emotion anger
Figure 4. Comparison of one versus one and one versus all methods for the emotion happy
Figure 5. Comparison of one versus one and one versus all methods for the emotion sadness
Hence the further analysis will be done only for one versus all methods. For the emotion boredom, the feature vector length of 13 has the highest average of 88.46% which remains constant for the higher feature vector lengths, for the emotion anger, the feature vector length of 11 gives a highest average efficiency of 90%, for the emotion happy, feature vector length of 5 gives the highest average efficiency of 89.2% and for the emotion sad, the feature vector length 13 gives the highest average efficiency.
The confusion matrix of the emotions and the various kernel functions is as follows:
TABLE I. CONFUSION MATRIX OF THE EMOTIONS AND THE VARIOUS
KERNEL FUNCTIONS
Emotion linear rbf mlp poly quad
Boredom
(l = 13) 90.4 100 51.92 100 100 Anger
(l = 11) 96 100 54 100 100
Happy
(l = 5) 96 100 50 100 100
Sadness
(l = 13) 92 100 54 100 100
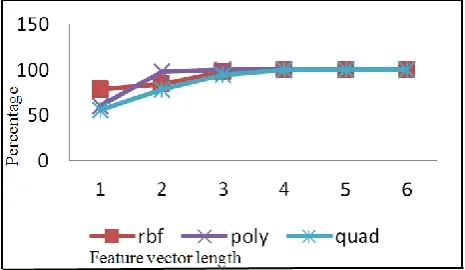
Table I tells that rbf, polynomial and quadratic function Kernels perform better than the other Kernels. For all the four emotions, these Kernels give an efficiency of 100% for the classification.
Consider the emotion boredom. The plot below gives a comparison of the performances of the rbf, polynomial and quadratic kernel functions for the emotion boredom.
Figure 6. Comparison of the kernel functions for the emotion boredom
It can be seen in Fig. 6 that for the feature vector lengths of 5 and more the efficiencies of all the three kernel functions are same. Hence this signifies that the first four features viz. zero crossings, pitch period, energy, first and second formant frequencies play an important role in the classification of the emotion boredom.
Consider the emotion anger. The plot below depicts the comparison three kernel functions for the classification of anger.
Figure 7. Comparison of the kernel functions for the emotion anger
Fig. 7 signifies that the feature vector length of 4 comprising of zero crossings, pitch period, energy and the
anger. These are the minimum number of features required for efficient classification of anger.
The plot below depicts the comparison of the three kernel functions for the classification of the emotion happy.
Figure 8. Comparison of the kernel functions for the emotion happy
From Fig. 8 we can analyze that zero crossings and pitch period play an important role in the classification of happy i.e. a feature vector length of 2 is the minimum requirement for the efficient classification of the emotion happy.
Similarly for the emotion sadness, Fig. 9 depicts that the minimum number of features required for the classification is 4 which comprise of zero crossings, pitch period, energy and the first formant frequency. Hence these features play an important role in the classification of the emotion sadness.
Figure 9. Comparison of the kernel functions for the emotion sadness
VI. CONCLUSION
In this experiment speaker emotion classification is achieved by using multiclass SVM. The experiment was conducted using variable feature vector lengths and different kernels in SVM to determine the best method, kernel and the feature vector length that is needed for best results of classification for each emotion.
the other hand gives an efficiency of 90-95% based on the emotion classified.
For the classification of boredom, anger, happy and sad, feature vector lengths of 5, 4, 2 and 4 respectively, are the minimum number of features required for efficient classification. The features zero crossings, pitch period, energy and the first two formant frequencies play an important role in the classification of emotions when quadratic, polynomial and rbf kernels are used.
A trade-off between the length of the feature vector and the efficiency of the emotion classification by ±1% will reduce the amount of data required for efficient classification. Hence based on the application and the accuracy of the classification needed, the length of the feature vector can be chosen.
It should be noted that the analysis and results obtained are database dependent and hence vary for different databases.
REFERENCES
[1] L. R. Rabiner and R. W. Schafer, “Introduction to digital speech processing,” Foundations & Trends in Signal Processing, vol. 1, no. 1, 2007.
[2] K. S. Rao, S. G. Koolagudi, and R. R. Vempada, “Emotion recognition from speech using global and local prosodic features,” Int. J. Speech Technol., vol. 16, no. 2, pp. 143-160, Aug. 2012. [3] M. Lee, S. Member, S. S. Narayanan, and S. Member, “Toward
detecting emotions in spoken dialogs,” IEEE Transactions on Speech & Audio Processing, vol. 13, no. 2, pp. 293-303, 2005. [4] D. Ververidis and C. Kotropoulos, “Emotional speech recognition:
Resources, features, and methods,” Speech Commun., vol. 48, no. 9, pp. 1162-1181, Sep. 2006.
[5] M. Borchert and A. Dusterhoft, “Emotions in speech - Experiments with prosody and quality features in speech for use in categorical and dimensional emotion recognition environments,” in Proc.Int. Conf. Nat. Lang. Process. Knowl. Eng., 2005, pp. 147-151.
[6] I. Luengo and E. Navas, “Automatic emotion recognition using prosodic parameters,” in Proc. INTERSPEECH, 2005, pp. 493-496.
[7] N. Yang, R. Muraleedharan, J. Kohl, I. Demirkol, and W. Heinzelman, “Speech-based emotion classification using multiclass SVM with hybrid kernel and thresholding fusion,” in
Proc. IEEE Spoken Language Technology Workshop, 2012, pp.
455-460.
[8] D. Fradkin and I. Muchnik, “Support vector machines for classification,” Series in Discrete Mathematics and Theoretical Computer Science, Tech. Rep., pp. 1-9, 2006.
[9] R. P. Gadhe, et al., “Emotion recognition from speech: A survey,” International Journal of Scientific & Engineering Research, vol. 6, no. 4, April 2015.
Dr. A Sreenivasa Murthy received a PhD from the Indian Institute of Science, Bengaluru ,India for his work on “Non-stationary Speech Analysis and enhancement,” in Dec’08. His major fields of study are speech signal processing and image processing. He is currently working as Associate Professor at University Visvesvaraya College of Engineering, Bengaluru, India. His paper presentations and publications include “CDFIR: Cumulative distribution function based Image Retrieval,” at TENCON, Malaysia Nov. 2017, “Comparison of Speech Enhancement Algorithms,” in IMCIP 2016, “VHDL implementation of fast & efficient algorithm,” IJACR, vol. 3, no. 3 issue 12, Sept. 2013 and “Robust speech recognition system designed by combining empirical mode decomposition & a genetic algorithm,” IJERT, vol. 2, issue 9, Sept. 2013.
Dr. Murthy is an IEEE member.