Rock type classification by image analysis using the
quaternion colour extraction model and support
vector machine classifier
Sumanta Das1 and Malini Roy Choudhury2 1-2
Department of Civil Engineering, MEFGI, Gujarat Technological University, Rajkot-360003, Gujarat, India Corresponding author: E-mail: [email protected], Tel: +917359312527
In mineral processing plants it is important to estimate rock composition, size and grindability to improve control of the grinding process. This paper proposes a new method and extends a general remote sensing approach for estimation of rock type estimation using colour information. Our proposed method requires the division of each image into sub-images using the Binary Quaternion-Moment-Preserving (BQMP) for colour feature extraction and support vector machines (SVM) for classification. The colour feature extraction BQMP method splits the image in two and chooses representatives of each half using the histogram as features. Once the feature vector has been computed, each vector is assigned to one of the classes using a classifier. The method was tested on two databases. The first one, contains images from rocks obtained from a nickel mine with three classes and the second database contains images from rocks obtained from a copper mine in India with seven rock types. The classification accuracy was compared based on a mixture of wavelet texture analysis (WTA) for texture feature extraction and principal components analysis (PCA) for colour features. WTA-PCA approach reached 78.8% accuracy in the test set of the first database and 69.3% with the second database, while BQMP method reached 93.05% and 91.8% of classification accuracy respectively.
Keywords: Rock and lithological classification, grindability estimation, BQMP features extraction, SVM, colour features.
INTRODUCTION
In mining industry, the problem of rock classification plays a crucial role at different stages of the extractive process ranging from the design of the mine to mineral grading and plant control (Longhi et al., 2001, Chatterjee et al., 2010b, 2012; Kose et al., 2012, Perez et al., 2011b). Remote characterization of the rocks of an ore deposit could be useful in the selection of the required equipment for excavation, the strategies for blasting, and others. Remote sensing and tracking of ore variations in composition, size and grindability is important to reduce power consumption and improve mills throughput (Perez et al., 2011b; Tessier et al., 2007).
New developments in remote sensing have made possible to improve geological mapping and rock lithological classification. Several methods have been previously proposed for this task, e.g., Kohonen self-organizing maps in spectrometry (Bedini, 2012) or integration of hyperspectral visible and near-infrared, short-wave infrared with multispectral thermal infrared (Chen et al., 2010). Nair and Mathew (2012) employed the Advanced Spaceborne Thermal Emission and Reflection Radiometer (ASTER) image for lithological mapping. Feng et al., (2011) used the continuum wavelet transform in thermal infrared spectra.
Rock lithological classification in the visible range requires several steps such as colour and texture feature extraction (Andersson et al., 2012, Bianconi et al., 2012, Perez et al., 2012, Shang and Barnes 2012, Tessier et al., 2007) and a classification stage which can be accomplished using Support Vector Machines (SVM) (Cortes and Vapnik 1995, Perez et al., 2012, Shang and Barnes 2012, Tessier et al., 2007).
Vol. 1(1), pp. 002-009, March, 2014. © www.premierpublishers.org.ISSN: 0767-0974x
Remote sensing systems have been developed for several mining operations such as online inspection of crushed aggregates (Al-batah et al., 2009), online ore sorting and classification (Casali et al., 2001, Chatterjee et al., 2010a, 2010b, 2012; Guyot et al., 2004, Perez et al., 1999, Singh et al., 2006, Singh et al., 2010, Tessier et al., 2007). A Remote Sensing approach was proposed for Casali et al., (2001), where five lithological classes were classified using colour, geometric and texture features. A feature selection procedure was performed using a genetic algorithm, and the classification was performed by a neural network. Another approach was proposed by Tessier et al., (2007) in which colour features were extracted using principal components analysis (PCA) whereas texture features were quantified using both wavelet texture analysis (WTA) and gray level co-occurrence matrices (GLCM). Later in Perez et al., (2011b) we improved the results adding a voting method for sub-images included within each rock boundary obtaining improved results.
A moment-preserving thresholding technique called binary quaternion-moment preserving (BQMP) thresholding developed by Pei and Cheng (1999) can be used as a tool for colour feature extraction by expressing the input colour space as a quaternion valued space. In this paper, we present a new method for remote feature extraction using BQMP thresholding technique to extract colour features from rock sub-images. We tested our method using part of a database presented in Tessier et al., (2007) and Perez et al., (2012) from a nickel mine and other another database from a copper mine with 7 rock types. In both cases we used a SVM as a classifier.
METHODS
The proposed method for remote rock classification includes the image subdivision and background removal, the colour feature extraction with the BQMP thresholding technique, and support vector machine (SVM) for classification.
Image division
The image subdivision is performed using the same procedure proposed in Tessier et al., (2007), and in Perez et al., (2011b, 2012). In the case of the nickel mine database (Tessier et al., 2007), the images of 1,024 x 1,376 pixels are divided into 512 sub-images of 64x43 pixels. Each sub-image is considered the main processing unit. Figure 1(a) shows an example from the database of the peridotite type and Fig. 1(b) shows examples of 512 sub-images after image division and background removal from several images as the one shown in (a). The second database is composed of digital images taken from rocks extracted from a copper mine where each image is of 640x480 pixels. Each image was divided into 128 Sub images of 60x40 pixels. Figure 1(c) shows an example from this database of the Andesita rock type and Fig. 1(d) shows examples of 128 sub images after image division and background removal.
(c) (d)
Figure 1.Image of peridotite rocks (1,024x1,376 pixels) over the conveyor belt from a nickel mine. (b) Composed training image with 512 sub-images of 64x43 after background removal. (c) Image of Andesite rocks (640x480) from a copper mine over the conveyor belt. (d) Composed training image with 128 sub-images after background removal.
Background removal
The training and test set in both databases were generated eliminating background and rock edges. The background removal is performed using the watershed transform (Beucher and Lantuejoul, 1979) to create border maps with the background and boundaries as was explained in (Chatterjee, 2012, Perez et al., 2011b). The watershed transform is a segmentation method based on mathematical morphology, using a region based segmentation approach. The watershed transform is based on the idea of a landscape or topographic relief which is flooded by water (Roerdink et al., 2001). With this conception water serves as a boundary to segment the image (Roerdink et al., 2001), i.e., many small basins are produced due to many local minima in the image. In our application we used a marker-based approach, trying to find good seeds for initializing the watershed transform. The initial seeds were generated using morphological operations using a smoothing kernel of size 5x5 pixels, opening by reconstruction, closing by reconstruction and regional maxima. Once the seeds were created, the watershed transform was applied on the image using the seeds as the markers. Once the border map is obtained, blobs are defined as areas in the image that fall within a closed loop. A threshold is applied for discarding background and borders sub-images using the number of edge pixels in the sub-images.
Colour feature extraction
The BQMP method (Pei and Cheng 1999), uses the statistical parameters of colour data represented in a quaternion valued data set Q made from the RGB data from a sub image. Each quaternion number can be defined as:
(1) where i, j and k are as follows:
(2) The conjugate of a quaternion is defined as:
(3)
A colour value {R, G, B} can be treated as a quaternion with q1 = R, q2 = G, q3 = B and q0 = 0. Based on the definition of the quaternion, the first three orders of quaternion moments are defined as:
(4) where E() represents the expectation. Equation (4) can be expressed as:
(5)
Figure 2. Thresholding of hyper-plane used in the BQMP method to split the quaternion space in two halves. (a) Computation of representative values z_0 and z_1. (b) Hyperplane threshold to separate into two classes.
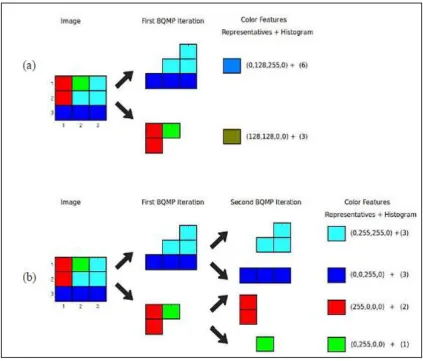
The process is repeated recursively and the resultant partitioning of Q will exhibit the structure of a binary tree. In this case, the features are first the representative values and then the number of pixels that are represented by z0 and z1. Fig 3 shows an example of the feature vector in BQMP thresholding method for (a) the case of 4 colours and 1 depth level, and Fig 3(b) shows the case of 4 colours represented with a quaternion model with depth of 2.
Figure 3. First BQMP iteration example for the case of 4 different colours. Numbers show the colour coded in (q1, q2, q3, q4) and the number of pixels for each colour representative. (b) Second BQMP iteration example for the case of four different colours.
Classification
A feature vector of size forty is generated using the BQMP thresholding method with a depth of three, thus generating four pairs and representative values. The first eight features are the number of pixels represented by each of the z, and the next thirty two features (8x4) are each of the four scalars that compose those eight z representative values. Once the feature vector has been computed, each vector is assigned to one of three classes using a classifier. For the classification purpose, we employed the Support Vector Machine (SVM) as a classifier. The SVM has become very popular within the machine learning community due to its great classification potential (Meyer et al., 2003). The SVM maps input vectors in a non-linear transformation to a high-dimensional space where a linear decision hyper-plane is constructed for class separation. A Gaussian SVM kernel was used and a coarse exhaustive search over the remaining SVM parameters was used to find the optimal configuration. A refined search was performed to get a better configuration of the final SVM parameters (Cortes and Vapnik, 1995).
The final step for the remote classification of each rock is to use a voting among all sub-images that fall within the boundary of the rock. It is assumed that all sub-images within each rock boundary belong to the same class. In this way all sub-images vote for the class they belong to and the rock class is the one with the most sub-image vote.
Databases and Experiments
For the first experiment we use a database with five types of rocks previously used in Tessier et al., (2007). In this database, images from a nickel mine were acquired using 1024x1376 pixels per image. The five ore types were massive sulphide (MS), disseminated sulphide (DS), net textured (NT), gabbro (G) and peridotite (P). These five classes were divided according to rock grindability into 3 classes. MS is assigned to the soft class, DS and NT to the medium class and G and P to the hard class. Each digital image was divided into 512 sub-images of 64x43 pixels. Each sub-image captures the relevant colour and texture features of the rock. In the subsequent steps, the main processing unit is the sub-image. In this paper we use 498 “Pure Images” (249 dry and 249 wet) with only one rock type per image. Each image was partitioned in 512 sub-images as described before. From the Pure Images, 90 dry rock images and 90 wet rock images were built with 512 random pure sub-images of the same type, eliminating background and rock edges. Nine dry rock images subsets and nine wet rock images subsets were created, each one composed of two images of each of the five rock types resulting in a total of 5,120 sub-images (10 images with 512 sub-images in each subset). The experiment was conducted to measure the accuracy of the classifier. For this purpose, 5 subsets for training and 4 subsets for testing were used in each case (dry or wet). A five-fold cross-validation was used on the training subsets in order to find the best parameters for SVMs.
A second experiment was performed using a database from a copper mine in India (Casali et al., 2001, Perez et al., 1999). This database is composed of seven different types of rocks: Andesite (AN), Turmaline Breccia (BxT), Dacitic Diatreme (CHDA), Riolotic Diatreme (CHRiol), Porphyritic Dykes (PDL), Granodiorites (GDCC) and Other Breccias (BxTo). The database contains 420 digital images, each one showing between 20 and 40 rocks, in BMP format of 640 x 480 pixels. A total of 168 images were used in the training set without background (24 images for each rock type), and 252 images were used in the test set (36 images for each rock type).
Results are compared with a Wavelet PCA feature extraction method previously published in Tessier et al., (2007). Wavelets extract texture features, and PCA extracts colour features. A feature selection method based on Mutual Information was used to select 14 features from 36 (30 wavelets and 6 PCA). The classifier is also based on SVM, but instead of using only one classifier, a cascade with three classifiers on first layer and one classifier on a second layer is used. The use of a two layer classifier implies the use of double number of samples for training. One half of the samples were used to train the first layer, and the second half to train the second layer. Therefore, three training partitions are described.
RESULTS AND DISCUSSION
Table 1. Classification results for dry images using Wavelet PCA features for the first experiment.
Table 2. Classification results for dry images using BQMP features for the first experiment.
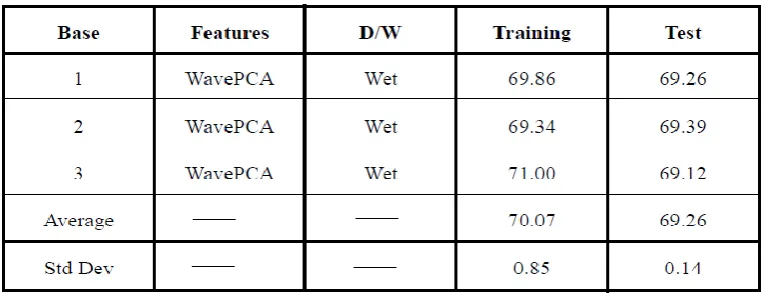
Table 3 shows the classification results for wet images using Wavelet-PCA features. The average accuracy for the three sets used in the test database reached 69.26%. Table 4 shows the classification results for wet images using our proposed BQMP features. It can be observed that the average classification result reached 89.22% on wet rocks which is almost a 20% improvement on the classification accuracy of our proposed method. Table 4 also shows the standard deviations measured for the five testing sets and was 0.10% which means that each partition is well represented by the training set. The results on wet images may be important in cases where the dust covering the rocks could be removed by water. Comparing dry and wet rocks results, it can be observed that for the Wavelet-PCA method classification accuracy on the testing set for dry rocks is 9.6% over that of the wet rocks. For the case of our proposed BQMP method, the classification accuracy of dry rocks was 2.6% better than that of wet rocks. In practical applications there are several kilometers of conveyor belts transporting material to the mills and therefore, the use of water to remove dust from the rocks surface is possible. Water could be poured on the rocks only during a short period of time enough to take sample images. Also, image acquisition could be performed far away after rocks have become dry.
Table 3. Classification results for wet images using Wavelet PCA features.
Table 4: Classification results for wet images using BQMP features
.
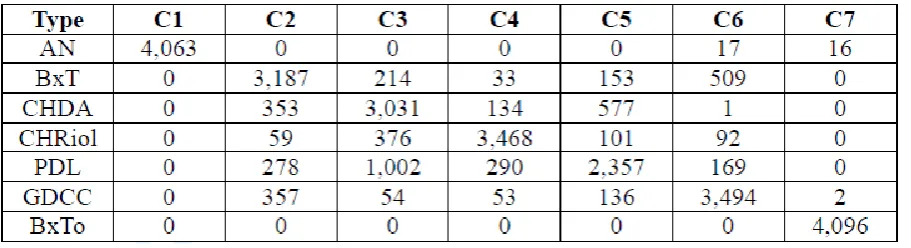
Table 5 and 6 show the confusion matrix for the copper mine database for the training and testing set, respectively. It can be observed that the worse classification accuracy is reached for the Porphyritic Dykes (fifth class), in both training and testing sets.
Table 5. Train Confusion matrix for the copper mine database with 7 classes using our proposed BQMP method for the training set.
Table 6. Test Confusion matrix for the copper mine database with 7 classes using our proposed BQMP method for the test set.
Table 7. Overall classification accuracy for the copper mine database using our proposed method BQMP and the Wavelet PCA method.
Conclusion and Recommendations
A new remote rock classification method based on BQMP colour features was presented. The method was assessed using two databases; one from a Nickel mine in India used previously (Tessier et al., 2007, Perez et al., 2011b), and a second one from a Copper mine with seven rock type classes. Results show significantly good performance of our proposed method BQMP on both databases. The average measured improvements on the test set were 12.9% on the dry (and 19.9% on the wet) of the Nickel mine database and 17.5% in the Copper mine database. The performance was 9.1% lower on the Copper mine database relative to the Nickel mine database. This result may be explained because the Copper mine database has 7 different rock type classes while the Nickel mine data base was grouped into 3 different classes according to rock grindability. Therefore the classification problem is much more difficult on the Copper mine database. The importance of remote ore sorting has been explained in many previous publications but we want to emphasize that the proposed method could be used to optimize the mill operation having remote information about the rock grindability that is being fed into the mill. The proposed method could also be trained to identify other types of rocks or minerals.
Abbreviations
BQMP: Binary Quaternion Moment Preserving. SVM: Support Vector Machines. WTA: Wavelet Texture Analysis. GLCM: Gray Level Co-occurrence Matrices.
ACKNOWLEDGEMENTS
We express our gratefulness to the Geological Survey of India, Kolkata for providing us part of the rock database, We are also thankful to Prof. Subhasish Das from IIT, Kharagpur (Dept. of Geology and Geophysics) for his endless support. Our gratitude also goes to the entire team of Departments of Civil Engineering, MEFGI(Gujarat Technological University) and Dept. of Civil Engg. of SRM University, Kattankulathur, India.
REFERENCES
Al-Batah M S, Isa NA, M, Zamli KZ, Sani ZM, Azizli, K A (2009). A novel aggregate classification technique using moment invariants and cascaded multilayered perceptron network. Int. J. Mineral Processing, 92(1-2):92-102. Andersson T, Thurley M, Carlson J (2012). A machine vision system for estimation of size distributions by weight of limestone particles. Minerals Engineering 25, pp. 38–46.
Bedini E (2012). Mapping alteration minerals at Malmbjerg molybdenum deposit, central East Greenland, by Kohonen self-organizing maps and matched filter analysis of HyMap data, International Journal of Remote Sensing, 33(4):939-961.
Beucher S, Lantuejoul C (1979). Use of watersheds in contour detection. International Workshop on Image Processing, Real-Time Edge and Motion Detection/Estimation, Rennes, pp.17–21.
Bianconi F, Gonzalez E, Fernandez A, Saetta SA (2012). Automatic classification of granite tiles through colour and texture features. Expert Systems with Applications 39, 11212–11218.
Casali A, Gonzalez G, Vallebuona G, Perez C, Vargas R (2001). Grindability soft-sensors based on lithological composition and on-line measurements. Minerals Engineering, 14(7):689-700.
Chatterjee S, Bandopadhyay S, Machuca D (2010a). Ore Grade Prediction Using a Genetic Algorithm and Clustering Based Ensemble Neural Network Model. Mathematical Geosciences, 42(3):309-326.
Chatterjee S, Bhattacharjee A, Samanta B, Pa, SK (2010b). Image-based quality monitoring system of limestone ore grades. Computers in Industry, 16(5):391-408.
Chatterjee S (2012). Vision-based rock-type classification of limestone using multi-class support vector machine. Applied Intelligence, pp. 1-14.
Chen X, Warner, TA, Campagna DJ (2010). Integrating visible, near-infrared and short-wave infrared hyperspectral and multispectral thermal imagery for geological mapping at Cuprite, Nevada: a rule-based system, Int. J. Remote Sensing, 31(7):1733-1752.
Cortes C, Vapnik V (1995). Support-Vector Networks. Machine Learning, 20(3):273-297.
Feng J, Rivard B, Gallie A, Sanchez-Azofeifa A (2011). Rock type classification of drill core using continuous wavelet analysis applied to thermal infrared reflectance spectra, Int J. Remote Sensing, 32(16):4489-4510.
Guyot O, Monredon T, Larosa D, Broussaud A (2004). Visio Rock, an integrated vision technology for advanced control of communication circuits. Minerals Engineering, 17(11-12)1227-1235.
Kose C, Alp I, Ikibas C (2012). Statistical methods for segmentation and quantification of minerals in ore microscopy. Minerals Engineering 30, pp 19–32.
Longhi I, Sgavetti M, Chiari R, Mazzoli C (2001). Spectral analysis and classification of metamorphic rocks from laboratory reflectance spectra in the 0.4-2.5 µm interval: a tool for hyperspectral data interpretation, Int. J. Remote Sensing, 22(18):3763-3782.
Meyer D, Leisch F, Hornik K (2003). The support vector machine under test. Neuro computing, 55(1-2):169-186. Nair A, Mathew G (2012). Lithological discrimination of the Phenaimata felsic-mafic complex, Gujarat, India, using the Advanced Spaceborne Thermal Emission and Reflection Radiometer (ASTER), Int. J. Remote Sensing, 33(1):198-219.
Pei S, Cheng C (1999). Color image processing by using binary quaternion-moment preserving thresholding-technique. IEEE Transactions on Image Processing, 8(5):614-628.
Perez C, Casali A, Gonzalez, G, Vallebuona, G, Vargas R (1999). Lithological composition sensor based on digital image feature extraction, genetic selection of features and neural classification, ICIIS´99, Proc. 1999 IEEE International Conference on Information Intelligence and Systems, Bethesda, MD, Oct.31-Nov.3, pp. 236-241. Perez CA, Aravena CM, Vallejos JI, Estevez PA, Held CM (2010). Face and iris localization using templates designed by particle swarm optimization. Pattern Recognition Letters, 31(9):857-868.
Perez CA, Cament LA, Castillo LE (2011a). Methodological improvement on local Gabor face recognition based on feature selection and enhanced Borda count. Pattern Recognition, 44(4):951–963.
Perez CA, Estevez PA, Vera P, Castillo LE, Aravena CM, Schulz DA, Medina LE (2011b). Ore grade estimation by feature selection and voting using boundary detection in digital image analysis, Int. J. Mineral Processing, 101 (1-4):28-36.
Perez C, Navarro C, Vera P, Schulz D, Castillo L, Saravia J (2012). Rock Grindability Estimation based on the Quaternion Color Extraction Model. XXVI International Mineral Processing Congress (IMPC 2012) September 24 – 28, pp.4198-4204.
Roerdink Jbtm, Meijster, A (2001). The watershed transform: definitions, algorithms and parallelization. Fundam Informaticae, 41, pp.187–228
Shang C, Barnes D (2012). Support Vector Machine-Based Classification of Rock Texture Images Aided by Efficient Feature Selection. WCCI 2012 IEEE World Congress on Computational Intelligence, June, 10-15, Brisbane, Australia. pp 1-8.
Singh V, Rao S (2006). Application of image processing in mineral industry: a case study of ferruginous manganese ores. Mineral Processing and Extractive Metallurgy, 115(3):155-160.
Singh N, Singh TN, Tiwari A, Sarkar KM (2010). Textural identification of basaltic rock mass using image processing and neural network. Computational Geosciences, 14(2), pp.301-310.
Tessier J, Duchesne C, Bartolacci G (2007). A machine vision approach to online estimation of run-of-mine ore composition on conveyor belts. Minerals Engineering, 20(12):1129-1144.
Accepted 14 April, 2014.
Citation: Das S, Choudhury MR (2014). Rock type classification by image analysis using the quaternion colour extraction model and support vector machine classifier. J. Oil Gas Coal Engin. 1(1): 002-009.