MODELLING OF RESPONSES FROM ORTHOGONAL METAL CUTTING OF MILD
STEEL USING CARBIDE INSERT TOOL
M. K. Onifade
1,*, A. C. Igboanugo
2and J. O. Osarenmwinda
31
D
EPARTMENT OFM
ANAGEMENTT
ECHNOLOGY,
B
ELLSU
NIVERSITY OFT
ECHNOLOGY,
O
TA,
O
GUNS
TATE.
NIGERIA.
2,3
D
EPARTMENT OFP
RODUCTIONE
NGINEERING,
U
NIVERSITY OFB
ENIN,
B
ENINC
ITY,
E
DOS
TATE.
NIGERIA.
Email addresses:
1[email protected],
2[email protected],
3[email protected]
ABSTRACT
The purpose of this research was to develop models for the prediction of responses from orthogonal metal cutting process that are responsible for the machinability ratings of this technological system. Mild steel work-piece material that is representative sample for various industrial applications was machined. The various industrial applications of this representative sample range from mechanical shafts to fasteners, screws and hydraulic jack. These machine elements require high degree of surface finish. A fifteen-run based Box-Behnken response surface design was created using widely established machining parameters, namely cutting speed, feed rate and depth of cut. The optimum predicted responses from the orthogonal cutting process for the optimal process parameters are 0.1742 micron, 0.4933 micron, 0.1845 micron, 0.3673 micron, 794.6839 seconds and 19.642 seconds for the Ra, Rz, Rq, Rt, TL and M/C time respectively. The associated desirabilities for these optimum responses are 1.000000, 1.000000, 1.000000, 1.000000, 0.524122, and 0.361858 respectively.
Keywords: Orthogonal cutting; surface roughness; tool life; machining time; Box-Behnken design.
Nomenclature, Symbols and Notations
Ra: Arithmetic average of absolute values
Rz: Average distance between highest peak and lowest valley in each length
Rq: Root mean squared
Rt: Maximum height of the profile TL: Tool Life
M/ctime: Machining time
MmPM: Feed Rate in Millimetres per minute L: Cutting length in millimetres
mmPR: feed rate in millimetres per revolution
1. INTRODUCTION
Metal cutting processes are governed by information available in machining databases or specialised handbooks. These sources are normally updated by qualified machinists and experienced professionals through the findings of machining optimisation research. Multi-objective optimisation techniques have been widely applied to cost and cutting parameters specific situations and many of them addressed economic rather than technological constraints in metal cutting. Prediction of responses from orthogonal metal cutting process provides information for the specified operations which in-turn serves as control medium for
the prevention of in-process tool failure, and deviations from specified surface roughness of machined work-piece: machine tools are often damaged by in-process tool breakage while deviations from specified surface roughness lead to sudden failure of produced machine elements. Responses from orthogonal metal cutting process are difficult concept to pin down and are largely qualitative, therefore, only the expert operator can evaluate the condition of the edges and surfaces of the tool, and chatter on machined work-piece. Thus, they cannot be considered as physical variables whose values may be found by any mathematical method. Nevertheless, some indexes can be established based on some measurable parameters, whose measurement will fully match with human criteria [1]. The pioneer attempt in this direction was made by [2] in which tool life was related to cutting speed, experimental index, and a constant. Also, specific developments have been achieved in the prediction of surface roughness of machined work-piece. The demand for machining accuracy has increased over the years and this affects the quality of the product and the associated processes. The primary machining processes that are carried out, during production, and manufacturing include hard turning and milling operations. Turning is an old technological machining
Print ISSN: 0331-8443, Electronic ISSN: 2467-8821 www.nijotech.com
operation which was first developed by Leonardo da Vinci in the 1500s. Also, the precision hard turning is more attractive to manufacturing industry because of its relatively high material removal rate and flexibility [3]. Surface finish of produced machine elements are pre-determined during the machining operation unlike that of structural members which can be attained using secondary operations.
Now that the Nigerian government has refocused on the re-establishment of competitive manufacturing industry, there is need to determine the optimal machining guidelines for operators of the machine tools needful for production. The technical partners could have an agreement to build, operate and transfer the facilities after a specified period of time, the indigenous research engineers have to carry out various experimental research trials that would enable local practitioners sustain the industry in the nearest future. The experiences on previous establishments such as Ajaokuta and Delta Steel Companies show that the level of technology transfer from technical partners to indigenous operators was very poor, and this could still be further experienced. According to [4] in an interview conducted, “no country can industrialise without a proper machine tool industry”. There is no way a proper machine tool industry can be attained without continuous efforts towards optimisation of the machining operations. It is in the light of this that this research attempts a development of models that can be used to monitor responses from orthogonal metal cutting processes, with a view to improving machining processes and conditions. The efforts toward the development of models that describe the major responses from orthogonal metal cutting process which can be easily implemented in a real workshop situation can be dated as far back as 1907. Studies have shown that some of the existing mathematical models postulated for this purpose are mostly theoretical formulations; others that were developed by Response Surface Methodology (RSM) and Expert System Techniques (EST) have some limitations by adopting the process parameters’ dimensions without carrying out adequate dimensional analysis to convert all their units to International Standard (S. I.) form before carrying out the formulations that resulted into their establishment. Of particular references are the works of [5, 6, 7, 8]. In-process tool condition monitoring systems are now being employed in adaptive control of machining operations. The experimental set-up for this is quite expensive and cannot be easily deployed in most of the workshops existing in developing economies. Processes in the engineering industry are defined by standards, mainly developed by the International Standard Organisation (ISO). These standards carefully describe procedures for
technical sciences which are shaped by local operating conditions. These conditions are normally due to the status of the country where the manufacturing operations are carried out, and moreover, most nations did not experience industrial revolution, they only adopted technologies from industrialised ones.[9] carried out a study of effects of machining three various materials, medium carbon steel, mild steel and brass. Three different tool types namely, HSS, tungsten carbide and carbide insert were deployed for the operation carried out on a lathe machine. The experimental procedure indicated that a tape rule model Fat Max Blade Armor 35’ was used to measure the total cutting length a tool will cut effectively and this was incorporated to feed rate in determining tool life. The work employed the spindle speed instead of the cutting speed in the orthogonal array developed for the Taguchi analysis carried out and this prevented the model from incorporating the work-piece dimension which is a major parameter consideration in machinability rating. The present research was able to incorporate the work-piece dimension, linearity in feed rate as it relates to cutting speed and spindle speed when fine cutting two commonly used materials using two tool types on an electronic numerically controlled lathe machine that allows the pre-programming of the cutting length in the – ve z axis of its coordinates. Precision machining experts in the industry have established that Ra does not tell the whole story about a machined surface [10]. And this surface roughness parameter has been the focus of experimental investigations. The surface profile parameters have only been theoretically modelled by [11, 12].The need to develop, through experimental design, response condition monitoring models that optimise surface roughness and tool life of locally sourced workpiece and tool materials, through the incorporation of both standardised and practicable controllable and uncontrollable metal cutting factors in electronically numerical controlled (ENC) lathe machining operation is therefore the motivation for this research.
2. METHODOLOGY 2.1 Materials
Table 1: Mild steel Work-piece Material and its Chemical Compositions
Elements % Composition Elements % Composition Elements % Composition Carbon, C 0.30 – 0.59% Sulphur, S 0.04 Manganese 1.03
Silicon, Si 0.4 Copper, Cu 0.2 Iron, Fe Approx,98
Table 2: Physical Properties of Mild Steel Work-piece Material
Properties Approx.
Values Properties
Approx.
Values Properties
Approx. Values Yield Strength
(N/sqmm) 492.48
Modulus of
Toughness 19.42
Strain Hardnening
Parameter 0.865
UTS (N/sq mm) 578.79 Brinel Hardness HB 168
Table 1 shows the representative work-piece material and its chemical compositions based on research carried out by [9] The physical properties of the work-piece material were obtained based on the information provided by previous researchers such as [13,14] and the summary is presented in Table 2. The physical and chemical properties of the workpiece are in-line with the results of the experiments carried out by [15]
2.2 Experimental Procedure
The developed design was based on [16] response surface design. The Box-Behnken design was selected because it allows efficient estimation of the first and second order coefficients of the response surface regression model. Since the experiment was planned to be performed without replicates, Box-Behnken design is very relevant and appropriate because it is used when performing non-sequential experiments. The design is applicable to this experiment since the safe operating zones of the process parameters are known and established.
A fifteen-run based Box-Behnken response surface design was created using widely established machining parameters, namely cutting speed, feed rate and depth of cut. The hard-to-control factors such as quality and type of machine tool, vibration between work-piece, machine tools and cutting tools were considered as machining center’s desirabilities. The responses from the designed experiment were the surface roughness in four parameters, namely Ra, Rz, Rq, Rt as well as the empirical
tool life and the machining time for various experimental runs. The response surface analyser in Minitab 16 software was used to optimize the responses (i.e. minimize surface roughness, machining time and maximize empirical tool life) from the experiment which was based on Box-Behnken design. The ability of this design to accommodate extreme engineering considerations was the justification for its selection. The design matrix for the experiment is shown in Table 3.
The range of values for the process parameters were determined based on the recommendations from the optimum process parameters chart developed by [17].
Table 3: Design Matrix for the Experiment in which the Block is Mild Steel x carbide
Runs Cutting Speed Feed Rate Depth of Cut
1 250 0.05 0.2
2 350 0.05 0.2
3 250 0.15 0.2
4 350 0.15 0.2
5 250 0.1 0.1
6 350 0.1 0.1
7 250 0.1 0.4
8 350 0.1 0.4
9 300 0.05 0.1
10 300 0.15 0.1
11 300 0.05 0.4
12 300 0.15 0.4
13 300 0.1 0.2
14 300 0.1 0.2
15 300 0.1 0.2
ENC lathe machine with a spindle speed range from 100 to 2500 rpm was utilised for the experiment. The machining center was driven by 10kW electric motor. The experiment was carried out under dry machining environment. The cutting length a tool will effectively cut was programmed using the –ve z-coordinates of the travel distance of the cutting tool. The surface roughness of the machined workpiece was measured in four-parameter (Ra, Rz, Rq, Rt) using the Landtek surface
empirical tool life was derived based on the expression developed by[9] as shown in equation (1).
where, mmPM = RPM x mmPR
The current study was able to incorporate dimensional analysis into the parametric relationship adopted by [9] and empirical tool life estimates were obtained based on the Box-Behnken response surface design. These values were analysed using the response surface regression technique.
The following were situations induced assumptions for this research:
(i) The work-piece did not overhang on the chuck and deflection of the work-piece was avoided;
(ii) Tools’ orientation to the work-piece was at 900;
(iii)Work-piece was properly formed into specified dimension during casting;
(iv)Work-piece was properly fastened onto the chuck; (v) The work-piece was properly centralized on the
lathe using the tailstock;
(vi)There was an uninterrupted power supply to the machine tool;
3. MODEL DEVELOPMENT
The response surface analyser in Minitab 16 software allows the design to be carried out in coded and uncoded units. The coded units utilise the 1 0 + codes for the process parameters while the uncoded units utilise the exact values for low, medium and high input process parameters. Since the modelling was carried out in uncoded units, there was need to standardise the units of these process parameters before carrying out the response surface modelling.
3.1 Dimensional Analysis for Cutting Speed (v) in m/s The cutting speed is a derivative of the spindle speed (N) which is in rev/min (rpm). The spindle speed is the parameter which the machinist configures on the ENC based on the information provided by the optimum process parameter chart for the specified workpiece and tool materials as well as the cutting operation. The machinist uses the expression in equation (2) to obtain the corresponding spindle speed using the diameter of the workpiece. The cutting speed provided based on this relationship has a unit (m/min) which is not in S.I. unit. The modelling of the orthogonal cutting process was carried out in S.I. unit, thus the need to standardize the units of all process parameters. The cutting speed in m/min was converted to m/s using the expression in equation (3), derived by multiplying the m/min with
which converts the minutes to seconds.
d
where, D is the diameter of the workpiece. . min 3
3.2 Dimensional Analysis for Feed Rate (f) in m/s
The feed rate is a process parameter recognized in mm/rev by the ENC lathe machining centre. Also, the optimum process parameter chart provided the feed rate in mm/rev. Since the modelling of the orthogonal cutting process was carried out in S.I. unit, the feed rate in mm/rev for machining a workpiece of 80mm diameter was converted to m/s based on the expressions in equations (4) to (7).
( .
) The multiplicative factor was obtained thus:
5 and
is the radius of the workpiece in metres, while 0.10472 is
which converts the angular speed to its linear components.
Hence,
.
The feed rate in m/s was derived from the expression in equation (7).
m s
3.3 Response Surface Regression Models Development The empirical model developed for the determination of tool life based on the process parameters and workpiece dimensions is shown in equation (8)
( .
)
where, L is the cutting length on the workpiece, v is cutting speed and D is the workpiece diameter.
Response surface Regression Models for Mild Steel and Carbide Tool Combination were developed. The obtained coefficients for the response surface regression model for the mild steel workpiece and carbide tool turning operation were incorporated.
4. RESULTS
3 . 5. 3 . 55 . . 33 . 5
3 . 5 3
33 .35 3
The dependent variable, Ra, for this model has three independent variables. The Ra is expected to increase by 15.4223 units when the cutting speed is increased by unity, holding all the other independent variables constant. The Ra is expected to increase by 4554.76 units if the depth of cut is increased by unity, holding all the other independent variables constant. However, when the feed rate is increased by unity, the Ra value is expected to reduce by 27.7812 units, holding all the other independent variables constant. The cutting speed and feed rate interaction, as well as cutting speed and depth of cut interaction, have negative coefficients of 0.454316 and 3317.35 respectively which indicate that they antagonist towards the dependent variable, Ra. The feed rate and depth of cut with positive coefficient of 187398 acted synergistically towards each other while contributing to the response (dependent) variable, Ra. The developed for the Average Distance between Highest Peak and Lowest Valley Surface Roughness of the machined workpiece is shown in equation (10).
. 3.5 .5 . . . 5 3
.
3 .33 5 5
The dependent variable, Rz, for this model has three independent variables. The Rz is expected to increase by 43.5979 units when the cutting speed is increased by unity, holding all the other independent variables constant. The Rz is expected to increase by 12878.4 units if the depth of cut is increased by unity, holding all the other independent variables constant. However, when the feed rate is increased by unity, the Rz value is expected to reduce by 78.5496 units, holding all the other independent variables constant. The cutting speed and feed rate interaction, as well as cutting speed and depth of cut interaction, have negative coefficients of -1.24664 and -9372.33 respectively which indicate that they are antagonist towards the dependent variable, Rz. The feed rate and depth of cut with positive coefficient of 529508 are synergistically towards each other while contributing to the response (dependent) variable, Rz. The developed model for the Root Mean Squared the roughness of the machined workpiece is shown in equation (11).
. . 5 3 . 5 .3 a . .
5 55 . 3 3
. 3 5
The dependent variable, Rq, for this model has three independent variables. The Rq is expected to increase by 19.4576 units when the cutting speed is increased by unity, holding all the other independent variables constant. The Rq is expected to increase by 7981.34 units if the depth of cut is increased by unity, holding all the other independent variables constant. Whereas, when the feed rate is increased by unity, the Rq value is expected to decrease by 30.8645 units, holding all the other independent variables constant. The cutting speed and feed rate, and feed rate depth of cut interaction have positive coefficients of 0.603730 and 225027 respectively which indicate that they both acted synergistically towards the dependent variable, Rq. The cutting speed and depth of cut with negative coefficient of -4027.23is antagonist towards each other while contributing to the response (dependent) variable, Rq. The developed model for the Maximum Height of the Surface Roughness Profile of the machined workpiece is shown in equation (12).
3. . 53 3. . 3. 5 .
5 3 3.
. 5 53 5
The dependent variable, Rt, for this model has three independent variables. The Rt is expected to increase by 40.2153 units when the cutting speed is increased by unity, holding all the other independent variables constant. Also, when the depth of cut is increased by unity, the Rt value is expected to increase by 8422.71 units, holding all the other independent variables constant. The Rt is expected to decrease by 93.4041 units if the feed rate is increased by unity, holding all the other independent variables constant. The cutting speed and feed rate, as well as, cutting speed and depth of cut interaction have negative coefficients of 3.8872 and -93.4041 respectively which indicate that they are antagonist towards the dependent variable, Rt. The feed rate and depth of cut with positive coefficient of 532524acted synergistically towards each other while contributing to the response (dependent) variable, Rt. The developed model for tool life when machining mild steel using carbide tool is shown in equation (13).
.5 . . 3 .33 5 3.
The dependent variable, TL, for this model has three independent variables. The TL is expected to increase by 269.942 units when the cutting speed is increased by unity, holding all the other independent variables constant. Moreover, when the feed rate and depth of cut are increased by unity, the TL value is expected to decrease by 156144 and 907919 units respectively, holding all the other independent variables constant. The cutting speed and feed rate, cutting speed depth of cut as well as feed rate depth of cut interactions have positive coefficients of 9657.61, 398004 and 9730540 respectively which indicate that the interaction acted synergistically towards the dependent variable, TL. The developed model for machining time when machining mild steel using carbide tool is shown in equation (14).
3 .5 . 3 3. 3 3. .3 55 3 . 3 .3 33.5
5
The dependent variable, M/Ctime, for this model has three independent variables. The M/Ctime is expected to decrease by 6.77937 units when the cutting speed is increased by unity, holding all the other independent variables constant. Moreover, when the feed rate and depth of cut are increased by unity, the M/Ctime value is expected to increase by 93.9136 and 46943.9 units respectively, holding all the other independent variables constant. The cutting speed and feed rate, cutting speed and depth of cut, as well as feed rate depth of cut interactions have negative coefficients of 94.3794, -11433.5 and -775161 respectively which indicate that the interaction antagonist towards one another while contributing to the dependent variable, M/Ctime.
4.1 Observed and Predicted Data
The plot of the experimental observations and the predicted values based on the developed response surface model for Ra is shown in figure 1.
Figure 1: Plot of Ra and RaHat for Mild Steel and Carbide Tool Combination
Figure 2: Plot of Rz and RzHat for Mild Steel and Carbide Tool Combination
Figure 3: Plot of Rq and RqHat for Mild Steel and Carbide Tool Combination
Figure 4: Plot of Rt and RtHat for Mild Steel and Carbide Tool Combination
Figure 5: Plot of TL and TL Hat for Mild Steel and Carbide Tool Combination
The plot shows that observations and predictions fitted fairly. There are some spikes at runs 9 and 12 when the cutting speed was set at high level and feed rates at low and high levels respectively. At run 12, when the feed rate was high and cutting speed set at high value as well, the value of the surface roughness (Ra) was extremely high (4.6 microns).This value is still within the common typical range of Ra surface roughness values in turning operations as indicated by [18]. The plot of the experimental observations and the predicted values based on the developed response surface model for Rz is shown in Figure 2.
The plot shows that observations and predictions fitted fairly. There are some spikes at runs 9 and 12 when the cutting speed was set at high level and feed rates at low and high levels respectively. At run 12, when the feed rate was high and cutting speed set at high value as well, the value of the surface roughness (Rz) was extremely high (13 microns).The plot of the experimental observations and the predicted values based on the developed response surface model for Rq is shown in Figure 3.
The plot shows that observations and predictions fitted fairly. There are some spikes at runs 9 and 12 when the cutting speed was set at high level and feed rates at low and high levels respectively. At run 12, when the feed rate was high and cutting speed set at high value as well, the value of the surface roughness (Rq) was extremely high (5.6 microns). The plot of the experimental observations and the predicted values based on the developed response surface model for Rt is shown in Figure 4.
The plot shows that observations and predictions fitted fairly. There are some spikes at runs 9 and 12 when the cutting speed was set at high level and feed rates at low and high levels respectively. At run 12, when the feed rate was high and cutting speed set at high value as well, the value of the surface roughness (Rt) was extremely high (13 microns). The plot of the experimental observations and the predicted values based on the developed response surface model for TL is shown in Figure 5.
The plot shows a sinusoidal prediction flow pattern that fitted the empirically derived tool life values quite well. It shows that tool life reduced at runs 4, 6, 8, 10 and 12. These runs (4, 6, 8) have cutting speed; run 10 has high feed rate while run 12 has high depth of cut. These established that the three process parameters namely cutting speed, feed rate and depth of cut reduced tool life when their values are too high. The plot of the experimental observations and the predicted values based on the developed response surface model for M/ctime is shown in Figure 6.
The plot shows that the observed m/ctime and the predicted values differed in values to some extent. This could be because of the human factor that was involved in measuring the machining time using the stop watch. The result of lack of fit test carried out at level of significance of 0.05 is shown in Table 4.
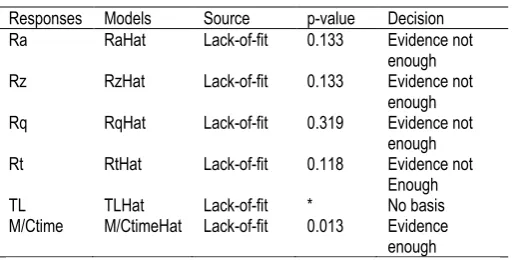
Table 4: Lack-of-fit for Mild Steel and Carbide Combination
Responses Models Source p-value Decision Ra RaHat Lack-of-fit 0.133 Evidence not
enough Rz RzHat Lack-of-fit 0.133 Evidence not
enough Rq RqHat Lack-of-fit 0.319 Evidence not
enough Rt RtHat Lack-of-fit 0.118 Evidence not
Enough TL TLHat Lack-of-fit * No basis M/Ctime M/CtimeHat Lack-of-fit 0.013 Evidence
enough
The second-order two-factor interaction (2FI) model with p-value of 0.0320 was suggested for the M/ctime response, because it is an improvement on the quadratic model with p-value of 0.0196, since the cubic model was aliased. As shown in Table 5.
Table 5: Model Selection for M/ctime (Mild Steel and Carbide Tool)
Sum of Mean F p-value Source Squares df Square Value Prob > F Linear 414.46 9 46.05 33.78 0.0291
2FI 249.89 6 41.65 30.55 0.0320 Suggested Quadratic 205.23 3 68.41 50.18 0.0196
Cubic 0.000 0 Aliased
Pure Error 2.73 2 1.36
Model developed for M/ctime, when fine cutting mild steel with carbide tool, based on the suggested 2FI interaction regression model is shown in equation 15.
. . 3. 5 3. . . 5
. 5 The model is an inverse transformation model and the values obtained are reciprocals of the expected predictions. The plot of the predicted and actual values for the revised model for m/ctime is shown in figure 7. The diagnostic check for models developed is shown in Table 6. These showed that the models predicted fairly and can be used for prediction.
4.2 Response Optimisation
parameters. The cutting speed, v in m/s, feed rate, f in m/s and depth of cut, (ap) in metres have global solutions of 5.49674, 0.0475348 and 0.0003394 respectively. These optimum process parameter settings for the turning operation on ENC lathe were converted to their common units using dimensional analysis, and are 329.80 mpm, 0.055 mm/rev and 0.34mm for the cutting speed, feed rate and depth of cut respectively.
Figure 7: Plot of Actual and Predicted M/ctime Based on the 2FI
Model
Table 6: Diagnostic Checks for Models developed
Model Rsq Adj Rsq BIC AIC
Ra (quadratic) 0.6981 0.1546 53.24 101.16
Rz (quadratic) 0.6981 0.1547 84.41 132.33
Rq (quadratic) 0.6829 0.1121 60.23 108.15
Rt (quadratic) 0.6953 0.1470 84.32 132.24
TL (quadratic) 0.7209 0.2184 212.99 260.91
M/ctime (2FI) 0.6058 0.3101 103.88 114.93
The optimum predicted responses from the orthogonal cutting process for the optimal process parameters are 0.1742 micron, 0.4933 micron, 0.1845 micron, 0.3673
micron, 794.6839 seconds and 19.642 seconds for the Ra, Rz, Rq, Rt, TL and M/Ctime respectively. The associated desirabilities for these optimum responses are 1.000000, 1.000000, 1.000000, 1.000000, 0.524122, and 0.361858 respectively. Also, the composite desirability for the mild steel workpiece and Carbide tool turning operation on ENC lathe machine is 0.757987. The optimisation plot is shown in Figure 8.
4.3 Response Surface and Contour Plots
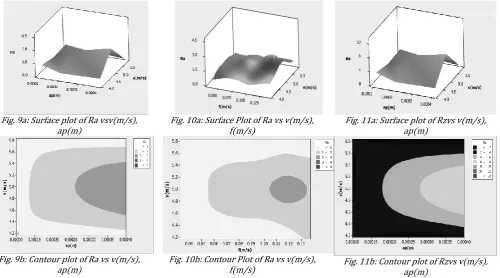
Figures 9a and 9b show surface and contour plots for Ra based on data obtained while machining mild steel using carbide tool and considering the cutting speed (v) and depth of cut (ap). The response, Ra, has highest value (3.5 microns)when the cutting speed was at 5.0 m/s (300mpm) and depth of cut was at 0.0004m (0.4mm).
Figure 8: response optimisation plot for mild steel and carbide combination
Fig. 9a: Surface plot of Ra vsv(m/s), ap(m)
Fig. 10a: Surface Plot of Ra vs v(m/s), f(m/s)
Fig. 11a: Surface plot of Rzvs v(m/s), ap(m)
Fig. 9b: Contour plot of Ra vs v(m/s), ap(m)
Fig. 10b: Contour Plot of Ra vs v(m/s),
f(m/s) Fig. 11b: Contour plot of Rzvs v(m/s), ap(m) D es ign-Ex pert ® Sof t ware
M/ c t im e
C olor point s by v alue of M/ c t im e:
31. 52
8
Actual
Pr
ed
ict
ed
Predicted vs. Actual
5 10 15 20 25 30 35
Whereas, the minimized value (0.8 microns) for Ra based on the surface response plot was attained when the cutting speed was between 4.0-4.5m/s(240 – 270 mpm) and when the depth of cut was at 0.0002m ( 0.2mm).The contour plot figure 9b shows the regions within which the process parameters settings should be selected for optimized Ra from the selected operation. The contour plot suggests that the cutting speed should be within 4.25 – 5.8 m/s (255 - 3 mpm while the depth of cut’s value is kept within 0.00010 – 0.00015m (0.1 – 0.15mm) for a minimized surface roughness (Ra) of value less than 1 microns. Also when the process parameter settings are kept within cutting speed of 4.4 – 5.8m/s (264 – 348 mpm) and depth of cut of 0.00015-0.00040m (0.15 – 0.4mm), the surface roughness Ra value would be extremely high (above 4 microns) when machining mild steel work piece using carbide cutting tool on a ENC lathe machine.
Figures 10a and 10b show surface and contour plots for Ra while considering the cutting speed (v) and feed rate (f). The response, Ra, has highest value (3.6 microns) when the cutting speed was at 5.0 m/s (300 mpm) and feed rate was at 0.125m/s (0.159mm/rev). The minimized value (0.15 microns) for Ra based on the surface response plot was attained when the cutting speed was below 4.5 m/s (270mpm) and when the feed rate was at 0.01m/s and 0.1m/s (0.014 – 0.141mm/rev). Therefore the recommended range of process parameter settings for carbide tool while machining mild steel workpiece was cutting speed at 4.0 – 4.5 m/s (240 - 270 mpm) and feed rate at 0.01 and 0.1 m/s (0.016 – 0.141 mm/rev). The contour plot Figure 10b shows the regions
within which the process parameters settings should be selected for optimized Ra from the selected operation. The contour plot suggests that the cutting speed should be within 4.2 – 4.6 m/s (252 – 276mpm) while the feed rate value is kept within 0.04 and 0.06 m/s (0.061 – 0.083 mm/rev) for a minimized surface roughness (Ra) of values below 1 micron. Also, when the cutting speed is kept within 4.6 – 5.2m/s (276 - 312 mpm) and feed rate is maintained at 0.105 – 0.135m/s (0.145 – 0.165mm/rev), the value for the Ra is increased to between 2 – 3 microns.
Figures 11a and 11b show surface and contour plots for Rz while considering the cutting speed (v) and depth of cut (ap). The response, Rz, has highest value when the cutting speed was at 5.0 m/s (300mpm) and depth of cut was at 0.0004m (0.4mm). The minimized value for Rz based on the surface response plot was attained when the cutting speed was below or above 5.0 m/s (300mpm) and when the depth of cut was at 0.0004m (0.4 mm). therefore the recommended range of process parameter settings for carbide tool while machining mild steel workpiece was cutting speed at 4.5 – 5.0 m/s (270 - 300; mpm) and depth of cut at 0.0002 – 0.0004m (0.2 – 0.4mm). The contour plot in figure 11b shows the regions within which the process parameters settings should be selected for optimized Rz from the selected operation. The contour plot suggests that the cutting speed should be within 4.8 – 5.7 m/s (288 - 342 mpm) for depth of cut’s value less than . 5m; depth of cut of 0.00015-0.0004m (0.15 – 0.40 mm) for cutting speed below 4.25m/s (255mpm) to obtain a minimized surface roughness (Rz) of values below 2 microns
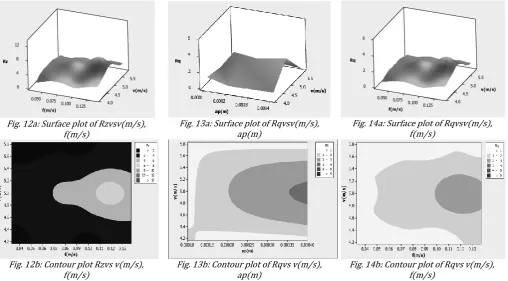
Fig. 12a: Surface plot of Rzvsv(m/s), f(m/s)
Fig. 13a: Surface plot of Rqvsv(m/s), ap(m)
Fig. 14a: Surface plot of Rqvsv(m/s), f(m/s)
Fig. 12b: Contour plot Rzvs v(m/s), f(m/s)
Fig. 13b: Contour plot of Rqvs v(m/s), ap(m)
Also when the process parameter settings are kept within cutting speed of 4.6 – 5.4m/s (276 - 324mpm) and depth of cut of 0.000255-0.0004m (0.25 – 0.4mm), the surface roughness Rz value would be extremely high (between6 - 8 microns) when machining mild steel work piece using carbide cutting tool on a ENC lathe machine. Increase of cutting speed from 4.0 to 5.0 m/s (240 - 300mpm) and increase of depth of cut from 0.0002 to 0.0004m (0.2 – 0.4mm), resulted in an increase of Rz from below 4 microns to about 8 microns. However, when the depth of cut was over 0.0004m (0.4 mm) and cutting speed over 5.0 m/s (240mpm), there was a sharp decrease in the Rz from about 8 microns to almost 0.5 micron. The possible explanation for this could be that increasing cutting speed accelerates metal removal rate which resulted in the lower surface roughness when machining mild steel with Carbide tool.
Figures 12a and 12b show surface and contour plots for Rz while considering the cutting speed (v) and feed rate (f). The response, Rz, has highest value when the cutting speed was at 5.0 m/s (300mpm) and feed rate was at 0.125m/s (0.159mm/rev). The minimized value (0.75 microns) for Rz based on the surface response plot was attained when the cutting speed was below 4.5 m/s (270mpm) and the feed rate was at 0.10m/s (0.141mm/rev). Therefore the recommended range of process parameter settings for Carbide tool while machining mild steel workpiece was cutting speed at 4.0 – 4.5 m/s (240 - 270mpm) and feed rate at 0.05-0.1m/s ( 0.080 – 0.141mm/rev). The contour plot in figure 12b shows the regions within which the process parameters settings should be selected for optimized Rz from the selected operation. The contour plot suggests that the cutting speed should be within 4.2 – 4.5 m/s; 5.45 – 5.85m/s (252 - mpm while the feed rate’s value is kept within 0.03 – 0.05m/s (0.045 – 0.071 mm/rev) for a minimized surface roughness (Rz) of values below 2 microns. Also when the process parameter settings are kept within cutting speed of 4.7 –5.3m/s (281 - 320mpm) and feed rate of 0.115-0.135m/s (0.156 – 0.162mm/rev), the surface roughness Rz value would be high (between6 - 8 microns) when machining mild steel work piece using carbide cutting tool on a ENC lathe machine. Increase of cutting speed from 4.5 to 5.0 m/s (270 - 300mpm) and increase of feed rate from 0.1 to 0.125m/s(0.141 – 0.159mm/rev), resulted in an increase of Rz from below 1 micron to about 8 microns. However, when the feed rate was over 0.075m/s(0.095 mm/rev) and cutting speed over 5.0 m/s (300mpm), there was a sharp decrease in the Rz from about 3 microns to almost 0.5 micron. The possible explanation for this could be that increasing cutting speed accelerates metal removal rate which resulted in the lower surface roughness when
machining mild steel with carbide tool, at controlled feed rate.
Figures 13a and 13b show surface and contour plots for Rq while considering the cutting speed (v) and depth of cut (ap). The response, Rq, has highest value when the cutting speed was at 5.0 m/s (300mpm) and depth of cut was at 0.0004m (0.4 mm). The minimized value for Rqbased on the surface response plot was attained when the cutting speed was below or above 5.0 m/s (300mpm) and the depth of cut was at 0.0002m (0.2 mm). Therefore the recommended range of process parameter settings for carbide tool while machining mild steel workpiece was cutting speed at 4.0 – 4.5 m/s; 5.5 m/s and above (240 – 270; 330; mpm), and depth of cut at 0.0002-0.0004m (0.2 – 0.4mm). The contour plot Figure 13b shows the regions within which the process parameters settings should be selected for optimized Rq from the selected operation. The contour plot suggests that the cutting speed should be within 4.2- 4.4m/s; 4.4 – 5.6m/s (252 – 264; 264 - 336mpm) while the depth of cut’s value is kept within 0.00010 – 0.00011m; 0.00011 – 0.00040 (0.1 – 0.11; 0.11 – 0.40mm) for a minimized surface roughness (Rq) of values within 1 and 2 microns. Also when the process parameter settings are kept within cutting speed of 4.7 – 5.1m/s (282 - 306mpm) and depth of cut of 0.00035 -0.00040m (0.35 – 0.40mm), the surface roughness Rq value would be high between 3-4 (9 microns) when machining mild steel work piece using carbide cutting tool on a ENC lathe machine. In addition, the surface roughness Rq will be extremely minimized if the cutting speed is kept within 4.4 – 5.8m/s (264 - 348mpm) while depth of cut is maintained at 0.00010 – 0.00011m (0.10 – 0.11 mm); cutting speed 0f 4.2 – 4.3m/s; 5.6 – 5.8m/s (252 – 258; 336 - 348mpm) and depth of cut of values between 0.00011 – 0.00040m (0.11 – 0.40 mm).Increase of cutting speed from 4.5 to 5.0 m/s (276 mpm ) and increase of depth of cut from 0.0002 to 0.0004m (0.2 – 0.4mm), resulted in an increase of Rq from below 0.5 micron to about 5 microns. However, when the depth of cut was over 0.0004m (0.4) and cutting speed over 5.0 m/s (300mpm), there was a sharp decrease in the Rq from about 5 microns to almost 0.5 micron.
machining mild steel workpiece was cutting speed at 4.5m/s and 5.5m/s ( 270mpm; 330mpm) and feed rate at 0.010m/s and 0.012; 0.141mm/rev. The contour plot figure 14b shows the regions within which the process parameters settings should be selected for optimized Rq from the selected operation. The contour plot suggests that the cutting speed should be within 4.2 – 4.5m/s and 5.5 – 5.8m/s (252 - 270mpm) while the feed rate value is kept within 0.03 – 0.12m/s (0.045 – 0.170mm/rev) for a minimized surface roughness (Rq) of values below 1microns. In addition, surface roughness (Rq) is minimized to a value below 1 micron when the cutting speed is between 4.6m/s and 5.4m/s (276 - 324mpm); and the feed rate was between 0.03m/s and 0.05m/s(0.042 and 0.059mm/rev). When the process parameter settings are kept within cutting speed of 4.7 – 5.2m/s (282 - 312mpm) and feed rate of 0.10m/s – 0.14m/s (0.135 – 0.171 mm/rev), the surface roughness Rq value would be high (between 2-3 microns) when machining mild steel work piece using carbide cutting tool on a ENC lathe machine. Increase of cutting speed from 4.5 – 5.0m/s (270 - 300mpm) and increase of feed rate from 0.1 – 0.125m/s (0.141-0.159mm/rev), resulted in an increase of Rq from below 2 micron to about 5 microns. However, when the feed rate was over 0.075m/s (0.095mm/rev) and cutting speed over 5.0 m/s (300mpm), there was a sharp decrease in the Rq from about 6 microns to almost 0.5 micron.
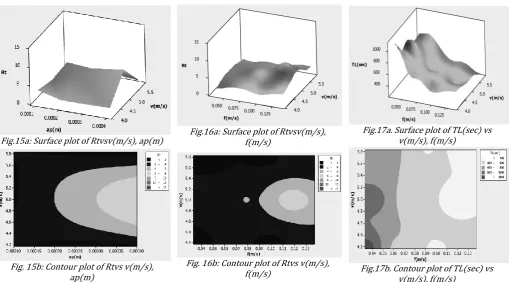
Figures 15a and 15b show surface and contour plots for Rt while considering the cutting speed (v) and depth of cut (ap). The response, Rt, has highest value when the cutting speed was at 5.0 m/s (300mm) and depth of cut
was at 0.0004m (0.4mm). The minimized value for Rt based on the surface response plot was attained when the cutting speed was below or above 5.0 m/s (300mpm) and the depth of cut was at 0.0002m (0.2 mm). Therefore the recommended range of process parameter settings for carbide tool while machining mild steel workpiece was cutting speed at 4.5 – 4.9m/s; 5.1 – 5.5m/s (270-294mpm; 306-330mpm) and depth of cut at 0.0002 – 0.0004 ( 0.2-0.4mm). The contour plot in Figure 15b shows the regions within which the process parameters settings should be selected for optimized Rt from the selected operation. The contour plot suggests that the cutting speed should be within 4.8 – 5.6m/s (288-336 mpm while the depth of cut’s value is kept within 0.00010 – 0.00011m (0.1-0.11mm) for a minimized surface roughness (Rt) of values below 2 microns. At cutting speed of 4.2m/s, and 5.8m/s with depth of cut (252-348mpm) kept with 0.00015 and 0.00040 m, the Rt
value is below 2 microns as well. Also when the process parameter settings are kept within cutting speed of 4.6 – 5.4m/s (276-324mpm) and depth of cut of 0.00031-0.0004m (0.31-0.4mm), the surface roughness Rt value would be extremely high (between 6-8 microns) when machining mild steel work piece using carbide cutting tool on a ENC lathe machine. Increase of cutting speed from 4.5 – 5.0 m/s (270-300mpm) and increase of depth of cut from 0.0002 to 0.0004m (0.2-0.4mm), resulted in an increase of Rt from below 5 microns to about 10 microns. However, when the depth of cut was over 0.0004m (0.4mm) and cutting speed over 5.0 m/s (mpm), there was a sharp decrease in the Rt from about 10 microns to almost 0.5 microns.
Fig.15a: Surface plot of Rtvsv(m/s), ap(m) Fig.16a: Surface plot of Rtvsv(m/s), f(m/s)
Fig.17a. Surface plot of TL(sec) vs v(m/s), f(m/s)
Fig. 15b: Contour plot of Rtvs v(m/s), ap(m)
Fig. 16b: Contour plot of Rtvs v(m/s),
Figures 16a and 16b show surface and contour plots for Rt while considering the cutting speed (v) and feed rate (f). The response, Rt, has highest value when the cutting speed was at 5.0 m/s (300mpm) and feed rate was at 0.125m/s (0.159mm/rev). The minimized value for Rt based on the surface response plot was attained when the cutting speed was below or above 5.0 m/s (300mpm) and when the feed rate cut was at 0.100m/s (0.127mm/rev). Therefore the recommended range of process parameter settings for carbide tool while machining mild steel workpiece was cutting speed at 4.5 – 4.9; 5.1–5.5m/s(270-294; 306-330mpm) and feed rate 0.125m/s (0.159mm/rev). The contour plot Figure 16b shows the regions within which the process parameters settings should be selected for optimized Rt from the selected operation. The contour plot suggests that the cutting speed should be within 4.2 – 4.5m/s (252-270 mpm) while the value is kept within 0.03 – 0.05 (0.045 – 0.071mm/rev) for a minimized surface roughness (Rt) of values below 2 microns. In addition, cutting speed between 5.45m/s (327mpm) and 5.8m/s (348mpm) with feed rate kept at a range of 0.03m/s – 0.10m/s (0.035 – 0.11mm/rev) will yield a minimized surface roughness Rt of value below 5 microns. Also when the
process parameter settings are kept within cutting speed at4.7 – 5.2m/s (282 - 312mpm) and feed rate of 0.15 – 0.13m/s (0.203 – 0.159mm/rev), the surface roughness Rt value would be extremely high (between 6-8 microns) when machining mild steel work piece using carbide cutting tool on a ENC lathe machine. Increase of cutting speed from 4.5 to 5.0 m/s (270 - 300mpm) and increase of feed rate from 0.100 to 0.125m/s (0.141 – 0.159mm/rev), resulted in an increase of Rt from below 5 microns to about 10 microns. However, when the feed
rate was over 0.075m/s (0.095 mm/rev) and cutting speed over 5.0 m/s (300 mpm), there was a sharp decrease in the Rt from about 10 microns to almost 0.5 micron.
Figures 17a and 17b show surface and contour plots for TL while considering the cutting speed (v) and feed rate (f). The response, TL, has highest value when the cutting speed was at 4.5m/s (270mpm) and feed rate was at 0.050m/s (0.071mm/rev). The minimum value (below 400 seconds) for TL based on the surface response plot
was attained when the feed rate was 0.125m/s (0.166mm/rev), when cutting speed was between 4.8 – 5.8m/s (288 – 348mpm). Therefore the recommended range of process parameter settings for carbide tool while machining mild steel workpiece was cutting speed at 4.5m/s (270 mpm) and feed rate at 0.100m/s (0.141mm/rev). The contour plot in Figure 17b shows the regions within which the process parameters settings should be selected for optimized TL from the selected
operation. The contour plot suggests that the cutting speed should be within 4.2 – 4.3m/s (252 - 258mpm) while the feed rate value is kept within 0.04m/s (0.061 or 0.059mm/rev respectively) for a maximized Tool life TL of values greater than 1000 seconds. Also when the
process parameter settings are kept within cutting speed of 4.6 – 5.8m/s (276 - 348mpm) and feed rate of 0.1 – 0.13 (0.138 – 0.143mm/rev), the tool life TL value would
be extremely low (below 400 seconds) when machining mild steel work piece using carbide cutting tool on a ENC lathe machine. Increase of feed rate from 0.05 – 0.125m/s (mm/rev), resulted in a decrease of TL from
above 1000 seconds to about 400 seconds at the same cutting speed.
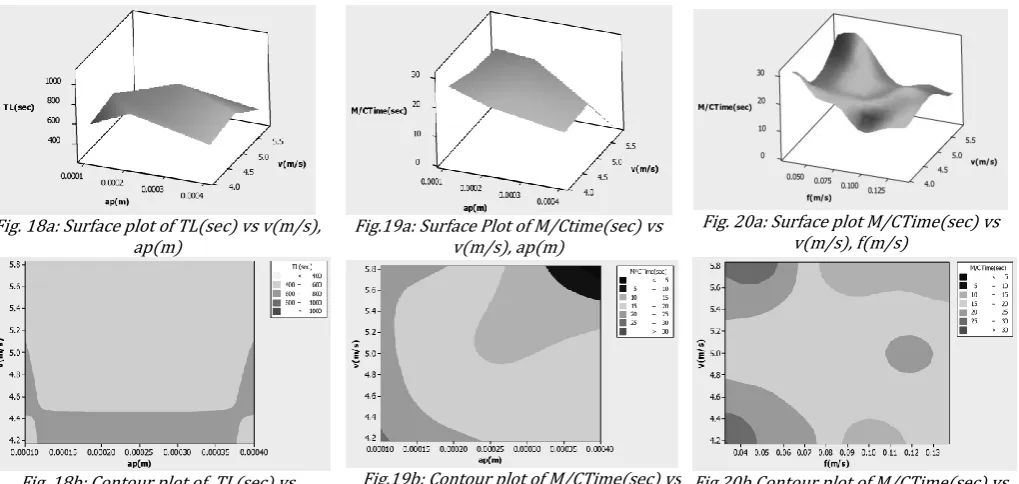
Fig. 18a: Surface plot of TL(sec) vs v(m/s), ap(m)
Fig.19a: Surface Plot of M/Ctime(sec) vs v(m/s), ap(m)
Fig. 20a: Surface plot M/CTime(sec) vs v(m/s), f(m/s)
Fig. 18b: Contour plot of TL(sec) vs v(m/s), ap(m)
Fig.19b: Contour plot of M/CTime(sec) vs
Figures 18a and 18b show surface and contour plots for TL while considering the cutting speed (v) and depth of cut (ap). The response, TL, has highest value when the cutting speed was at 5.0 m/s ( mpm) and depth of cut was at 0.0002m (0.2mm). The minimum value for TL based on the surface response plot was attained when the cutting speed was below or above 5.0 m/s (300mpm) and when the depth of cut was greater than or less than 0.0002m (0.2mm). therefore the recommended range of process parameter settings for carbide tool while machining mild steel workpiece was cutting speed at 5.0 (300mpm) and depth of cut at 0.00011-0.00020m (0.11 – 0.20mm) for a maximized Tool life of above 800 seconds. The contour plot Figure 18b shows the regions within which the process parameters settings should be selected for optimized TL from the selected operation. The contour plot suggests that the cutting speed should be within 4.4 – 5.1 m/s (264 - 306mpm) while the depth of cut’s value is kept at . and . m, . – 0.00013m (0.1 – 0.4; 0.1 – 0.3mm respectively) for a maximized Tool Life (TL) of values within 600 and 800 seconds. Also when the process parameter settings are kept within cutting speed of 4.2 – 4.5m/s (252 – 270mpm) and depth of cut of 0.00012-0.00037m (0.12 – 0.37mm), the Tool Life TL value is maximized (600 - 800seconds) when machining mild steel work piece using carbide cutting tool on a ENC lathe machine. Figures 19a and 19b show surface and contour plots for M/Ctime while considering the cutting speed (v) and depth of cut (ap). The response, M/Ctime, has highest value when the cutting speed was at 5.5 m/s (330mpm) and depth of cut was at 0.0001m (0.1mm). The minimized value for M/Ctime based on the surface response plot was attained when the cutting speed was at 4.5m/s (270mpm) and the depth of cut was at 0.0004m (0.4mm). Therefore the recommended range of process parameter settings for carbide tool while machining mild steel workpiece was cutting speed at 5.0 – 5.5m/s (300 - 330mpm) and depth of cut at 0.0001-0.00029m (0.1 – 0.29mm). The contour plot figure 19b shows the regions within which the process parameters settings should be selected for optimized M/C Time from the selected operation. The contour plot suggests that the cutting speed should be within 5.6 – 5.8 m/s (336 - 3 mpm while the depth of cut’s value is kept within 0.00035 – 0.00040m (0.35 – 0.40mm) for a minimized machining time M/C time of values less than 5 seconds. Also when the process parameter settings are kept within cutting speed of 4.4 – 5.8m/s (264 - 348mpm) and depth of cut of 0.00010-0.00023m (0.1 – 0.23mm), the machining time M/C time value would be high (between 20 – 25 seconds) when machining mild steel work piece using carbide cutting tool on a ENC lathe
machine. Increase of depth of cut from 0.0002 to 0.0004m (0.2 – 0.4mm), resulted in an decrease of M/C time from below 27 seconds to about 9 seconds, at the same cutting speed.
Figures 20a and 20b show surface and contour plots for M/Ctime while considering the cutting speed (v) and feed rate (f). The response, M/Ctime, has highest value when the cutting speed was at 5.5 m/s (330mpm) and feed rate was at 0.050m/s (0.058mm/rev). The minimized value for M/C time based on the surface response plot was attained when the cutting speed was below 4.5m/s (270mpm) and when the feed rate was at 0.01m/s (0.014mm/rev). The recommended range of process parameter settings for carbide tool while machining mild steel work-piece was cutting speed at 4.5 – 5.0 m/s (270 - 330mpm) and feed rate at 0.100-0.125m/s (0.141 – 0.159mm/rev). The contour plot Figure 20b shows the regions within which the process parameters settings should be selected for optimized M/C time from the selected operation. The contour plot suggests that the cutting speed should be within 4.2 – 4.4 m/s (252 - 264mpm) while the feed rate value is kept within 0.03 – 0.045m/s (0.045 – 0.065mm/rev) for a machining time of values within 25 and 30seconds. Also, when the process parameter settings are kept within cutting speed of 5.4 – 5.8m/s (324 - 348mpm) and feed rate 0.08 – 0.13m/s (0.094 – 0.143mm/rev), the machining time (M/C time) value would be minimized to between 10 – 15 seconds when machining mild steel work piece using carbide cutting tool on a ENC lathe machine.
5. CONCLUSIONS
Orthogonal metal cutting is an age-long manufacturing process which has been extensively investigated by the subject matter experts. The responses from this process are based on the factors that play out within its technological system. These are the work-piece, cutting tool and machine tool; and their respective responses are surface roughness, tool life and machining time.
i. This study was able to investigate these responses and attempted to develop useful theoretical representations of these machinability ratings needful for an effective and productive machine tool industry.
ii. Development of a machining database that will improve the productivity and standardize the machine tool industry in Nigeria was carried out. iii. Development of models for the prediction of surface
roughness in four parameters for orthogonal metal cutting of mild steel using carbide tools carried out. iv. The establishment of the near optimal surface
Rz, Rq and Rt) at which tool life of P10 carbide insert, while machining mild steel was attained for industrial scale applications.
v. The results compared well with literature values in some cases, for example [18] has 2.05 – 5.90 microns for Ra of machined mild steel and our results for the same work-piece and cutting tool combination indicated a range of 0.3 – 4.6 microns. Some other results (Rz, Rq, Rt) could not be compared with any existing literature values because research works that evaluated surface roughness beyond centre line average, Ra, are not widely reported.
6. ACKNOWLEDGEMENT
The authors acknowledged the support from the members of staff, Prototype Engineering Development Institute (PEDI) in Ilesa. Particularly, the Deputy Director, Engr M. O. Oduola, the ENC lathe programmer, Engr O. C. Fakowayo and Mr F. B. Ayetoro, tool supplier. Also, the management of Bells University of Technology is commended for the provision of salary advance which enabled the lead researcher to procure the Landtek Surface Roughness testing machine with RS232 USB data transfer feature from Hong Kong, China.
7. REFERENCES
[1] Peres, C. “Fuzzy Model and Hierarchical Fuzzy Control
Integration: An Approach for Milling Process
Optimization”. Computers in Industry, vol. 39, pp. 199-207, 1999.
[2] Taylor, F. W. “On the Art of Cutting Metals”. Transactions
of the ASME, vol. 28, no 31 pp. 310-350, 1907.
[3] Atuici, H., Yallase, M. A., Fnides, B., Chaoui, K. and Mabrouki, T. “Modelling and Optimization of Hard Turning of X38CrMoV5-1 Steel with CBN Tool: Machining Parameters Effects on Flank Wear and Surface
Roughness”. Journal of Mechanical Science and
Technology, Vol. 25 no 1, pp. 2843-2851, 2011.
[4] Alli, F. “No Country can Industrialise without Machine Tools Industry”, Vanguard Media imited, Nigeria. www.vanguardngr.com, accessed on February 6, 2014.
[5] Zain, A. M., Haron, H. and Sharif, S. “Prediction of Surface Roughness in the End Milling Machining using Artificial Neural Network”, Expert System With Applications, Vol. 37, pp. 1755-1768, 2010.
[6] Ozel, T. and Karpat, Y. “Predictive Modelling of Surface Roughness and Tool Wear in Hard Turning using
Regression and Neural Networks”. Journal of Machine
Tools and Manufacture, vol. 45, pp. 467-479, 2005.
[7] Suresh, P. V. S., Venkateswara R. P. and eshmukh, S.G. “A
Genetic Algorithm Approach for Optimisation of Surface Roughness Prediction Model”, International Journal of Machine Tools and Manufacture, vol. 42, pp. 675-680, 2002.
[8] Alagarsamy, S. V., Raveendran, P., Arockia, V. S. and Tamil, V. “Optimization of Machining Parameters for Turning of Aluminium Alloy 5 Using Taguchi Method”, International Research Journal of Engineering and Technology, Vol. 3, Issue 1, PP 316 – 322, 2016.
[9] Ojolo, S. J. and Ogunkomaiya, O. “A Study of Effects of Machining Parameters on Tool ife”, International Journal of Materials Science Applications, Vol. 3, No. 5, pp. 183-199, 2014.
[10] PDI . Surface Profile Parameters, Precision Devices, Inc., http://db.materialoptions.com/ASETSDefense/SEDB/EH C_Alts/Tech_Matls_Info/Surface%20Metrology%20Guide %20-%20Profile%20Parameters.pdf. Accessed on July 6th, 2016. 1998.
[11] Qu, J. and Shih, A. J. “Analytical Surface Roughness Parameters of a Theoretical Profile Consisting of Elliptical Arcs”Machining Science and Technology, Vol. 7, No 2, pp.281-294, 2003.
[12] Hashmi, K. H., Zakria, G., Raza, M. B. and Khalil, S. “Optimisation of Process Parameters for High Speed Machining of Ti-6Al-4V Using Response Surface Methodology” the International Journal of Advanced Manufacturing Technology, vol. 85, issue 5, pp. 1847-1856, 2015.
[13] Raji, N. A. and Oluwole, O. O. “Mechanical Properties of Cold-Drawn Low Carbon Steel for Nail Manufacture: Experimentation, Observation. Research Journal of Applied Sciences, Engineering and Technology, Vol.5, (1), pp 118-122, 2013.
[14] Ahaneku, I. E., Kamal, A. R. and Ogunjimi, O. A. “Effects of Heat Treatment on Properties of Mild Steel using ifferent Quenching Charts” Frontiers in Science, Vol. 2,(16), pp. 153-158, 2012.
[15] Kareem, B. “Tensile and Chemical Analyses of Selected Steel Bars Produced in Nigeria”, AU. J.T. vol. 13 (1) pp. 29-33, 2009.
[16] Box, GEP and Behnken D. W “Some New Three evel
Designs for the Study of Qualitative Variables. Technometrics, vol.2, pp. 455-475, 1960.
[17] Jain, R. K. Production Technology. Khanna Publishers, New Delhi. P.476, 2009.
[18] Vikram, K. A. and Ratnam, C. “Empirical Model for Surface
Roughness in Hard Turning Based on Analysis of Machining Parameters and Hardness Values of Various
Engineering Materials” International Journal of