Electronic Journal of Plant Breeding, 2(2):253-257 (June 2011) ISSN 0975-928X
http://sites.google.com/site/ejplantbreeding 253
Research Note
Correlation and path coefficient analysis of grain yield and yield contributing
traits in single cross hybrids of maize (Zea mays L.)
R. Pavan1*, H. C. Lohithaswa1, M. C. Wali2, Gangashetty Prakash3 and B. G. Shekara1
1
AICRP on Forage crops, ZARS, V. C. Farm, Mandya 571 405, India 2
ARS, Arabhavi, Belgaum District, Karnataka 3
Department of Genetics and Plant Breeding, University of Agricultural Sciences, Dharwad
*Email: [email protected]
(Received:21Mar 2011; Accepted:03May2011)
Abstract:
The yield is a complex trait, which is highly influenced by the environment and hence indirect selection through component traits would be an advisable strategy to increase the efficiency of selection. Eighty seven single cross hybrids of maize were developed by crossing twenty nine newly developed inbred lines from the National Yellow Pool with three testers in a line x tester mating design and were evaluated in a randomized complete block design with two replications to assess the direct and indirect effects of grain yield among twelve quantitative traits. Plant height, ear length, ear circumference, number of kernel rows/ear, number of kernels/row, 100-grain weight, shelling per cent, grain yield per plant and fodder yield per ha recorded significantly positive genetic correlation with grain yield. However, path coefficient analysis revealed that days to 50 per cent silking, plant height, number of kernels rows/ear, number of kernels/row, 100-grain weight, shelling per cent, grain yield per plant and fodder yield have highest direct effect on grain yield.
Key words:
Maize, correlation, path coefficient analysis, grain yield.
Maize (Zea mays L.) is the third most important
cereal food crop of the world belonging to the family Poaceae and tribe Maydeae after wheat and rice (Poehlman, 1997). In country like India, rapid growth in population outstrips our grain in cereal production. Increased production of maize and its alternate utilization in food channel can reduce the pressure on wheat, rice and its imports. Now a days, maize has also been recognized as an industrial crop because of the diversified products that can be developed like starch, syrup, glucose, gluten and oil. Nearly 49% of the total maize produced is being utilized as a raw material in the poultry feed industry.
Grain yield is a complex character which is highly influenced by the environment and is the result of interrelationships of its various yield components (Grafius, 1960). Thus, information on genotypic and phenotypic correlation coefficients among various plant traits help to ascertain the degree to which these are associated with economic productivity. The association between two characters can directly be observed as phenotypic correlation while genotypic
correlation expresses the extent to which two traits are genetically associated. Both genotypic and phenotypic correlations among and between pairs of agronomic traits provide scope for indirect selection in a crop breeding programme.
Electronic Journal of Plant Breeding, 2(2):253-257 (June 2011) ISSN 0975-928X
http://sites.google.com/site/ejplantbreeding 254
derive information on correlations among yield and yield component traits and to estimate the direct and indirect effects of yield component traits on grain yield. This helps in selection of superior cross combinations in hybrid maize.
The parents used in the experiment comprised twenty nine promising newly developed inbred lines from the National Yellow Pool based on their performance in their S4 generation. These selected twenty nine inbreds were used as females and were crossed with
three testers viz., Prabha (composite with broad
genetic base), KDMI-10 and CI-5(inbred lines with narrow genetic base) at Main Agricultural Research
Station, Agricultural collage, Dharwad during kharif
2007-08.
The 87 F1 hybrids thus generated from the above Line x Tester crossing programme were evaluated in randomized complete block design with two replications along with parental lines and five
commercial checks viz., DMH-2 and EH-434042
(Arjun) (Public hybrids), 900M, Bio-9681 and Pinnacle (Private hybrids) at All India Co-ordinate Maize Improvement Project (AICMIP), Agricultural
Research station (ARS), Arabhavi during
rabi/summer 2008-09.
Each entry was raised in two rows with a row length of 4m and the spacing maintained was 75cm between the rows and 20cm between the plants. The recommended package of practices was followed to raise a good crop. Observations on grain yield and its 11 important component traits were recorded from five competitive plants which were selected randomly to record observations on days to 50 per cent tasseling, days to 50 per cent silking, plant height (cm), ear length (cm), ear circumference (cm), number of kernel rows per ear, number of kernels per row, 100-grain weight (g), shelling per cent, grain yield per plant, fodder yield (t/ha) and grain yield (q/ha). The mean values were used for statistical analysis. The phenotypic and genotypic correlation coefficients were worked out as per the method
suggested by Johnson et al., (1955). Path analysis
was carried out using the simple correlation coefficient to know the direct and indirect effects of the yield and components of yield as suggested by Wright (1921) and illustrated by Dewey and Lu (1959).
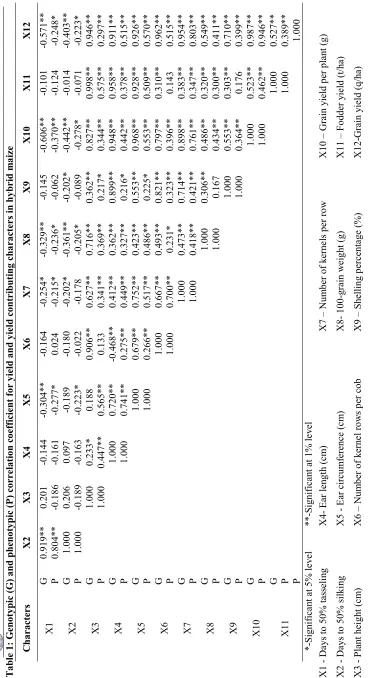
Analysis of variance revealed significant differences for 12 quantitative traits. The phenotypic and
genotypic correlation coefficients among 12
quantitative traits are presented in Table 1. The genotypic correlations in general were higher than the
phenotypic correlation, revealing strong inherent relationship among the characters studied. Grain yield showed highly significant positive correlation
with plant height (Sharma et al., 1982, Tyagi et al.,
1988, Singh et al., 1991, Debnath and Khan 1991,
Krishnan and Natrajan 1995, Packiaraj 1995, Swarnalatha Devi and Shaik Mohammad 2001), ear length, ear circumference (Appadurai and Nagarajan
1975, Alok Kumar et al., 1999, Pradeep Kumar and
Satyanarayana, 2001), number of kernel rows per ear, number of kernels per row (Appadurai and
Nagarajan, 1975, Tyagi et al., 1988, Geetha and
Jayaraman 2000), 100-grain weight (Saha and
Mukherjee, 1985, Tyagi et al., 1988, Umakanth and
Khan, 2001), grain yield per plant (Nawar et
al.,1999), fodder yield per hectare (Krishnan and
Nagarajan, 1995) and shelling per cent. A significant negative association was observed between grain yield and its component traits such as days to 50 per cent taselling and days to 50 per cent silking (Netaji
et al., 2000). The negative correlation of grain yield with days to 50 per cent flowering is very much important for breeder to identify early and late maturing hybrids.
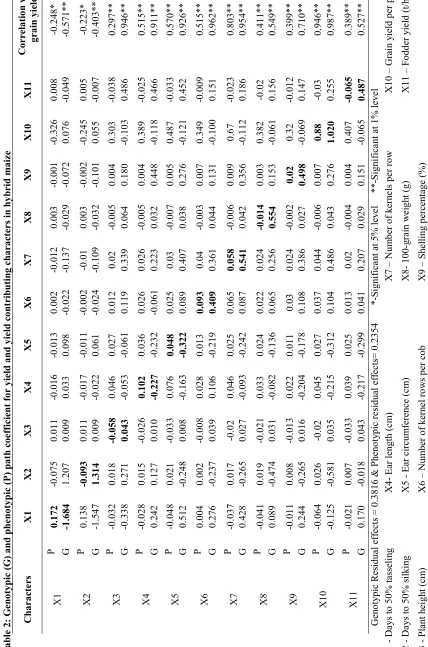
Sometimes, correlation coefficients give misleading results because the correlation between two variables may be due to third factor. It is therefore necessary to analyze the cause and effect relationship between dependent and independent variables to entangle the nature of relationship between the variables. Path co-efficient analysis (Dewey and Lu 1957) furnished a method partitioning the correlation coefficient into direct and indirect effect and provides the information on actual contribution of a trait on the yield.
In the present study, path analysis was used to work out the direct and indirect effects of 11 characters on grain yield are presented in Table 2. The traits which not only have high positive correlation but also have high direct effects are expected to be useful as
selection criteria in selection programme.
Considering this point, days to 50 per cent silking, grain yield per plant, 100-grain weight, number of kernels per row, shelling per cent, fodder yield per hectare, number of kernel rows per ear and plant height had high positive direct effect on grain yield. The results were supported by the earlier findings of Packiaraj (1995) for plant height and 100-grain weight, Manivannan (1998) for number of kernel
rows per ear, number of kernels per row, Gautam et
al (1999) for ear circumference, Krishan and
Electronic Journal of Plant Breeding, 2(2):253-257 (June 2011) ISSN 0975-928X
http://sites.google.com/site/ejplantbreeding 255
number of kernels per row, 100 grain weight, shelling per cent and fodder yield per hectare had high positive indirect effect on grain yield and the findings were in accordance with Swaranalatha Devi and Shaik Mohmmed (2001). The residual effects permit precise explanation about the pattern of interaction of other possible components of yield. The genotypic and phenotypic residual effects recorded 0.3816 and 0.2354 respectively; it indicates the characters used in our experiment explain above 60 per cent of variations which may be contributed to higher yields in maize.
Genetic correlation between different characters of plant often also because of either linkage or plieotrophy (Harland, 1939). The data presented in Table 1 revealed that genotypic correlation coefficient were slightly higher in magnitude than phenotypic once. This low magnitude is due to modifying effects of environment on the associated characters. There was a general agreement in both sign and magnitude between estimates of genotypic and phenotypic correlations. The character which is genotypically but not phenotypically correlated may not be of practical value in selection since selection is based on phenotype.
It may be concluded that plant height, ear length, ear circumference, number of kernel rows per ear, number of kernels per row, 100-grain weight, shelling per cent, grain yield per plant and fodder yield had a significant positive association with yield both at the phenotypic and genotypic levels. Number of kernel rows per cob and number of kernels per row had a direct positive effect on yield both at the phenotypic and genotypic levels which also contributed maximum to higher grain yield compared to the other characters. Thus, selection for these characters could be considered as important selection criteria in improving hybrid maize for high grain yield.
Reference
Appadurai, R. and Nagarajan, R.1975. Hybrid vigour in popcorn. Madras Agric. J., 62: 122-126.
Alok Kumar, Gangashetti and Arju Dahiya, H. G. 1999. Analysis of direct and indirect effects of quantitative traits in diallel crosses of maize. Ann. Biol., 15: 173-176.
Debnath, S. C. and Khan, M. F. 1991. Genotypic variation, covariance and path coefficient analysis in maize.
Pakistan J. Sci. and Industrial Res., 34: 391- 394. Dewey, D, R. and Lu, K. H. 1959. A correlation and path coefficient analysis of component of crested wheat grass seed production. Agron.J.,51: 515-518.
Gautam, A. S., Mittal, R. K. And Bhandari, J. C. 1999. Correlations and path coefficient analysis in maize (Zea mays L.). Ann. Agric. Biotech. Res., 4 : 169-171.
Geetha, K. and Jayaraman, N. 2000. Path analysis in maize (Zea mays L.). Agric. Sci. Digest, 20: 60-61. Grafius, J.E. 1960. Does overdominance exist for yield in
corn? Agron. J., 52: 361.
Harland, S. C. 1939. The genetics of cotton, John Than Cape, London, pp. 18-23.
Johnson, H. W., Robinson, H. F. and Comstock, R. E. 1955. Estimates of genetic and environmental variability in soyabean. Agron. J., 47 : 314-318. Krishnan, V. and Natarajan, N. 1995, Correlation and
component analysis in maize. Madras Agric. J., 82: 391-393.
Manivannan, N. 1998. Character association and component analysis in maize. Madras Agric. J., 85: 293-294.
Nawar, A. A., Fahmi, A. I. and Salma, S. A. 1999. Genetic analysis of yield components and callus growth characters in maize (Zea mays L.). J. Genet.and Plant Breeding, 53: 119-127.
Netaji, S. V. S. R. K., Satyanarayana, E. and Suneetha, V. 2000. Heterosis studies for yield and yield component characters in maize (Zea mays L.).
The AndhraAgric. J., 47: 39-42.
Packiaraj, D. 1995. genetic studies of yield and its components in maize (Zea mays L.). Ph. D. Thesis, Tamil Nadu agricultural University, Coimbatore.
Poehlman, J.M.1997. Breeding Field Crops, 4th ed. Avi. Pub. Co., Inc. Westport, Connecticut, USA. Pradeep Kumar, P. and Satyanarayana, E. 2001. variable
and correlation studies of full season inbred lines of maize. J. Res., ANGARU, 29: 71-75.
Saha, B. C. and Mukherjee, B. K.1985. Analysis of heterosis for number of grains in maize (Zea mays L.). Indian J. Plant Breeding, 45: 240-246. Sharma, S. R., Khera, A. S., Dhillon, B. S. and Malhotra,
V. V. 1982. Evaluation of S1 lines of maize crossed in a diallelic system. Crop Improv., 9: 42- 47.
Singh, S. N., Singh, K. N. and Singh, H. G. 1991. Genetic variability and interrelationship in maize.
Narendra Deva J. Agric. Res., 6: 233-237. Swaranalatha Devi, I. and Shaik Mohmmed .2001.
Character association and path coefficient analysis of grain yield and components in double crosses of maize. Cop Res., 21: 255-359. Tyagi, A. P., Pokhariyal, G. P. and Odongo, O. M. 1988.
Correlation and path coefficient analysis for yield components and maturity traits in maize (Zea mays L.). Maydica, 33: 109-119.
Umakanth, A. V. and Khan, H. A. 2001. Correlation and path analysis of grain yield and yield components in maize (Zea mays L.). J. Res., ANGRAU, 29: 87-90.