Vol. 13, 2018, 41-53
ISSN: 2349-0632 (P), 2349-0640 (online) Published 12 May 2018
www.researchmathsci.org
DOI: http://dx.doi.org/10.22457/jmi.v13a5
41
Journal of
Color Image Segmentation Based on PCNN
Hong-jie Li, Gui-Cang Zhang and Zong-yuan Zhu
School of Mathematics and Statistics, Northwest Normal University Lanzhou 730070, China
Corresponding author. email: [email protected]
Received 5 April 2018; accepted 8 May 2018
Abstract. In view of the ignition characteristics of PCNN, when the traditional PCNN
model is used in image segmentation, the final segmentation images are two valued images. Although the two value image has the advantages of easy identification and convenient storage, but for the following processing of image recognition, image compression and feature extraction, the singleness of two valued image can not meet the needs of people. Therefore, based on the previous work, the maximum Shannon entropy, maximum gray entropy and maximum variance ratio are used to improve the traditional PCNN. The final output of the model has three patterns: color, gray and two values, which is convenient for the subsequent processing of images. Experimental results show that the proposed algorithm can achieve the effective segmentation of color images, and the segmentation effect is significantly better than the traditional algorithm.
Keywords: PCNN; color image; image segmentation; maximum Shannon entropy;
maximum entropy; maximum variance ratio
AMS Mathematics Subject Classification (2010): 62H35
1 Introduction
42
of each component. In order to detect moving objects accurately; the document [2] transforms the image into HSV space to reduce the color difference between the object and the object around it; the document [3] uses the correlation of each component of RGB space to segment true color images, thus reducing the segmentation error. The algorithms for color image segmentation are also emerging in recent years, such as threshold method [4], ant colony algorithm [5], watershed algorithm [6] and so on.
43 great help.
2. PCNN basic model
Eckhorn model is not suitable for image processing because of its many limitations, and many scholars have made a lot of improvements related to it. PCNN model is evolved from the Eckhorn model. Compared with Eckhorn model, it is more suitable for image processing applications, its mathematical model is
∑
− + + − = − ∆ l k kl kl kl ij F ij ijij n e F n S V M Y Y n
F F t
,
, ( 1)
) 1 ( ) ( α
∑
− + − = − ∆ l k kl kl ij L ijij n e L n V M Y n
L L t
,
, ( 1)
) 1 ( ) ( α
))
(
1
)(
(
)
(
n
F
n
L
n
U
ij=
ij+
β
ij) 1 ( ) 1 ( )
(n =e− ∆ ij n− +V Yij n−
ij α t
θ
θθ
θ))
(
)
(
(
)
(
n
step
U
n
n
Y
ij=
ij−
θ
ijIn the formula, subscriptij is the label of neurons, and Sij, Fij, Lij, Uij, θij are
external stimuli, feed inputs, link inputs, internal activations (i.e., pre synaptic potentials) and dynamic thresholds of neuronal ij,M is a connection weight matrix,VF, VLand
θ
V are amplitude constants,β is the link factor,αθ αF, αLare the corresponding
attenuation coefficients,∆tis the time constant,nis the number of iterations,Yij is output.
3. PCNN model segmentation principle
To segment the image by PCNN, each pixel of the M×N image to be segmented corresponds to the neuron of a two-dimensional neural network. The gray value of each pixel is the external stimulus of the corresponding neuron. At the same time, the initial value of the neuron (initial value is 1) and the corresponding threshold θij are initialized,
44
Therefore, the image segmentation can be done by using the similarity of PCNN ignition capture and cluster characteristics.
4. PCNN model segmentation
4.1. Maximum Shannon entropy criterion
For binary images, the Shannon entropy [13] can well reflect the amount of information contained in it. The bigger the Shannon entropy of the binary image generated by the PCNN model is, the better the effect of the iterative segmentation is, and the larger the information content of the original image is. Therefore, the Shannon entropy maximum binary image will be regarded as the best segmentation result in the iterative process. The Shannon entropy is defined as
0 0 1
1
ln
ln
)
(
P
P
P
P
P
H
=
−
−
In the formula, P0 and P1are the probabilities of the pixel values of 0 and 1 in each of the binary images output at each iteration.
4.2. Maximum entropy criterion
The image gray entropy is a statistical characteristics of gray image, which describes the distribution of gray image information space, if the gray image gray entropy is bigger, the more uniform distribution of gray, which contains more information. For a maximum gray level for M×Ngray image ofL. The gray value of pixel number for i is ni, the
corresponding probability is Pi, then the following image gray entropy calculation
ofH :
∑
=
×
−
=
Li
i
i
P
P
H
1
2
log
Among them,
)
/(
M
N
n
P
i=
i×
4.3. Maximum variance ratio criterion
For a double peak gray image, its gray distribution presents a "U" shape, the gray value of the bottom of the "U" is set as a threshold, which can be used to separate the target and background of the image. For the image with gray levelS =(1,2,3,⋯,i,⋯,j), the gray
level T of the image is used as the segmentation threshold, divide the image into two classes, C1and C2 of S1 =(1,2,3,⋯,T), S2 =(T+1,T+2,⋯,L),The intra class variance
2
W
σ and the inter class variance 2
B
σ can be obtained by the lower form
2 2 2 2 1 1
2
ω
σ
ω
σ
45 − + − =
∑
∑
∈1 ∈2
2 2 2
1) ( )
( 1
S
i i S
i
i i n
n i
N µ µ
2 2 2 2 1 1
2
(
)
(
)
T T
B
ω
µ
µ
ω
µ
µ
σ
=
−
+
−
− + − =∑
∑
∈∈1 2
2 2 2
1 ) )
( 1 S i i T i S i
T n n
N µ µ (µ µ
In the formula, N is the total number of pixels 2 1
σ , 2
2
σ is the variance of C1 and
2
C ,ω1 and ω2 are the probability of occurrence of C1 and C2, µ1 andµ2 are the average gray level ofC1 and C2, and µT is the average gray value of the image. The
maximum variance ratio is
=max 22
W B
σ
σ
η
The variance between classes reflects the difference between the two categories of the target and the background in the image, and the class variance represents the difference between the same pixels. When the maximum value of η is obtained, the
variance between classes is the largest and the variance within class is the smallest, that is, the gray values between different pixels are very different, and the gray values between similar pixels are very small. Therefore, when the variance ratio [14] is the maximum, the threshold segmentation is the best.
4.4. Color selection
Choosing the appropriate color space, extracting the components of the color image, and then segmenting them one by one, which is a common method for color image segmentation. HSV and RGB color space is the most widely used space at present. Relative to the HSV space, the correlation of each component in the RGB color space is relatively large, and the use of the PCNN model for the three components segmentation will produce some constraints. Therefore, in the RGB space, each component of the color image is segmented, its fault tolerance is much larger than that in the HSV space, and it does not affect the final result of segmentation because of a few error points of a segmentation component. Therefore, in RGB color space, using PCNN segmentation, combined with a specific combination method, you can get a good segmentation effect.
4.5. Using model segmentation 4.5.1. Gray model
46
only describe the outline of the object, the details of the object is often not well expressed. At this time, a higher gray level is needed to describe the details of the image. Therefore, in this paper, the maximum Shannon entropy is used to filter the binary images generated by iteration, and then the selected binary images are superimposed to obtain a gray level gray image.
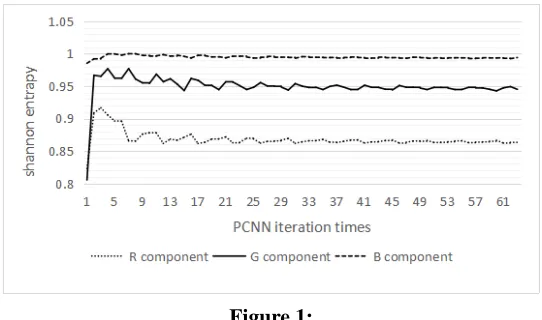
Figure 1:
It can be observed from the broken line graph of Figure 1 that the Shannon entropy of the binary image of R, G and B increases first and then decreases with the iteration of the algorithm, when the iteration is more than 45 times, the Shannon entropy change tends to be stable. Therefore, when the algorithm is iterated to a certain number of times, the output entropy of Shannon is not very different. In order not to make the algorithm to prepare sufficient candidate graphs by infinite iteration, the Shannon entropy H(P) of
forty-fifth iterations of R, G and B is taken as the threshold value, and the images before the forty-fifth iteration are screened out. When the Shannon entropy is greater than or equal to a, the corresponding two value image and retained as candidate grayscale overlay, otherwise it is rejected. Forbinary image after forty-fifth times, because of the difference of Shannon entropy is not big, all of them are used as candidate map of gray superposition
47
will increase with the two value image overlay, when it exceeds Lmin, the algorithm starts recording every superimposed image output gray The degree of entropy, gray level until the gray level reached Lmax. Gray entropy corresponds to the maximum as the maximum gray level of the image. A lot of information superimposed so that it can ensure the superimposed image component map after segmentation can not only retain the original, but also because too many times to avoid the iterative algorithm, the algorithm consumes a long time. In this paper the Lminvalue is set to 120, Lmax will be set to 160.
Figure 2:
From Figure 2, we can see that the gray entropy of G component and B component is the largest when 143 binary images are superimposed, and the gray entropy is the largest when the R component is superimposed to 145. Therefore, 144 is taken as the maximum gray level of the G and B component segmentation overlay graph, and 146 is taken as the maximum gray level of the R component segmentation superposition graph of two
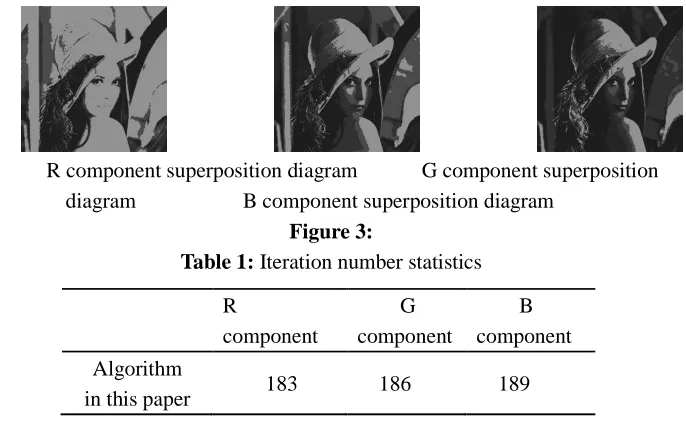
R component superposition diagram G component superposition diagram B component superposition diagram
Figure 3:
Table 1: Iteration number statistics
R
component
G component
B component
Algorithm
48
For stacked Cato, the greater the pixel values of pixels are superimposed times are more and more, in each iterative process, the ignition frequency of the pixel is increased. In other words, In other words, the probability of the pixel as the target point is also greater .In fact, In fact, the superposition process of PCNN binary image is the superposition process of the target area, that is the accumulation process of the target information quantity.
4.5.2. Color mode
Compared with the binary output diagram, the grayscale image can clearly express the depth of different colors, and can accurately describe the different colors on different brightness. However, in the subsequent processing of image recognition and feature extraction, the color features of objects also play an important role. Therefore, it is not enough to obtain only the gray scale after segmentation. In this paper, the grayscale images of different components are merged, so that the segmentation graph with color features is obtained
Figure 4: Color merge diagram 4.5.3. The binary model
We know that, compared with image storage, in the same length, two element features are often much smaller than floating point features, and simple two valued description can solve large-scale real-time visual problems. Therefore, although gray and color images have advantages in information description and color expression, the effect of binary image is not worse than that of gray image and color image under certain circumstances. To this end, this paper redesigned a method to obtain more high-quality binary images
49 Figure 5:
According to the principle of PCNN segmentation, the smaller pixels, the backlight of the hair and the cap, and the background often don't happen the ignition, but the threshold of neurons in these regions decreases with the attenuation coefficient, when its value is less than the set value A, the background point and the small gray level will occur collective ignition phenomenon, after that, the threshold of the corresponding neurons will increase dramatically, which is the oscillation of PCNN segmentation. Because of the presence of PCNN oscillations, The background points are fired once every certain iteration. By superimposing the output binary image, the gray level of the target and the background are concentrated in a pixel segment, so that the gray distribution of the superimposed image appears "U" font, as shown in Figure 5.
In order to obtain binary image with relatively good quality, In this paper, we use the oscillation of PCNN segmentation and the maximum variance ratio to select the appropriate threshold to segment the superimposed image. That is, when the gray value of the pixel is greater than A, the size is set to 1, otherwise the size will be set to 0.According to the maximum variance ratio criterion, the threshold B of the superposition graph is obtained.
Algorithm in this paper Document [10] algorithm Document [13] algorithm Figure 6: Comparison of two value output diagrams
5. Experimental results and simulation
50
256 x 256., the experimental parameters are αF =0.1,αL =2,αE =1, β =0.4,
0.5 F
V = VL =0.2,Vθ =0.3, the connection weight matrix is [-0.03 -0.03 -0.03, -0.03 0
-0.03; -0.03 -0.03 -0.03].
Table 2: Statistics of the number of iterations of each component of the experimental image
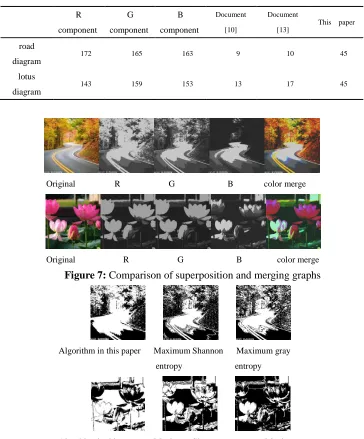
Original R G B color merge
Original R G B color merge
Figure 7: Comparison of superposition and merging graphs
Algorithm in this paper Maximum Shannon Maximum gray
entropy entropy
Algorithm in this paper Maximum Shannon entropy Maximum gray entropy
Figure 8: Comparison of two value output diagrams
R
component
G
component
B
component
Document
[10]
Document
[13]
This paper
road
diagram
172 165 163 9 10 45
lotus
diagram
51
In order to verify the feasibility of the algorithm, the road and lotus pictures are tested, and the results of the experiment are shown in Figure 7. The number of iterations of the R component of the road image is more than that of the iterative method, so the segmentation graph is relatively brighter. The green information of the road map is less, and the number of B component superposition is less, leading to the superposition of the whole picture is dark, especially the forest part is unrecognizable. For the original picture of lotus, its red information is more abundant, therefore, in the superposition of R components, although the maximum gray level is not particularly large, the lotus fraction is completely segmented. Finally, the binary segmentation algorithm designed in this paper is compared with document [10] and document [13]. The images in document [10] and document [13] are richer in details, but at the same time they contain a large amount of background information and noise. On the contrary, the binary of the output of this method in this paper can preserve most of the original target information and is less affected by noise, so it is a more effective segmentation method.
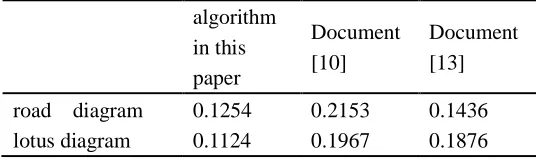
In order to further verify the effectiveness of the algorithm, the error misclassification rate is used to quantitatively evaluate the proposed algorithm and the literature [10] and [13], as shown in table 4.
The error misclassification rate is the percentage of all pixels in the entire ideal image that are erroneously segmented. The expression is
| |
| |
2 1
1 1
∑
∑
=
= −
= c
q q c
q
q q
n n m r
In the formula,mq is the number of pixels in the region marked asq in the
segmentation result, and q=1,2,⋯,c is the number of pixels in the ideal segmentation image which belongs to the label q region, q=1,2,⋯,c.
It can be seen from table 4 that the error misclassification rate of the proposed algorithm is lower than that of references [10] and [13], which further demonstrates the effectiveness of the proposed algorithm.
algorithm in this paper
Document [10]
Document [13]
road diagram 0.1254 0.2153 0.1436
lotus diagram 0.1124 0.1967 0.1876
52 6. Conclusion
On the basis of PCNN, the maximum Shannon entropy and the maximum gray entropy are used to segment the image, gray images and color images with large amount of information are obtained. This is of great help to the subsequent processing of segmentation (e.g. image recognition, image compression, feature extraction, etc.).In addition, a new binary image segmentation method is proposed by using the maximum Shannon entropy and the maximum variance ratio. A large number of experiments show that the segmentation method proposed in this paper can not only preserve the texture and edge information of binary images, moreover, the brightness feature of gray image and the color feature of color image can be obtained. This will greatly improve the accuracy of image compression, recognition and other follow-up processing. At the same time, this algorithm is the first attempt to select and stack the binary image of the traditional PCNN algorithm to get three better segmentation patterns. Therefore, there are also some problems. Because the segmentation graph of the three models is obtained by a large number of iterations, the designed algorithm gets better results, but the running time is relatively long. Therefore, how to optimize the model and make the algorithm more efficient is the focus of the future research.
Acknowledgement. The work is supported by Gansu science and technology program of
PR China (No.17YF1FA119).
REFERENCES
1. C.Qianxia, L.Gang and Z.Ming han, Iris detection based on color segmentation, Computer Engineering, 31(19) (2005) 173-175.
2. Z.Xuechun and Q.Feihu, Technology of automatic license plate recognition based on color segmentation, Journal of Journal of Shanghai Jiao Tong University, 32(10) (1998) 4-9.
3. Y.Kangye, Wu Gang, Color image based on color similarity of RGB model Image segmentation, Application of Computer System, 22(3) (2013) 128-131.
4. N.A.Otsu, Threshold selection method from gray level histogram, IEEE Transaction
on Systema, Man and Cybemetics, 9(1) (1979) 62-66.
5. Tian Jian, He Kun, Zhou Jiliu, et al., An ant colony optimization algorithm for image edge detection, IEEE Congress on Evolutionary Computation, (2008) 751-756. 6. L.Jiahong, L.Jie and Z.Jiancheng, Color image segmentation algorithm based on
watershed and automatic seed region growing, Chinese Journal of Image and
Graphics, 15(1) (2010) 63-68.
53
Computation, 2(3) (1990) 293-307.
8. F.Yong, Q.Feihu and P.Bingzhen, PCNN implementation and application in image processing, J. Infrared and Millimeter Waves, 24(4) (2006) 291-295.
9. Q Li, X Zhou, A Gu, et al., Nuclear norm regularized convolutional Max Pos@ Top
machine, Neural Computing and Applications, (2016) Available: http://dx.doi.org
/10.1007/s00521-016-2680-2.
10. Liu Qing, Ma Xiaoshu, Zhang Lijun et al, An automatic segmentation algorithm for color images based on vector PCNN, Computer Application and Software, 28(12) (2011) 54-56.
11. Bao Qingfeng and Wang Jicheng, A new method of color image segmentation based
on PCNN, Computer Engineering and Application, 27(3) (2005) 48-50.
12. Tan Yingfang, Zhou Dongming, Zhao Dongfeng, et al., Color image segmentation and edge detection based on unit-linking PCNN and image entropy, Computer
Engineering and Application, 45(12) (2009) 174-177.
13. Ma Yide, Dai Ruolan and Li Lian, An automatic image segmentation method based on pulse coupled neural network for image entropy, Journal of Communications, 23(1) (2002) 46- 51.
14. Z.Nanning et al., Computer vision and pattern recognition, Int. J. Comput.
Math., 84(9) (2007) 1265-1266.