IJPAR |Vol.6 | Issue 2 | April - June -2017 Journal Home page: www.ijpar.com
Research article Open Access
Efficient and economic spectroscopic method for determination and
validation of atenolol
Sumita Singh
1*, Kunal Arora
21
Department of Pharmaceutics, Kharvel Subharti College of Pharmacy, Swami Vivekanand Subharti
University, Meerut, 250005, Uttar Pradesh, India
2
Department of Pharmaceutics, NKBR College of Pharmacy and Research Centre, Meerut, 245206,
Uttar Pradesh, India
*Corresponding Author: Sumita Singh Email: [email protected]
ABSTRACT
The aim of this work was focused on to determine and validate an efficient, economic, accurate, simple spectroscopic method for the determination of atenolol in bulk drugs. The spectroscopic method was performed using a double beam UV-visible spectrophotometer (1700, Pharmaspace, Shimadzu, Kyoto, Japan). Dilutions of different concentration were prepared using solvents of different pH (2.5, 4.5, 6.5) and absorbance of the solution was determined. Validation was performed by maximum absorbance for each buffer and λmax was 224.30, 224.50 and 225.00 for pH 2.5, 4.5, and 6.5 respectively. Accuracy, interday and intraday precision, recovery and linearity studies were performed. Limit of detection (0.133, 0.133 and 0.2938 for pH 2.5, 4.5 and 6.5 respectively), and limit of quantification (0.404, 0.404 and 0.8905 for pH 2.5, 4.5, and 6.5 respectively). Hence, this method can be recommended for the estimation and validation of atenolol in bulk drugs and in pharmaceutical dosage form.
Keywords:
Specrtoscopic method, Accuracy, Precision, Limit of determination, Limit of quantificationINTRODUCTION
Atenolol is relatively selective β-blocker (Beta-adrenoceptor antagonist) having low lipid solubility. It is incompletely absorbed orally, but first pass metabolism is not significant. Atenolol show longer duration of action hence once a daily dose is sufficient. Side effect related to CNS action is less likely [1]. No deleterious effects on lipid profile have been noted. It is excreted almost entirely as unchanged drug, 35- 50% of a normal
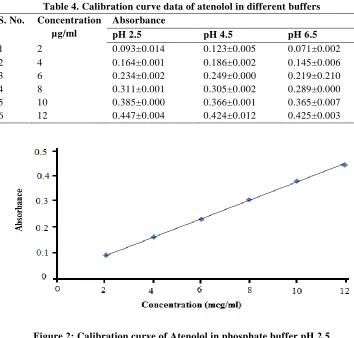
dose being excreted in the urine and 30-50% in the faeces in 24 hour [10]. Chemically it is known as (RS) – 2[4-[2-hydroxy-3-(propanyl-2-amino) propoxy] phenyl] acetamide. Molecular formula of Atenolol is C14H22N2O3. Melting point is 152-155℃ and it is white or almost white powder. It is odorless and slightly bitter. pKa and Log P(octanol/water) of the Atenplol is 9.6 and 0.23 respectively. Melting point of this drug is 152-155℃. Solubility of this drug in different solvents summarize in the table given below.
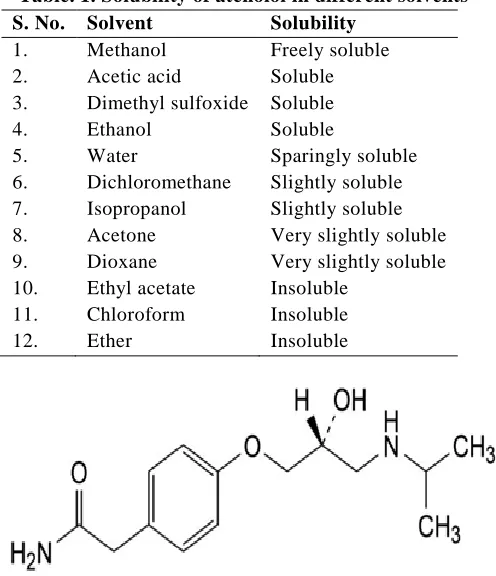
Table. 1. Solubility of atenolol in different solvents
S. No. Solvent Solubility
1. Methanol Freely soluble
2. Acetic acid Soluble
3. Dimethyl sulfoxide Soluble
4. Ethanol Soluble
5. Water Sparingly soluble
6. Dichloromethane Slightly soluble
7. Isopropanol Slightly soluble
8. Acetone Very slightly soluble
9. Dioxane Very slightly soluble
10. Ethyl acetate Insoluble
11. Chloroform Insoluble
12. Ether Insoluble
Figure 1: Chemical structure of atenolol
Many attempts have already been made for the estimation of Atenolol in pharmaceutical preparations but they are very complicated [3,4,5,15,16]. UV spectroscopy is a very simple and effective method for the estimation of Atenolol in any dosage form. Atenolol is a suitable drug for floating drug delivery system [2]. Present research was a part of development of a floating drug delivery system of atenol. Hence all the buffers used here are according to the suitability of floating drug delivery system.
MATERIALS AND METHODS
Instruments
A double beam UV-visible spectrophotometer (1700, Pharmaspace, Shimadzu, Kyoto, Japan) connected to a computer loaded with spectra manager software UV probe was employed with a pair a 1 cm quartz cells for all analytical work. All weights were taken on digital electronic balance (Sansui electronic, Tokyo, Japan). Buffer’s pH was measured by a digital pH meter (Hicon®, Grover Enterprises, Delhi).
Materials
Pure drug, Atenolol as a gift sample from IPCA Lab. Ltd., Ratlam, India, concentrated hydrochloric acid was provided by RFCL Limited, New Delhi, potassium dihydrogen phosphate provided by RFCL Limited, New Delhi and disodium hydrogen orthophosphate was provided by S.D. Fine-Chem Limited, Mumbai.
UV Spectrophotometric studies
Atenolol (50mg) was accurately weight and transferred to a 50ml volumetric flask. It was dissolved and diluted to 50ml with phosphate buffer pH 2.5 to obtained a final concentration of 100μg/ml. Dilutions were made to obtained a concentration of 25μg/ml and scanned for λmax in the range of 200-400nm in the spectrum basic mode [13,14].
Selection of media
Three pH values were selected based on the variable pH values in fed state gastric conditions for preparation of calibration curves. The pH selected were labeled as
Intermediate – pH 4.5
Extreme 2 – pH 6.5
Scanning for λ
maxAtenolol (5 mg) was accurately weight and transferred to a 50 ml volumetric flask. It was dissolved and diluted to 50 ml with phosphate buffer pH 2.5. Similarly solutions of drug were made in phosphate buffer pH 4.5 and phosphate buffer pH 6.5. All the three stock solutions of drug of 100 μg/ml in varying pH were diluted separately to get a final concentration of 25 μg/ml. The resultant solution was scanned for λmax in 200-400 nm in the spectrum basic mode [4,6,7].
Preparation of calibration curves
Aliquots of the stock solution of Atenolol (100 μg/ml) were pipette out into a series of 10ml volumetric flask and diluted with phosphate buffer pH 2.5 to get final concentration in the range of 2-12 μg/ml. the absorbance of the resultant were measured at 224.3 nm for phosphate buffer pH 2.5, 224.5 nm for phosphate buffer pH 4.5 and 225 nm for phosphate buffer pH 6.5. Freshly prepared solutions were made for the calibration curves on six consecutive days [8,9]. Calibration curve was subjected linear regression analysis10.
Validation
of
UV
Spectrophotometric
methods for determination of atenolol
Calibration curves of Atenolol were validated as per the USP guidelines for assay in category I and as per ICH Q2A guidelines [4]. The linearity of the calibration curve was determined by plotting the absorbance of atenolol (y) versus the nominal concentration (x) of riboflavin in the concentration range of 2-12 μg/ml. the accuracy of the method was performed by adding known amounts of atenolol to placebo solution and then comparing the average measured concentration to the nominal concentration, and was expressed in percentage. Precision was evaluated by calculating the relative standard deviation (R.S.D.) of measured concentration at each sample [11,12].
RESULT AND DISCUSSION
UV Spectrophotometric study
Spectrophotometric study was carried out in order to determine the λmax of atenolol in pH 2.5 phosphate buffer, pH 4.5 phosphate buffers and pH 6.5 phosphate buffer. 25 µg/ml solution of atenolol in the test medium when scanned for absorption maxima in the range of 200- 400 nm, exhibited the result tabulated in Table 3.1.
Table 2. Scanned λmax of different sample of atenolol prepared in phosphate buffer pH 2.5, 4.5 and 6.5.
S. No. Strength pH of the medium Experimental λmax
1 25 µg/ml 2.5 224.3 nm
2 25 µg/ml 4.5 224.5 nm
3 25 µg/ml 6.5 225.0 nm
The scanned λmax were found to be similar as that of reported λmax was 225 nm.
Calibration Curves
Selection of media
Fasting state pH is usually steady and approximates < 2 and food buffers neutralizes gastric acid, thus increasing the pH up to about 6.5 (Dressman et al 1990). Floating drug delivery systems are usually administered in fed state, as during the fed state onset of MMC is delayed resulting in slowdown of gastric emptying rate.
Therefore, three pH 2.5, 4.5 and 6.5 corresponding to fed state conditions for preparation of calibration curves were selected.
Scanning for λ
maxThe solution of atenolol having a concentration of 25µg/ml in different phosphate buffer pH 2.5, pH 4.5 and pH 6.5 were scanned for λmax in the range of 200-400nm. The results are tabulated in Table 3.3 and met with the literature.
Table 3. Scanned of atenolol for λmax using different phosphate buffers
S. No. Solvents Experimental λmax
Preparation of calibration curves
Calibration curve of atenolol were prepared in phosphate buffer pH 2.5 at λmax of 224.3 nm in the concentration range of 2 - 12 µg/ml. Absorbance was determined and linearity was observed with r2
value near to unity. Similarly, calibration curves were prepared in phosphate buffer 4.5 at λmax 224.5 nm, and pH 6.5 at λmax 225 nm. The results are given in Table 3.3 and represented in Figure 3.2, 3.3 and 3.4.
Table 4. Calibration curve data of atenolol in different buffers
S. No. Concentration
µg/ml
Absorbance
pH 2.5 pH 4.5 pH 6.5
1 2 0.093±0.014 0.123±0.005 0.071±0.002
2 4 0.164±0.001 0.186±0.002 0.145±0.006
3 6 0.234±0.002 0.249±0.000 0.219±0.210
4 8 0.311±0.001 0.305±0.002 0.289±0.000
5 10 0.385±0.000 0.366±0.001 0.365±0.007
6 12 0.447±0.004 0.424±0.012 0.425±0.003
Figure 2: Calibration curve of Atenolol in phosphate buffer pH 2.5
Figure 4: Calibration curve of atenolol in phosphate buffer pH 6.5
Validation of calibration curves
Validation of an analytical method is the process by which it is established, by laboratory studies, that the performance characteristic of the method meets the requirement for the intended analytical applications. Assay validation must demonstrate that the analytical procedure is able to accurately and precisely predict the concentration of unknown samples. The calibration curves have thus been validated for the assay of active constituent i.e. atenolol, using the following discussed parameters.
Precision and accuracy
The precision of an analytical method is the degree of agreement among individual test result when the procedure is applied repeatedly to multiple sampling of the homogeneous sample. The precision of an analytical method is usually expressed as the standard deviation or RSD of a series of measurements. Percent relative standard deviation (RSD) was calculated, which should be less than 2%. The summaries of intra-day precision and accuracy are listed in Table 3.5 for calibration curve of atenolol prepared in phosphate buffer pH 2.5, pH 4.5 and pH 6.5.
Table 5. Intra-day precision study for calibration curves prepared in different pH
Sample concentration (μg/ml) %RSD
pH 2.5 pH 4.5 PH 6.5
2 1.178 0.024 0.006
4 0.036 0.008 0.032
6 0.006 0.000 0.010
8 0.006 0.007 0.017
10 0.000 0.004 0.014
12 0.006 0.004 0.006
Linearity
Linearity of an analytical method is its ability to elicit test results that are directly, or by a well- defined mathematical transformation, proportional to the concentration of the analyte in samples within a given range. The calibration curve of atenolol was linear in the range of 2 - 12µg/ml. The linear regression equation of atenolol with their
intercept (a) and slope (b) in each pH with their r2 value are presented in Table 3.6.
Limit of detection and limit of quantification
lowest concentration of the analyte in a sample that can be determined with acceptable precision and accuracy under the stated experimental conditions. These two parameters are required for assay validation as per ICH Q2A guidelines. Limit of
detection and limit of quantitation of calibration curves were calculated which was based on the standard deviation of y – intercept of regression line (SD). Both are given in Table 3.6.
Table 6. Validation parameters for calibration curve considering linearity, range, LOD and LOQ prepared in different pH
Parameters pH 2.5 pH 4.5 pH 6.5
Linearity r2 0.9996 0.9998 0.9998 Intercept(a) 0.0214 0.07 0.0048 Slope (b) 0.0358 0.0297 0.0336 Range (μg/ml) 2 – 12 2 – 12 2 – 12
LOQ (μg/ml) 0.404 0.404 0.8905
LOD (μg/ml) 0.133 0.133 0.2938
RECOVERY
The experiments were repeated three times at 4, 6 and 8 μg/ml of atenolol. The values of mean
recoveries are listed in Table 3.7 and results showed that the percent recoveries of atenolol are ranged from 98.28 to 100.59.
Table 7. Recovery studies of calibration curve of atenolol prepared in different pH
Sample concentration (μg/ml) % Recovery
pH 2.5 pH 4.5 pH 6.5
4 100.14 99.33 99.34
6 101.43 100.45 100.53
8 101.58 100.59 98.28
CONCLUSION
The proposed spectroscopic method was effective, economic, simple, accurate and precise than existing methods. This developed method in differs from already existing method in the aspects of determination and validation of atenolol in the
solution of different pH, using simple solvents. Method validation was performed by testing its linearity, accuracy, precision, LOD, LOQ, and recovery. Hence, this method can be recommended for the estimation of atenolol in bulk drug and pharmaceutical dosage forms.
REFERENCES
[1]. Arora, S, Ali, J, Ahuja, A, Khar, K. R, Baboota S. Floating drug delivery systems: A Review. AAPS
PharmSciTech, 6, 2005, E372-E390.
[2]. Jain, S. K. and Jangdy, M. S. Lectin conjugated gastroretentive multiparticulate delivery system of clarithromycin for the effective treatment of Helicobacter pylori. Molecular Pharmaceutics, 6(1), 2008, pp. 295-304.
[3]. Ravichandran V, Shalini S, Sundram KM, Harish R. Validation of analytical method – strategies and importance, Int J Pharm Pharm Sci 2, 2010, 18-22.
[4]. Text on Validation of Analytical Procedures Q2 (R1) in, I.C.H.Harmonised Tripartite Guidelines; Nov. 1996. [5]. Singh S, Bali V, Pathak K. Development and validation of a novel spectrophotometric analytical method for
[6]. Kallem RR, Mullangi R, Hotha KK, Spoorthy YN. Simultaneous estimation of amlodipine and atenolol in human plasma a sensitive lc-ms/ms method validation and its application to a clinical pk study. Bio analysis, 5(7), 2013, 827-37.
[7]. Sridharan D, Thenmozhi A, Sundarananda SV. Bioanalytical method development and validation of atenolol n human plasma by lcms. Asi J Pharm Clini Resea, 3(2), 2010, 92-94.
[8]. Nikita DP, Anandkumari DC, Kreny EP. Development and validation of hptlc method for simultaneous determination of atenolol and losartan potassium in bulk and in pharmaceutical dosage form. Int J Pharm Pharm Sci, 5(2), 2012, 325-331.
[9]. Agon P, Goethals P, Van HD, Kaufman JM. Permeability of the blood brain barrier for atenolol by positron emission tomography. J Pharm Pharmacol, 43(8), 1991, 597-600.
[10].Carlberg B, Samuelsson O, Lindholm LH. Atenolol in hypertension is it a wise choice. Lancet, 364(9446), 2004, 1684-9
[11].Lalitha G, Salomi P, Ravindra RK. Development of an analytical method and its validation for the analysis of atenolol in tablets dosage form by uv-spectrophotometry. I J P P S, 5(2), 2013, 197-199.
[12].Lalitha KV, Jyothi RK, Padma B. UV spectrophotometric method development and validation of atenolol and losartan potassium by q analysis. I Bull Drug Resea, 3(4), 2013, 54-62.
[13].Dey S, Sarkar S, Malakar J, Ghosh A. Spectrophotometric method for simultaneous of atenolol and atorvastatin in tablet dosage forms, Int J Pharm Biomed Res, 3(1), 2012, 40- 43
[14].Vidhya BK, Sunil DR. Validated hplc method for simultaneous quantitation of amlodipine besylate, atenolol and aspirin in bulk drug and formulation. J P B M S, 17(9), 2012, 1-6.
[15].Kavita J, Muralidharan S. Development and validation of new method for atenolol, hydrochlorothiazide and losartan potassium by rp-hplc. I J C T R, 2(2), 2010, 880-884.