A Four Variable Model On The Risk Level of Viet Nam Hardware Industry During
and After The Global Crisis
Dinh Tran Ngoc Huy
Banking University HCMC Viet Nam-GSIM, International University of Japan, Japan. Email: [email protected]
Article Received: 09 October 2017 Article Accepted: 29 November 2017 Article Published: 15 December 2017
1.
I
NTRODUCTIONFinancial leverage has certain effects on the risk level of listed companies on stock exchange. Flifel (2012) stated
today, the assumption of efficient capital markets is very controversial, especially in these times of crisis, and is
challenged by research showing that the pricing was distorted by detection of long memory. Gabrijelcic et all
(2013) find a significant negative effect of leverage on firm performance. And firms that had some foreign debt
financing performed better than their counterparts.
Measuring beta is a popular method used in many models such as the famous CAPM model. The Viet Nam
hardware industry is selected for the research because until now there is no research published with the same scope
and because Viet Nam hardware industry is considered as one of developing economic sectors in the local market,
which has some positive effects for the economy. The purpose of this study, therefore, to find out how much market
risk for this industry in changing contexts of financial leverage.
We mention some issues on the estimating of impacts of external financing on beta for listed tourism industry
companies in Viet Nam stock exchange as following:
Issue 1:
Whether the risk level of hardware industry firms under the different changing scenarios of leverage
increase or decrease so much.
Issue 2:
Whether the disperse distribution of beta values become large in the different changing scenarios of
leverage estimated in the hardware industry.
A B S T R A C T
This paper is organized as follow. The research issues and literature review will be covered in next sessions 2 and 3,
for a short summary. Then, methodology and conceptual theories are introduced , then, empirical analysis,
discussion and conclusion. This paper also supports readers with references, exhibits and relevant web sources.
2. THEORETICAL
BACKGROUND
A. Conceptual theories
The impact of financial leverage on the economy
Financial development and economic growth are positively interrelated. The interaction between these two (2)
fields can be considered as a circle, in which good financial development causes economic growth and vice versa.
A sound and effective financial system has positive effect on the development and growth of the economy.
Financial institutions and markets can enable corporations to solve liquidity needs and enhance long-term
investments. This system include many channels for a firm who wants to use financial leverage or FL, which refers
to debt or to the borrowing of funds to finance a company’s assets.
In a specific industry such as hardware industry, on the one hand, using leverage with a decrease or increase in
certain periods could affect tax obligations, revenues, profit after tax and technology innovation and compensation
and jobs of the industry.
B. Methodology
For calculating systemic risk results and leverage impacts, in this study, we use the live data during the crisis period
2009-2011 from the stock exchange market in Viet Nam (HOSE and HNX and UPCOM). In this research,
analytical research method is used, philosophical method is used and specially, leverage scenario analysis method
is used. Analytical data is from the situation of listed hardware industry firms in VN stock exchange and curent tax
rate is 25%. Generally speaking, quantitative method is mainly used in this study whith a note that risk measure
asset beta is mainly derive from equity beta and financial leverage. Finally, we use the results to suggest policy for
both these enterprises, relevant organizations and government.
C. Previous Studies
Fama, Eugene F., and French, Kenneth R., (2004) also indicated in the three factor model that “value” and “size”
are significant components which can affect stock returns. They also mentioned that a stock’s return not only
depends on a market beta, but also on market capitalization beta. The market beta is used in the three factor model,
developed by Fama and French, which is the successor to the CAPM model by Sharpe, Treynor and Lintner.
Dimitrov (2006) documented a significantly negative association between changes in financial leverage and
contemporaneous risk-adjusted stock returns. Aydemir et all (2006) identified in an economy with more realistic
variation in interest rates and the price of risk, there is significant variation in stock return volatility at the market
systematic sources of risk and they affect asymmetrically low and high leverage firms. And temporary shocks are
relatively more important for low leverage firms, and that financial distress risk seems to be captured by the
sensitivity of firms' cash flow innovations to market discount rate news.
Umar (2011) found that firms which maintain good governance structures have leverage ratios that are higher
(forty-seven percent) than those of firms with poor governance mechanisms per unit of profit. Chen et all (2013)
supported regulators' suspicions that over-reliance on short-term funding and insufficient collateral compounded
the effects of dangerously high leverage and resulted in undercapitalization and excessive risk exposure for
Lehman Brothers. The model reinforces the importance of the relationship between capital structure and risk
management. Then, Alcock et all (2013) found evidence that leverage cannot be viewed as a long-term strategy to
enhance performance, but in the short term, managers do seem to add significantly to fund excess returns by
effectively timing leverage choices to the expected future market environment. And Gunaratha (2013) revealed that
in different industries in Sri Lanka, the degree of financial leverage has a significant positive correlation with
financial risk. Finally, financial leverage can be considered as one among many factors that affect business risk of
consumer good firms.
3
. EMPIRICAL
ANALYSIS
3.1 General Data Analysis
The research sample has total 22 listed firms in the hardware industry market with the live data from the stock
exchange. Equity beta values of these firms are estimated with the using of financial leverage to calculate asset beta
values of them. Then, we change the leverage from what reported in F.S 2011 to increasing 30% and reducing 20%
to see the sensitivity of beta values. We found out that in 3 cases, asset beta mean values are estimated at time point
t0 : 0,43, 0,44 and 0,45, which increases little more if competitor size is smaller and at time point t1: 0,44, 0,39,
0,43 which are sensitive and decrease more if competitor size dobles. Hence, in 2 different fiscal years, the risk is
changed in different dimensions with the competitor selecting strategy. Leverage degree changes definitely has
certain effects on risk values.
3.2 Empirical Research Findings and Discussion
First, we select two (2) points of time, with different capital structure values, to estimate fluctuations of beta values:
+ at time point t0 : at the end of the fiscal year 2010 or the beginning of year 2011
+ at time point t1 : for the whole year 2011
We pay attention to competitor and leverage may vary dependent on time point.
In the below section, data used are from total 22 listed hardware industry companies on VN stock exchange (HOSE
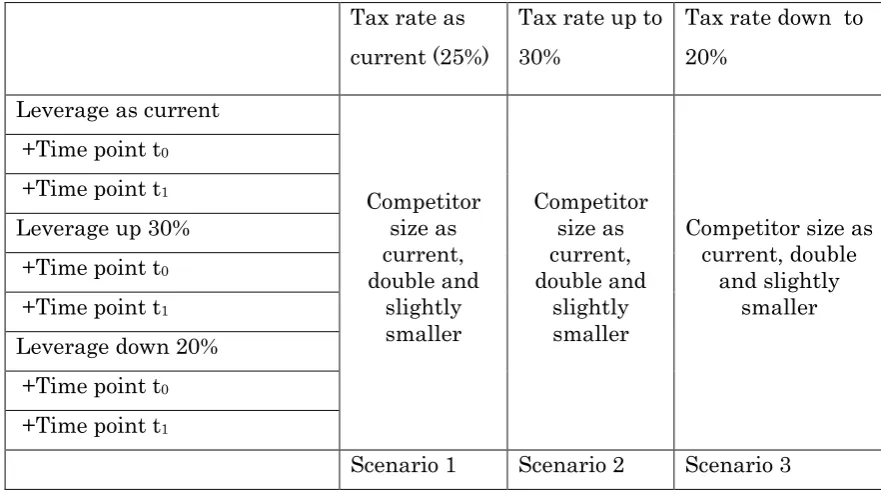
and HNX mainly). In the scenario 1, current tax rate is kept as 25% then changed from 20% to 28%. Then, three (3)
FL scenarios are changed up to 30% and down to 20%, compared to the current FL degree. In short, the below table
1 shows three scenarios used for analyzing the risk level of these listed firms.
Table 1 – Analyzing market risk under three (3) scenarios (Made by Author)
Tax rate as
current (25%)
Tax rate up to
30%
Tax rate down to
20%
Leverage as current
Competitor
size as
current,
double and
slightly
smaller
Competitor
size as
current,
double and
slightly
smaller
Competitor size as
current, double
and slightly
smaller
+Time point t
0+Time point t
1Leverage up 30%
+Time point t
0+Time point t
1Leverage down 20%
+Time point t
0+Time point t
1Scenario 1
Scenario 2
Scenario 3
a. Scenario 1: current tax rate 25% and leverage kept as current, 20% down and 30% up, under the condition that
competitor size kept as current, double and smaller and beta values estimated at two time points (t0 and t1).
In this case, all beta values of 22 listed firms on VN hardware industry market as following:
Table 2 – Market risk of listed companies on VN hardware industry market under a 4 factors model (case 1)
(source: VN stock exchange 2012)
Order No.
Company stock code
Equity beta Asset beta
Competitor
as current Double
Slightly smaller
Competitor
as current Double
Slightly smaller
1
CMT (FL current t
zero)
0,665 0,665 0,665 0,373 0,373 0,373
CMT (FL current
t1)
0,665 0,665 0,665 0,326 0,326 0,326CMT (Fl up t zero) 0,665 0,665 0,665 0,285 0,285 0,285
CMT (Fl up t1) 0,665 0,665 0,665 0,224 0,224 0,224
CMT (Fl down t zero) 0,665 0,665 0,665 0,432 0,432 0,432
CMT (Fl down t1) 0,665 0,665 0,665 0,394 0,394 0,394
2
SVT (t zero)
0,589 0,536 1,046 0,465 0,423 0,826SVT ( t1)
0,860 0,212 0,860 0,651 0,161 0,651SVT (FL up t zero) 0,589 0,536 1,046 0,428 0,389 0,760
SVT (FL up t1) 0,792 -0,059 0,792 0,543 -0,040 0,543
SVT (FL down t zero) 0,589 0,536 1,046 0,490 0,446 0,870
SVT (FL down t1) 0,903 0,392 0,903 0,728 0,316 0,728
3
VIE (t zero)
0,191 0,498 0,267 0,045 0,118 0,063VIE (t1)
0,283 0,263 0,131 0,054 0,050 0,025VIE (Fl up t zero) 0,191 0,498 0,267 0,002 0,004 0,002
VIE (Fl up t1) -0,085 -0,079 -0,022 0,004 0,004 0,001
VIE (Fl down t1) 0,498 0,463 0,292 0,176 0,163 0,103 4
HPT (t zero)
0,429 0,409 0,429 0,102 0,098 0,102HPT (t1)
0,238 0,113 0,238 0,063 0,030 0,063HPT (Fl up t zero) 0,429 0,409 0,429 0,005 0,004 0,005
HPT (Fl up t1) 0,041 0,019 0,041 0,002 0,001 0,002
HPT (FL down t zero) 0,429 0,409 0,429 0,168 0,160 0,168
HPT (FL down t1) 0,356 0,169 0,356 0,146 0,069 0,146
5
NIS (t zero)
0,124 0,768 0,411 0,054 0,334 0,179NIS (t1)
0,347 0,487 0,347 0,165 0,231 0,165NIS (FL up t zero) 0,124 0,768 0,411 0,033 0,204 0,109
NIS (FL up t1) 0,243 0,341 0,243 0,077 0,108 0,077
NIS (FL down t zero) 0,124 0,768 0,411 0,068 0,421 0,225
NIS (FL down t1) 0,411 0,577 0,411 0,238 0,335 0,238
6
TST (t zero)
0,739 0,739 0,739 0,200 0,200 0,200TST (t1)
0,739 0,739 0,739 0,236 0,236 0,236TST (FL up t zero) 0,739 0,739 0,739 0,038 0,038 0,038
TST (FL up t1) 0,739 0,739 0,739 0,085 0,085 0,085
TST (FL down t zero) 0,739 0,739 0,739 0,308 0,308 0,308
TST (FL down t1) 0,739 0,739 0,739 0,337 0,337 0,337
7
ST8 (t zero)
0,891 0,891 0,891 0,639 0,639 0,639ST8 (t1)
0,891 0,891 0,891 0,682 0,682 0,682ST8 (Fl up t zero) 0,891 0,891 0,891 0,563 0,563 0,563
ST8 (Fl up t1) 0,891 0,891 0,891 0,619 0,619 0,619
ST8 (Fl down t zero) 0,891 0,891 0,891 0,689 0,689 0,689
ST8 (Fl down t1) 0,891 0,891 0,891 0,724 0,724 0,724
8
TAG (t zero)
0,632 0,632 0,632 0,449 0,449 0,449TAG (t1)
0,632 0,632 0,632 0,411 0,411 0,411TAG (FL up t zero) 0,632 0,632 0,632 0,394 0,394 0,394
TAG (FL up t1) 0,632 0,632 0,632 0,345 0,345 0,345
TAG (FL down t zero) 0,632 0,632 0,632 0,486 0,486 0,486
TAG (FL down t1) 0,632 0,632 0,632 0,455 0,455 0,455
9
POT (t zero)
1,046 1,046 1,046 0,606 0,606 0,606POT (t1)
1,046 1,046 1,046 0,533 0,533 0,533POT (Fl up t zero) 1,046 1,046 1,046 0,475 0,475 0,475
POT (Fl up t1) 1,046 1,046 1,046 0,379 0,379 0,379
POT (Fl down t zero) 1,046 1,046 1,046 0,694 0,694 0,694
POT (Fl down t1) 1,046 1,046 1,046 0,636 0,636 0,636
10
CKV (t zero)
0,604 0,604 0,604 0,197 0,197 0,197CKV (t1)
0,604 0,604 0,604 0,221 0,221 0,221CKV (Fl up t zero) 0,604 0,604 0,604 0,076 0,076 0,076
CKV (Fl up t1) 0,604 0,604 0,604 0,106 0,106 0,106
CKV (FL down t zero) 0,604 0,604 0,604 0,279 0,279 0,279
CKV (FL down t1) 0,604 0,604 0,604 0,297 0,297 0,297
11
ONE (t zero)
0,695 0,522 0,724 0,232 0,174 0,241ONE (t1)
0,551 0,294 0,551 0,217 0,116 0,217ONE (FL up t zero) 0,695 0,522 0,724 0,092 0,069 0,096
ONE (FL up t1) 0,314 0,167 0,314 0,067 0,036 0,067
ONE (FL down t
zero) 0,695 0,522 0,724 0,324 0,244 0,338
ONE (FL down t1) 0,695 0,371 0,695 0,358 0,191 0,358
PMT (t1)
1,234 1,191 1,191 1,056 1,019 1,019PMT (FL up t zero) 1,191 1,234 1,234 0,953 0,987 0,987
PMT (FL up t1) 1,191 1,191 1,191 0,967 0,967 0,967
PMT (FL down t
zero) 1,234 1,234 1,234 1,082 1,082 1,082
PMT (FL down t1) 1,191 1,191 1,191 1,054 1,054 1,054
13
SMT (t zero)
0,100 0,403 0,831 0,068 0,274 0,564SMT (t1)
0,934 0,369 0,826 0,654 0,258 0,578SMT (Fl up t zero) 0,100 0,403 0,831 0,058 0,235 0,484
SMT (Fl up t1) 0,805 0,230 0,738 0,492 0,141 0,450
SMT (Fl down t zero) 0,100 0,403 0,831 0,074 0,300 0,618
SMT (Fl down t1) 0,963 0,467 0,882 0,732 0,355 0,671
14
UNI (t zero)
1,186 1,186 1,186 0,771 0,771 0,771UNI (t1)
1,186 1,186 1,186 0,732 0,732 0,732UNI (FL up t zero) 1,186 1,186 1,186 0,647 0,647 0,647
UNI (FL up t1) 1,186 1,186 1,186 0,596 0,596 0,596
UNI (FL down t zero) 1,186 1,186 1,186 0,854 0,854 0,854
UNI (FL down t1) 1,186 1,186 1,186 0,823 0,823 0,823
15
TLC (t zero)
1,066 1,066 1,066 0,770 0,770 0,770TLC (t1)
1,066 1,066 1,066 0,770 0,770 0,770TLC (Fl up t zero) 1,066 1,066 1,066 0,682 0,682 0,682
TLC (Fl up t1) 1,066 1,066 1,066 0,681 0,681 0,681
TLC (Fl down t zero) 1,066 1,066 1,066 0,829 0,829 0,829
TLC (Fl down t1) 1,066 1,066 1,066 0,829 0,829 0,829
16
KST (t zero)
0,455 0,764 0,191 0,258 0,434 0,109KST (t1)
0,679 0,168 0,405 0,386 0,095 0,230KST (Fl up t zero) 0,455 0,764 0,191 0,199 0,334 0,084
KST (Fl up t1) 0,544 -0,040 0,324 0,239 -0,018 0,142
KST (FL down t zero) 0,455 0,764 0,191 0,298 0,500 0,125
KST (FL down t1) 0,764 0,332 0,455 0,500 0,217 0,298
17
VAT (t zero)
1,168 1,028 1,028 0,646 0,569 0,569VAT (t1)
1,028 1,168 1,168 0,485 0,551 0,551VAT (FL up t zero) 1,168 1,028 1,028 0,490 0,431 0,431
VAT (FL up t1) 1,168 1,168 1,168 0,366 0,366 0,366
VAT (FL down t zero) 1,028 1,028 1,028 0,661 0,661 0,661
VAT (FL down t1) 1,168 1,168 1,168 0,675 0,675 0,675
18
VTC (t zero)
0,635 0,635 0,635 0,457 0,457 0,457VTC (t1)
0,635 0,635 0,635 0,431 0,431 0,431VTC (FL up t zero) 0,635 0,635 0,635 0,404 0,404 0,404
VTC (FL up t1) 0,635 0,635 0,635 0,369 0,369 0,369
VTC (FL down t zero) 0,635 0,635 0,635 0,493 0,493 0,493
VTC (FL down t1) 0,635 0,635 0,635 0,471 0,471 0,471
19
ELC (t zero)
0,794 0,794 0,493 0,382 0,382 0,237ELC (t1)
0,200 0,542 0,200 0,100 0,271 0,100ELC (Fl up t zero) 0,794 0,794 0,493 0,259 0,259 0,161
ELC (Fl up t1) 0,147 0,397 0,147 0,051 0,139 0,051
ELC (Fl down t zero) 0,794 0,794 0,493 0,465 0,465 0,289
ELC (Fl down t1) 0,234 0,633 0,234 0,140 0,380 0,140
20
SAM ( t zero)
1,191 1,191 1,191 1,113 1,113 1,113SAM (t1)
1,191 1,191 1,191 1,069 1,069 1,069SAM (Fl up t1) 1,191 1,191 1,191 1,033 1,033 1,033 SAM (FL down t
zero) 1,191 1,191 1,191 1,129 1,129 1,129
SAM (FL down t1) 1,191 1,191 1,191 1,094 1,094 1,094
21
LTC (t zero)
1,102 1,102 1,102 0,314 0,314 0,314LTC (t1)
1,102 1,102 1,102 0,329 0,329 0,329LTC (FL up t zero) 1,102 1,102 1,102 0,078 0,078 0,078
LTC (FL up t1) 1,102 1,102 1,102 0,097 0,097 0,097
LTC (FL down t zero) 1,102 1,102 1,102 0,472 0,472 0,472
LTC (FL down t1) 1,102 1,102 1,102 0,483 0,483 0,483
22
ITD (t zero)
0,351 0,351 0,351 0,136 0,136 0,136ITD (t1)
0,351 0,351 0,351 0,132 0,132 0,132ITD (FL up t zero) 0,351 0,351 0,351 0,072 0,072 0,072
ITD (FL up t1) 0,351 0,351 0,351 0,066 0,066 0,066
ITD (FL down t zero) 0,351 0,351 0,351 0,179 0,179 0,179
ITD (FL down t1) 0,351 0,351 0,351 0,175 0,175 0,175
b. Scenario 2: tax rate increases up to 28% and leverage kept as current, 20% down and 30% up, under the
condition that competitor size kept as current and beta values estimated at two time points (t0 and t1)
All beta values of total 22 listed firms on VN hardware industry market as below:
Table 3 – Market risks of listed hardware industry firms under a 4 factors model (case 2) (source: VN stock
exchange 2012)
Order No.
Company stock code
Equity beta Asset beta
Competitor as
current Double
Slightly smaller
Competitor
as current Double
Slightly smaller
1
CMT (FL current t
zero)
0,665 0,665 0,665 0,373 0,373 0,373
CMT (FL current
t1)
0,665 0,665 0,665 0,326 0,326 0,326CMT (Fl up t zero) 0,665 0,665 0,665 0,285 0,285 0,285
CMT (Fl up t1) 0,665 0,665 0,665 0,224 0,224 0,224
CMT (Fl down t zero) 0,665 0,665 0,665 0,432 0,432 0,432
CMT (Fl down t1) 0,665 0,665 0,665 0,394 0,394 0,394
2
SVT (t zero)
0,603 0,539 1,052 0,476 0,426 0,831SVT ( t1)
0,866 0,220 0,866 0,656 0,167 0,656SVT (FL up t zero) 0,603 0,539 1,052 0,438 0,392 0,764
SVT (FL up t1) 0,801 -0,062 0,801 0,548 -0,042 0,548
SVT (FL down t zero) 0,603 0,539 1,052 0,501 0,448 0,875
SVT (FL down t1) 0,909 0,404 0,909 0,732 0,326 0,732
3
VIE (t zero)
0,198 0,510 0,273 0,047 0,121 0,065VIE (t1)
0,292 0,271 0,139 0,056 0,052 0,026VIE (Fl up t zero) 0,198 0,510 0,273 0,002 0,004 0,002
VIE (Fl up t1) -0,089 -0,082 -0,024 0,005 0,004 0,001
VIE (Fl down t zero) 0,198 0,510 0,273 0,077 0,199 0,106
VIE (Fl down t1) 0,510 0,474 0,304 0,180 0,167 0,107
4
HPT (t zero)
0,438 0,438 0,438 0,105 0,005 0,171HPT (t1)
0,245 0,116 0,245 0,064 0,031 0,064HPT (Fl up t1) 0,042 0,020 0,042 0,002 0,001 0,002
HPT (FL down t zero) 0,438 0,438 0,438 0,105 0,005 0,171
HPT (FL down t1) 0,363 0,172 0,363 0,149 0,071 0,149
5
NIS (t zero)
0,130 0,779 0,417 0,057 0,339 0,181NIS (t1)
0,353 0,496 0,353 0,168 0,235 0,168NIS (FL up t zero) 0,130 0,779 0,417 0,035 0,207 0,111
NIS (FL up t1) 0,249 0,349 0,249 0,079 0,111 0,079
NIS (FL down t zero) 0,130 0,779 0,417 0,071 0,427 0,229
NIS (FL down t1) 0,417 0,585 0,417 0,242 0,339 0,242
6
TST (t zero)
0,739 0,739 0,739 0,200 0,200 0,200TST (t1)
0,739 0,739 0,739 0,236 0,236 0,236TST (FL up t zero) 0,739 0,739 0,739 0,038 0,038 0,038
TST (FL up t1) 0,739 0,739 0,739 0,085 0,085 0,085
TST (FL down t zero) 0,739 0,739 0,739 0,308 0,308 0,308
TST (FL down t1) 0,739 0,739 0,739 0,337 0,337 0,337
7
ST8 (t zero)
0,891 0,891 0,891 0,639 0,639 0,639ST8 (t1)
0,891 0,891 0,891 0,682 0,682 0,682ST8 (Fl up t zero) 0,891 0,891 0,891 0,563 0,563 0,563
ST8 (Fl up t1) 0,891 0,891 0,891 0,619 0,619 0,619
ST8 (Fl down t zero) 0,891 0,891 0,891 0,689 0,689 0,689
ST8 (Fl down t1) 0,891 0,891 0,891 0,724 0,724 0,724
8
TAG (t zero)
0,632 0,632 0,632 0,449 0,449 0,449TAG (t1)
0,632 0,632 0,632 0,411 0,411 0,411TAG (FL up t zero) 0,632 0,632 0,632 0,394 0,394 0,394
TAG (FL up t1) 0,632 0,632 0,632 0,345 0,345 0,345
TAG (FL down t zero) 0,632 0,632 0,632 0,486 0,486 0,486
TAG (FL down t1) 0,632 0,632 0,632 0,455 0,455 0,455
9
POT (t zero)
1,046 1,046 1,046 0,606 0,606 0,606POT (t1)
1,046 1,046 1,046 0,533 0,533 0,533POT (Fl up t zero) 1,046 1,046 1,046 0,475 0,475 0,475
POT (Fl up t1) 1,046 1,046 1,046 0,379 0,379 0,379
POT (Fl down t zero) 1,046 1,046 1,046 0,694 0,694 0,694
POT (Fl down t1) 1,046 1,046 1,046 0,636 0,636 0,636
10
CKV (t zero)
0,604 0,604 0,604 0,197 0,197 0,197CKV (t1)
0,604 0,604 0,604 0,221 0,221 0,221CKV (Fl up t zero) 0,604 0,604 0,604 0,076 0,076 0,076
CKV (Fl up t1) 0,604 0,604 0,604 0,106 0,106 0,106
CKV (FL down t zero) 0,604 0,604 0,604 0,279 0,279 0,279
CKV (FL down t1) 0,604 0,604 0,604 0,297 0,297 0,297
11
ONE (t zero)
0,707 0,531 0,736 0,236 0,177 0,245ONE (t1)
0,563 0,300 0,563 0,222 0,118 0,222ONE (FL up t zero) 0,707 0,531 0,736 0,094 0,071 0,098
ONE (FL up t1) 0,323 0,172 0,323 0,069 0,037 0,069
ONE (FL down t
zero) 0,707 0,531 0,736 0,330 0,248 0,343
ONE (FL down t1) 0,707 0,377 0,707 0,364 0,194 0,364
12
PMT ( t zero)
1,191 1,234 1,234 1,008 1,044 1,044PMT (t1)
1,191 1,191 1,191 1,019 1,019 1,019PMT (FL up t zero) 1,191 1,234 1,234 0,953 0,987 0,987
PMT (FL down t
zero) 1,234 1,234 1,234 1,082 1,082 1,082
PMT (FL down t1) 1,191 1,191 1,191 1,054 1,054 1,054
13
SMT (t zero)
0,106 0,416 0,838 0,072 0,282 0,569SMT (t1)
0,911 0,379 0,834 0,638 0,265 0,584SMT (Fl up t zero) 0,106 0,416 0,838 0,062 0,242 0,488
SMT (Fl up t1) 0,816 0,239 0,747 0,498 0,146 0,456
SMT (Fl down t zero) 0,106 0,416 0,838 0,079 0,309 0,623
SMT (Fl down t1) 0,971 0,477 0,889 0,738 0,363 0,676
14
UNI (t zero)
1,186 1,186 1,186 0,771 0,771 0,771UNI (t1)
1,186 1,186 1,186 0,732 0,732 0,732UNI (FL up t zero) 1,186 1,186 1,186 0,647 0,647 0,647
UNI (FL up t1) 1,186 1,186 1,186 0,596 0,596 0,596
UNI (FL down t zero) 1,186 1,186 1,186 0,854 0,854 0,854
UNI (FL down t1) 1,186 1,186 1,186 0,823 0,823 0,823
15
TLC (t zero)
1,066 1,066 1,066 0,770 0,770 0,770TLC (t1)
1,066 1,066 1,066 0,770 0,770 0,770TLC (Fl up t zero) 1,066 1,066 1,066 0,682 0,682 0,682
TLC (Fl up t1) 1,066 1,066 1,066 0,681 0,681 0,681
TLC (Fl down t zero) 1,066 1,066 1,066 0,829 0,829 0,829
TLC (Fl down t1) 1,066 1,066 1,066 0,829 0,829 0,829
16
KST (t zero)
0,460 0,773 0,198 0,261 0,439 0,112KST (t1)
0,689 0,175 0,411 0,392 0,100 0,233KST (Fl up t zero) 0,460 0,773 0,198 0,202 0,338 0,087
KST (Fl up t1) 0,555 -0,043 0,331 0,244 -0,019 0,145
KST (FL down t zero) 0,460 0,773 0,198 0,301 0,505 0,130
KST (FL down t1) 0,773 0,344 0,460 0,506 0,225 0,301
17
VAT (t zero)
1,168 1,028 1,028 0,646 0,569 0,569VAT (t1)
1,168 1,168 1,168 0,551 0,551 0,551VAT (FL up t zero) 1,168 1,028 1,028 0,490 0,431 0,431
VAT (FL up t1) 1,168 1,168 1,168 0,366 0,366 0,366
VAT (FL down t zero) 1,028 1,028 1,028 0,661 0,661 0,661
VAT (FL down t1) 1,168 1,168 1,168 0,675 0,675 0,675
18
VTC (t zero)
0,635 0,635 0,635 0,457 0,457 0,457VTC (t1)
0,635 0,635 0,635 0,431 0,431 0,431VTC (FL up t zero) 0,635 0,635 0,635 0,404 0,404 0,404
VTC (FL up t1) 0,635 0,635 0,635 0,369 0,369 0,369
VTC (FL down t zero) 0,635 0,635 0,635 0,493 0,493 0,493
VTC (FL down t1) 0,635 0,635 0,635 0,471 0,471 0,471
19
ELC (t zero)
0,805 0,805 0,500 0,388 0,388 0,241ELC (t1)
0,204 0,552 0,204 0,102 0,276 0,102ELC (Fl up t zero) 0,805 0,805 0,500 0,262 0,262 0,163
ELC (Fl up t1) 0,150 0,406 0,150 0,053 0,142 0,053
ELC (Fl down t zero) 0,805 0,805 0,500 0,471 0,471 0,292
ELC (Fl down t1) 0,237 0,641 0,237 0,142 0,385 0,142
20
SAM ( t zero)
1,191 1,191 1,191 1,113 1,113 1,113SAM (t1)
1,191 1,191 1,191 1,069 1,069 1,069SAM (Fl up t zero) 1,191 1,191 1,191 1,090 1,090 1,090
SAM (Fl up t1) 1,191 1,191 1,191 1,033 1,033 1,033
SAM (FL down t
SAM (FL down t1) 1,191 1,191 1,191 1,094 1,094 1,094 21
LTC (t zero)
1,102 1,102 1,102 0,314 0,314 0,314LTC (t1)
1,102 1,102 1,102 0,329 0,329 0,329LTC (FL up t zero) 1,102 1,102 1,102 0,078 0,078 0,078
LTC (FL up t1) 1,102 1,102 1,102 0,097 0,097 0,097
LTC (FL down t zero) 1,102 1,102 1,102 0,472 0,472 0,472
LTC (FL down t1) 1,102 1,102 1,102 0,483 0,483 0,483
22
ITD (t zero)
0,351 0,351 0,351 0,136 0,136 0,136ITD (t1)
0,351 0,351 0,351 0,132 0,132 0,132ITD (FL up t zero) 0,351 0,351 0,351 0,072 0,072 0,072
ITD (FL up t1) 0,351 0,351 0,351 0,066 0,066 0,066
ITD (FL down t zero) 0,351 0,351 0,351 0,179 0,179 0,179
ITD (FL down t1) 0,351 0,351 0,351 0,175 0,175 0,175
c. Scenario 3: tax rate decreases down to 20% and leverage kept as current, 20% down and 30% up, under the
condition that competitor size kept as current and beta values estimated at two time points (t0 and t1)
All beta values of total 22 listed firms on VN hardware industry market as below:
Table 4 – Market risks of listed hardware industry firms under a 4 factors model (case 3) (source: VN stock
exchange 2012)
Order No.
Company stock code
Equity beta Asset beta
Competitor as
current Double
Slightly smaller
Competitor
as current Double
Slightly smaller
1
CMT (FL current t
zero)
0,665 0,665 0,665 0,373 0,373 0,373
CMT (FL current
t1)
0,665 0,665 0,665 0,326 0,326 0,326CMT (Fl up t zero) 0,665 0,665 0,665 0,285 0,285 0,285
CMT (Fl up t1) 0,665 0,665 0,665 0,224 0,224 0,224
CMT (Fl down t zero) 0,665 0,665 0,665 0,432 0,432 0,432
CMT (Fl down t1) 0,665 0,665 0,665 0,394 0,394 0,394
2
SVT (t zero)
0,568 0,530 1,035 0,448 0,419 0,817SVT ( t1)
0,849 0,199 0,849 0,643 0,151 0,643SVT (FL up t zero) 0,568 0,530 1,035 0,412 0,385 0,752
SVT (FL up t1) 0,779 -0,054 0,779 0,534 -0,037 0,534
SVT (FL down t zero) 0,568 0,530 1,035 0,472 0,441 0,861
SVT (FL down t1) 0,894 0,374 0,894 0,721 0,301 0,721
3
VIE (t zero)
0,181 0,480 0,257 0,043 0,114 0,061VIE (t1)
0,269 0,250 0,121 0,051 0,048 0,023VIE (Fl up t zero) 0,181 0,480 0,257 0,001 0,004 0,002
VIE (Fl up t1) -0,079 -0,074 -0,020 0,004 0,004 0,001
VIE (Fl down t zero) 0,181 0,480 0,257 0,070 0,187 0,100
VIE (Fl down t1) 0,480 0,446 0,274 0,169 0,157 0,096
4
HPT (t zero)
0,415 0,396 0,415 0,099 0,095 0,099HPT (t1)
0,228 0,108 0,228 0,060 0,028 0,060HPT (Fl up t zero) 0,415 0,396 0,415 0,004 0,004 0,004
HPT (Fl up t1) 0,038 0,018 0,038 0,002 0,001 0,002
HPT (FL down t zero) 0,415 0,396 0,415 0,162 0,155 0,162
5
NIS (t zero)
0,114 0,751 0,402 0,050 0,327 0,175NIS (t1)
0,337 0,473 0,337 0,160 0,224 0,160NIS (FL up t zero) 0,114 0,751 0,402 0,030 0,199 0,107
NIS (FL up t1) 0,233 0,327 0,233 0,074 0,104 0,074
NIS (FL down t zero) 0,114 0,751 0,402 0,063 0,411 0,220
NIS (FL down t1) 0,402 0,564 0,402 0,233 0,327 0,233
6
TST (t zero)
0,739 0,739 0,739 0,200 0,200 0,200TST (t1)
0,739 0,739 0,739 0,236 0,236 0,236TST (FL up t zero) 0,739 0,739 0,739 0,038 0,038 0,038
TST (FL up t1) 0,739 0,739 0,739 0,085 0,085 0,085
TST (FL down t zero) 0,739 0,739 0,739 0,308 0,308 0,308
TST (FL down t1) 0,739 0,739 0,739 0,337 0,337 0,337
7
ST8 (t zero)
0,891 0,891 0,891 0,639 0,639 0,639ST8 (t1)
0,891 0,891 0,891 0,682 0,682 0,682ST8 (Fl up t zero) 0,891 0,891 0,891 0,563 0,563 0,563
ST8 (Fl up t1) 0,891 0,891 0,891 0,619 0,619 0,619
ST8 (Fl down t zero) 0,891 0,891 0,891 0,689 0,689 0,689
ST8 (Fl down t1) 0,891 0,891 0,891 0,724 0,724 0,724
8
TAG (t zero)
0,632 0,632 0,632 0,449 0,449 0,449TAG (t1)
0,632 0,632 0,632 0,411 0,411 0,411TAG (FL up t zero) 0,632 0,632 0,632 0,394 0,394 0,394
TAG (FL up t1) 0,632 0,632 0,632 0,345 0,345 0,345
TAG (FL down t zero) 0,632 0,632 0,632 0,486 0,486 0,486
TAG (FL down t1) 0,632 0,632 0,632 0,455 0,455 0,455
9
POT (t zero)
1,046 1,046 1,046 0,606 0,606 0,606POT (t1)
1,046 1,046 1,046 0,533 0,533 0,533POT (Fl up t zero) 1,046 1,046 1,046 0,475 0,475 0,475
POT (Fl up t1) 1,046 1,046 1,046 0,379 0,379 0,379
POT (Fl down t zero) 1,046 1,046 1,046 0,694 0,694 0,694
POT (Fl down t1) 1,046 1,046 1,046 0,636 0,636 0,636
10
CKV (t zero)
0,604 0,604 0,604 0,197 0,197 0,197CKV (t1)
0,604 0,604 0,604 0,221 0,221 0,221CKV (Fl up t zero) 0,604 0,604 0,604 0,076 0,076 0,076
CKV (Fl up t1) 0,604 0,604 0,604 0,106 0,106 0,106
CKV (FL down t zero) 0,604 0,604 0,604 0,279 0,279 0,279
CKV (FL down t1) 0,604 0,604 0,604 0,297 0,297 0,297
11
ONE (t zero)
0,677 0,508 0,704 0,225 0,169 0,235ONE (t1)
0,532 0,284 0,532 0,210 0,112 0,210ONE (FL up t zero) 0,677 0,508 0,704 0,090 0,068 0,094
ONE (FL up t1) 0,299 0,159 0,299 0,064 0,034 0,064
ONE (FL down t
zero) 0,677 0,508 0,704 0,316 0,237 0,329
ONE (FL down t1) 0,677 0,361 0,677 0,349 0,186 0,349
12
PMT ( t zero)
1,191 1,234 1,234 1,008 1,044 1,044PMT (t1)
1,191 1,191 1,191 1,019 1,019 1,019PMT (FL up t zero) 1,191 1,234 1,234 0,953 0,987 0,987
PMT (FL up t1) 1,191 1,191 1,191 0,967 0,967 0,967
PMT (FL down t
zero) 1,234 1,234 1,234 1,082 1,082 1,082
PMT (FL down t1) 1,191 1,191 1,191 1,054 1,054 1,054
SMT (t1)
0,887 0,352 0,813 0,621 0,247 0,569SMT (Fl up t zero) 0,091 0,383 0,821 0,053 0,223 0,478
SMT (Fl up t1) 0,788 0,217 0,722 0,481 0,132 0,441
SMT (Fl down t zero) 0,091 0,383 0,821 0,068 0,285 0,610
SMT (Fl down t1) 0,951 0,450 0,871 0,723 0,342 0,662
14
UNI (t zero)
1,186 1,186 1,186 0,771 0,771 0,771UNI (t1)
1,186 1,186 1,186 0,732 0,732 0,732UNI (FL up t zero) 1,186 1,186 1,186 0,647 0,647 0,647
UNI (FL up t1) 1,186 1,186 1,186 0,596 0,596 0,596
UNI (FL down t zero) 1,186 1,186 1,186 0,854 0,854 0,854
UNI (FL down t1) 1,186 1,186 1,186 0,823 0,823 0,823
15
TLC (t zero)
1,066 1,066 1,066 0,770 0,770 0,770TLC (t1)
1,066 1,066 1,066 0,770 0,770 0,770TLC (Fl up t zero) 1,066 1,066 1,066 0,682 0,682 0,682
TLC (Fl up t1) 1,066 1,066 1,066 0,681 0,681 0,681
TLC (Fl down t zero) 1,066 1,066 1,066 0,829 0,829 0,829
TLC (Fl down t1) 1,066 1,066 1,066 0,829 0,829 0,829
16
KST (t zero)
0,447 0,750 0,181 0,254 0,426 0,103KST (t1)
0,663 0,156 0,395 0,377 0,088 0,225KST (Fl up t zero) 0,447 0,750 0,181 0,196 0,328 0,079
KST (Fl up t1) 0,527 -0,036 0,314 0,232 -0,016 0,138
KST (FL down t zero) 0,447 0,750 0,181 0,292 0,490 0,118
KST (FL down t1) 0,750 0,314 0,447 0,491 0,205 0,293
17
VAT (t zero)
1,168 1,028 1,028 0,646 0,569 0,569VAT (t1)
1,168 1,168 1,168 0,551 0,551 0,551VAT (FL up t zero) 1,168 1,028 1,028 0,490 0,431 0,431
VAT (FL up t1) 1,168 1,168 1,168 0,366 0,366 0,366
VAT (FL down t zero) 1,028 1,028 1,028 0,661 0,661 0,661
VAT (FL down t1) 1,168 1,168 1,168 0,675 0,675 0,675
18
VTC (t zero)
0,635 0,635 0,635 0,457 0,457 0,457VTC (t1)
0,635 0,635 0,635 0,431 0,431 0,431VTC (FL up t zero) 0,635 0,635 0,635 0,404 0,404 0,404
VTC (FL up t1) 0,635 0,635 0,635 0,369 0,369 0,369
VTC (FL down t zero) 0,635 0,635 0,635 0,493 0,493 0,493
VTC (FL down t1) 0,635 0,635 0,635 0,471 0,471 0,471
19
ELC (t zero)
0,777 0,777 0,482 0,374 0,374 0,232ELC (t1)
0,195 0,527 0,195 0,097 0,264 0,097ELC (Fl up t zero) 0,777 0,777 0,482 0,253 0,253 0,157
ELC (Fl up t1) 0,141 0,382 0,141 0,049 0,134 0,049
ELC (Fl down t zero) 0,777 0,777 0,482 0,455 0,455 0,282
ELC (Fl down t1) 0,229 0,619 0,229 0,137 0,371 0,137
20
SAM ( t zero)
1,191 1,191 1,191 1,113 1,113 1,113SAM (t1)
1,191 1,191 1,191 1,069 1,069 1,069SAM (Fl up t zero) 1,191 1,191 1,191 1,090 1,090 1,090
SAM (Fl up t1) 1,191 1,191 1,191 1,033 1,033 1,033
SAM (FL down t
zero) 1,191 1,191 1,191 1,129 1,129 1,129
SAM (FL down t1) 1,191 1,191 1,191 1,094 1,094 1,094
21
LTC (t zero)
1,102 1,102 1,102 0,314 0,314 0,314LTC (t1)
1,102 1,102 1,102 0,329 0,329 0,329LTC (FL up t1) 1,102 1,102 1,102 0,097 0,097 0,097
LTC (FL down t zero) 1,102 1,102 1,102 0,472 0,472 0,472
LTC (FL down t1) 1,102 1,102 1,102 0,483 0,483 0,483
22
ITD (t zero)
0,351 0,351 0,351 0,136 0,136 0,136ITD (t1)
0,351 0,351 0,351 0,132 0,132 0,132ITD (FL up t zero) 0,351 0,351 0,351 0,072 0,072 0,072
ITD (FL up t1) 0,351 0,351 0,351 0,066 0,066 0,066
ITD (FL down t zero) 0,351 0,351 0,351 0,179 0,179 0,179
ITD (FL down t1) 0,351 0,351 0,351 0,175 0,175 0,175
All three above tables and data show that there are just tiny changes in the values of equity beta and there are bigger
fluctuations in the values of asset beta in the three (3) cases.
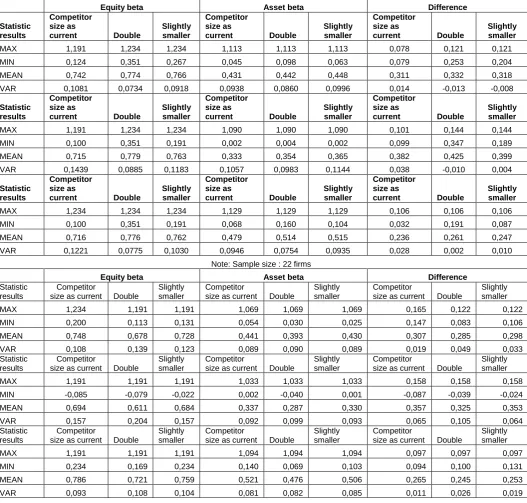
3.2. Comparing statistical results in 3 scenarios of changing leverage:
Table 5 - Statistical results (FL in case 1) (source: VN stock exchange 2012)
Equity beta Asset beta Difference
Statistic results
Competitor size as
current Double
Slightly smaller
Competitor size as
current Double
Slightly smaller
Competitor size as
current Double
Slightly smaller
MAX 1,191 1,234 1,234 1,113 1,113 1,113 0,078 0,121 0,121
MIN 0,124 0,351 0,267 0,045 0,098 0,063 0,079 0,253 0,204
MEAN 0,742 0,774 0,766 0,431 0,442 0,448 0,311 0,332 0,318
VAR 0,1081 0,0734 0,0918 0,0938 0,0860 0,0996 0,014 -0,013 -0,008
Statistic results
Competitor size as
current Double
Slightly smaller
Competitor size as
current Double
Slightly smaller
Competitor size as
current Double
Slightly smaller
MAX 1,191 1,234 1,234 1,090 1,090 1,090 0,101 0,144 0,144
MIN 0,100 0,351 0,191 0,002 0,004 0,002 0,099 0,347 0,189
MEAN 0,715 0,779 0,763 0,333 0,354 0,365 0,382 0,425 0,399
VAR 0,1439 0,0885 0,1183 0,1057 0,0983 0,1144 0,038 -0,010 0,004
Statistic results
Competitor size as
current Double
Slightly smaller
Competitor size as
current Double
Slightly smaller
Competitor size as
current Double
Slightly smaller
MAX 1,234 1,234 1,234 1,129 1,129 1,129 0,106 0,106 0,106
MIN 0,100 0,351 0,191 0,068 0,160 0,104 0,032 0,191 0,087
MEAN 0,716 0,776 0,762 0,479 0,514 0,515 0,236 0,261 0,247
VAR 0,1221 0,0775 0,1030 0,0946 0,0754 0,0935 0,028 0,002 0,010
Note: Sample size : 22 firms
Equity beta Asset beta Difference
Statistic results
Competitor
size as current Double
Slightly smaller
Competitor
size as current Double
Slightly smaller
Competitor
size as current Double
Slightly smaller
MAX 1,234 1,191 1,191 1,069 1,069 1,069 0,165 0,122 0,122
MIN 0,200 0,113 0,131 0,054 0,030 0,025 0,147 0,083 0,106
MEAN 0,748 0,678 0,728 0,441 0,393 0,430 0,307 0,285 0,298
VAR 0,108 0,139 0,123 0,089 0,090 0,089 0,019 0,049 0,033 Statistic
results
Competitor
size as current Double
Slightly smaller
Competitor
size as current Double
Slightly smaller
Competitor
size as current Double
Slightly smaller
MAX 1,191 1,191 1,191 1,033 1,033 1,033 0,158 0,158 0,158
MIN -0,085 -0,079 -0,022 0,002 -0,040 0,001 -0,087 -0,039 -0,024
MEAN 0,694 0,611 0,684 0,337 0,287 0,330 0,357 0,325 0,353
VAR 0,157 0,204 0,157 0,092 0,099 0,093 0,065 0,105 0,064 Statistic
results
Competitor
size as current Double
Slightly smaller
Competitor
size as current Double
Slightly smaller
Competitor
size as current Double
Slightly smaller
MAX 1,191 1,191 1,191 1,094 1,094 1,094 0,097 0,097 0,097
MIN 0,234 0,169 0,234 0,140 0,069 0,103 0,094 0,100 0,131
MEAN 0,786 0,721 0,759 0,521 0,476 0,506 0,265 0,245 0,253
Note: Sample size : 22 firms
Table 7- Statistical results (FL in case 3) (source: VN stock exchange 2012)
Equity beta Asset beta Difference
Statistic results
Competitor size as
current Double
Slightly smaller
Competitor size as
current Double
Slightly smaller
Competitor size as
current Double
Slightly smaller
MAX 1,191 1,234 1,234 1,113 1,113 1,113 0,078 0,121 0,121
MIN 0,114 0,351 0,257 0,043 0,095 0,061 0,072 0,256 0,196
MEAN 0,737 0,770 0,762 0,429 0,440 0,447 0,309 0,330 0,315
VAR 0,1104 0,0751 0,0934 0,0944 0,0865 0,0999 0,016 -0,011 -0,006
Statistic results
Competitor size as
current Double
Slightly smaller
Competitor size as
current Double
Slightly smaller
Competitor size as
current Double
Slightly smaller
MAX 1,191 1,234 1,234 1,090 1,090 1,090 0,101 0,144 0,144
MIN 0,091 0,351 0,181 0,001 0,004 0,002 0,090 0,347 0,179
MEAN 0,709 0,773 0,758 0,331 0,352 0,363 0,378 0,421 0,395
VAR 0,1467 0,0911 0,1205 0,1059 0,0987 0,1144 0,041 -0,008 0,006
Statistic results
Competitor size as
current Double
Slightly smaller
Competitor size as
current Double
Slightly smaller
Competitor size as
current Double
Slightly smaller
MAX 1,234 1,234 1,234 1,129 1,129 1,129 0,106 0,106 0,106
MIN 0,091 0,351 0,181 0,063 0,155 0,100 0,029 0,196 0,081
MEAN 0,711 0,770 0,758 0,477 0,511 0,512 0,234 0,259 0,245
VAR 0,1245 0,0797 0,1049 0,0956 0,0765 0,0941 0,029 0,003 0,011
Note: Sample size : 22 firms
Equity beta Asset beta Difference
Statistic results
Competitor
size as current Double
Slightly smaller
Competitor
size as current Double
Slightly smaller
Competitor
size as current Double
Slightly smaller
MAX 1,191 1,191 1,191 1,069 1,069 1,069 0,122 0,122 0,122
MIN 0,195 0,108 0,121 0,051 0,028 0,023 0,144 0,080 0,098
MEAN 0,747 0,673 0,724 0,439 0,391 0,429 0,308 0,282 0,296
VAR 0,113 0,142 0,125 0,088 0,091 0,090 0,025 0,051 0,035 Statistic
results
Competitor
size as current Double
Slightly smaller
Competitor
size as current Double
Slightly smaller
Competitor
size as current Double
Slightly smaller
MAX 1,191 1,191 1,191 1,033 1,033 1,033 0,158 0,158 0,158
MIN -0,079 -0,074 -0,020 0,002 -0,037 0,001 -0,081 -0,037 -0,021
MEAN 0,691 0,609 0,681 0,335 0,286 0,329 0,356 0,324 0,352
VAR 0,158 0,204 0,158 0,092 0,099 0,093 0,066 0,106 0,065 Statistic
results
Competitor
size as current Double
Slightly smaller
Competitor
size as current Double
Slightly smaller
Competitor
size as current Double
Slightly smaller
MAX 1,191 1,191 1,191 1,094 1,094 1,094 0,097 0,097 0,097
MIN 0,229 0,163 0,229 0,137 0,067 0,096 0,092 0,096 0,132
MEAN 0,782 0,716 0,755 0,519 0,473 0,504 0,263 0,243 0,251
VAR 0,094 0,111 0,106 0,082 0,083 0,085 0,012 0,028 0,020
The above calculated figures generate some following results:
First of all, Equity beta mean values in all 3 scenarios are acceptable (< 0,8) and asset beta mean values are also
small (< 0,6). If competitor size kept as current (approximate size) and Fl kept as current, equity beta value
decreases slightly from 1,234 to 0,200 when tax rate is 25%. (at time point t1).
Then, at time point t0, If competitor size kept as current (approximate size) and Fl kept as current, equity beta value
The below chart 1 and 2 show us: in scenario 1 (current tax rate), when leverage degree as current, with current
approximate size competitors, average equity beta value increases maximum (0,75). However, equity beta var
reaches 0,748 (maximum), in case current competitors. Then, in scenario 2 (tax rate up to 28%), when leverage
degree decreases down to 20%, with current approximate size competitors, average equity beta value increases
maximum (0,789). In addition to, equity beta var reaches 0,106 (maximum), in case double size competitor.
Finally, in scenario 3 (tax rate down 20%), equity beta mean reaches 0,609 (minimum) if leverage up 30% and
doubling size competitors.
The below chart 3 and 4 show us: in scenario 1 (current tax rate), asset beta mean reaches 0,521 (maximum) if
leverage down 20% and current approximate size competitors. And asset beta var reaches 0,099 (maximum) in case
30% leverage up and double size competitors. Then, in scenario 2 (tax rate up to 28%), asset beta mean also reaches
0,523 (maximum) if leverage down 20% and current approximate size competitors. And asset beta var reaches
0,098 (maximum) in case leverage up 30% and doubling size competitors. Finally, in scenario 3 (tax rate down
20%), asset beta mean reaches 0,286 (minimum) in case FL up 30% and doubling size competitors, whereas asset
beta var reaches 0,082 (minimum) in case Fl down 20% and competitive firm size kept as current.
Chart 1 – Comparing statistical results of equity beta var and mean in three (3) scenarios of changing FL and tax
rate and competitor size (source: VN stock exchange 2012)
Note: (1) current tax rate; (2): tax rate up 28%; (3): tax rate down 20%
Chart 2 – Comparing statistical results of equity beta var and mean in three (3) scenarios of changing FL and tax
rate and competitor size (source: VN stock exchange 2012
Chart 3 – Comparing statistical results of asset beta var and mean in three (3) scenarios of changing FL and tax rate
and competitor size (source: VN stock exchange 2012)
Equity Beta VAR (current), current FL (1), 0.11 Equity Beta VAR (current),
current FL t0 (1), 0.11
Equity Beta VAR (current), FL up (1), 0.16 Equity Beta VAR (current),
FL up t0 (1), 0.14 Equity Beta VAR (current),
FL down (1), 0.09
Equity Beta VAR (current), FL down t0(1), 0.12 Equity Beta VAR (current),
current FL (2), 0.11 Equity Beta VAR (current),
current FL t0(2), 0.11
Equity Beta VAR (current), FL up (2), 0.16 Equity Beta VAR (current),
FL up t0(2), 0.14 Equity Beta VAR (current),
FL down (2), 0.09
Equity Beta VAR (current), FL down t0(2), 0.12 Equity Beta VAR (current),
current FL (3), 0.11 Equity Beta VAR (current),
current FL t0(3), 0.11
Equity Beta VAR (current), FL up (3), 0.16 Equity Beta VAR (current),
FL up t0(3), 0.15 Equity Beta VAR (current),
FL down (3), 0.09
Equity Beta VAR (current), FL down t0(3), 0.125
Equity Beta VAR (double size), current FL (1), 0.14 Equity Beta VAR (double
size), current FL t0 (1), 0.07
Equity Beta VAR (double size), FL up (1), 0.20 Equity Beta VAR (double
size), FL up t0 (1), 0.09 Equity Beta VAR (double
size), FL down (1), 0.11 Equity Beta VAR (double size), FL down t0(1), 0.08
Equity Beta VAR (double size), current FL (2), 0.14 Equity Beta VAR (double
size), current FL t0(2), 0.07
Equity Beta VAR (double size), FL up (2), 0.20 Equity Beta VAR (double
size), FL up t0(2), 0.09 Equity Beta VAR (double
size), FL down (2), 0.11 Equity Beta VAR (double size), FL down t0(2), 0.08
Equity Beta VAR (double size), current FL (3), 0.14 Equity Beta VAR (double
size), current FL t0(3), 0.08
Equity Beta VAR (double size), FL up (3), 0.20 Equity Beta VAR (double
size), FL up t0(3), 0.09 Equity Beta VAR (double
size), FL down (3), 0.11 Equity Beta VAR (double size), FL down t0(3), 0.080
Equity Beta VAR (slightly smaller), current FL (1), 0.12 Equity Beta VAR (slightly smaller), current FL t0 (1), 0.09
Equity Beta VAR (slightly smaller), FL up
(1), 0.16 Equity Beta VAR (slightly smaller), FL up
t0 (1), 0.12 Equity Beta VAR (slightly smaller), FL
down (1), 0.10 Equity Beta VAR (slightly smaller), FL
down t0(1), 0.10 Equity Beta VAR (slightly smaller), current FL (2), 0.12 Equity Beta VAR (slightly smaller), current FL t0(2), 0.09
Equity Beta VAR (slightly smaller), FL up
(2), 0.16 Equity Beta VAR (slightly smaller), FL up
t0(2), 0.12 Equity Beta VAR (slightly smaller), FL
down (2), 0.10 Equity Beta VAR (slightly smaller), FL
down t0(2), 0.10 Equity Beta VAR (slightly smaller), current FL (3), 0.12 Equity Beta VAR (slightly smaller), current FL t0(3), 0.09
Equity Beta VAR (slightly smaller), FL up
(3), 0.16 Equity Beta VAR (slightly smaller), FL up
t0(3), 0.12 Equity Beta VAR (slightly smaller), FL
down (3), 0.11 Equity Beta VAR (slightly smaller), FL
down t0(3), 0.105
Equity Beta VAR (slightly smaller)
Chart 3 – Comparing statistical results of asset beta var and mean in three (3) scenarios of changing FL and tax rate
and competitor size (source: VN stock exchange 2012)
Note: (1) current tax rate; (2): tax rate up 28%; (3): tax rate down 20%
Chart 4 – Comparing statistical results of asset beta var and mean in three (3) scenarios of changing FL and tax rate
and competitor size (source: VN stock exchange 2012)
(source: Viet Nam stock exchange 2012)
3.4 Empirical results
In scenario 1 (tax 25%), asset beta mean reach the highest value of 0,44 at time point t1 with current approximate
size competitor and that of 0,45 at time point t0 with slightly smaller competitor whereas asset beta var also
reaches maximum value of 0,099 at time point t1 if competitor size doubles and 0,114 at time point t0 with slightly
smaller size competitor, compared to the rest 2 cases (see tables 5,6,7).
In scenario 2 (tax up 28%), asset beta mean reach maximum value of 0,52 at time point t1 with current competitor
size and of 0,51 at time point t0 with either double or smaller competitor whereas asset beta var reaches maximum
value of 0,109 at time point t0 with smaller competitor and of 0,098 at time point t1 with double size competitor,
compared to the rest 2 cases.
Asset Beta Mean (current), current
FL (1), 0.44 Asset Beta Mean (current), current FL t0 (1), 0.43 Asset Beta Mean
(current), FL up (1), 0.34 Asset Beta Mean (current), FL up t0
(1), 0.33
Asset Beta Mean (current), FL down
(1), 0.52 Asset Beta Mean (current), FL down
t0(1), 0.48 Asset Beta Mean (current), current
FL (2), 0.44 Asset Beta Mean (current), current FL t0(2), 0.44 Asset Beta Mean
(current), FL up (2), 0.34 Asset Beta Mean
(current), FL up t0(2), 0.34
Asset Beta Mean (current), FL down
(2), 0.52 Asset Beta Mean (current), FL down
t0(2), 0.52 Asset Beta Mean (current), current
FL (3), 0.44 Asset Beta Mean (current), current FL t0(3), 0.43 Asset Beta Mean
(current), FL up (3), 0.34 Asset Beta Mean
(current), FL up t0(3), 0.33
Asset Beta Mean (current), FL down
(3), 0.52 Asset Beta Mean (current), FL down
t0(3), 0.48
Asset Beta Mean (double size), current
FL (1), 0.39 Asset Beta Mean (double size), current
FL t0 (1), 0.44 Asset Beta Mean
(double size), FL up (1), 0.29
Asset Beta Mean (double size), FL up
t0 (1), 0.35
Asset Beta Mean (double size), FL down (1), 0.48
Asset Beta Mean (double size), FL down t0(1), 0.51 Asset Beta Mean (double size), current
FL (2), 0.39 Asset Beta Mean (double size), current
FL t0(2), 0.39 Asset Beta Mean (double size), FL up
(2), 0.29 Asset Beta Mean (double size), FL up
t0(2), 0.29
Asset Beta Mean (double size), FL down (2), 0.48 Asset Beta Mean (double size), FL down t0(2), 0.48 Asset Beta Mean (double size), current
FL (3), 0.39 Asset Beta Mean (double size), current
FL t0(3), 0.44 Asset Beta Mean
(double size), FL up (3), 0.29
Asset Beta Mean (double size), FL up
t0(3), 0.35
Asset Beta Mean (double size), FL down (3), 0.47
Asset Beta Mean (double size), FL down t0(3), 0.51
Asset Beta Mean (slightly smaller), current FL (1), 0.43
Asset Beta Mean (slightly smaller), current FL t0 (1),
0.45 Asset Beta Mean (slightly smaller), FL
up (1), 0.33 Asset Beta Mean (slightly smaller), FL
up t0 (1), 0.36
Asset Beta Mean (slightly smaller), FL
down (1), 0.51 Asset Beta Mean (slightly smaller), FL
down t0(1), 0.51 Asset Beta Mean (slightly smaller), current FL (2), 0.43
Asset Beta Mean (slightly smaller), current FL t0(2), 0.43 Asset Beta Mean
(slightly smaller), FL up (2), 0.33 Asset Beta Mean (slightly smaller), FL
up t0(2), 0.33
Asset Beta Mean (slightly smaller), FL
down (2), 0.51 Asset Beta Mean (slightly smaller), FL
down t0(2), 0.51 Asset Beta Mean (slightly smaller), current FL (3), 0.43
Asset Beta Mean (slightly smaller), current FL t0(3), 0.45 Asset Beta Mean
(slightly smaller), FL up (3), 0.33
Asset Beta Mean (slightly smaller), FL
up t0(3), 0.36
Asset Beta Mean (slightly smaller), FL
down (3), 0.50 Asset Beta Mean (slightly smaller), FL
down t0(3), 0.51
Asset Beta Mean (slightly smaller)
Asset Beta Mean (double size)