Volume 2, Issue 2, 2015
109 Available online at www.ijiere.com
International Journal of Innovative and Emerging
Research in Engineering
e-ISSN: 2394 – 3343 p-ISSN: 2394 – 5494
A Survey on Detection of Disease and Fruit Grading
Uravashi Solanki
a, Udesang K. Jaliya
band Darshak G. Thakore
baPG Scholar,Department of Computer Engineering,Birla Vishwakarma Mahavidyalaya,Vallabh Vidyanagar, India
bDepartment of Computer Engineering,Birla Vishwakarma Mahavidyalaya,Vallabh Vidyanagar, India
ABSTRACT:
A research on detection of disease and fruit grading is useful for agriculture and farmers. By identifying type of disease in fruits and also grading of fruit based on its quality. For detection of disease required different features of fruit and classifier classified these features. For fruit grading segment the image after segmentation calculate infected and healthy portion of fruit and grading based on percentage of infection on fruit. This paper represents different features for fruit, different classifier for disease detection and different segmentation techniques for fruit grading process. Also gives summary of different color techniques, different texture techniques and different classifier all with its merits and demerits.
Keywords: features, colour feature, texture feature, different classifier, fruit grading, segmentation techniques
I. INTRODUCTION
India has a second rank in the production of fruit [15]. So fruits play very important role for farmers and also for agriculture. There are many applications related with image processing for agriculture. Like harvesting, grading, detecting damage and disease, plant growth monitoring are as under:
Automatically grading of fruits for oil fresh fruit bunches and strawberry [3] [6]. Calculating the size of fruit and also ripeness of fruit for its quality given in [17]. Crop disease and insects on crops are identifying for pest management system [18].
Xavier et al [19] give the real time image processing system for weed/crop discrimination in which identified plant growing at different illumination and soil condition.
Greenness was identified for plant and crop [20].
Harvesting, Grading, Detection of damage and disease, Plant growth monitoring all applications given in [21] for different fruits like apple, tomatoes etc.
In this paper working for two applications one is detection of disease and another is grading of fruit. For these two techniques first application disease detection required different features for fruit like colour, texture and shape. After feature extraction required classifier which classify disease. Second application is fruit grading. This application required fruit image segmentation after segmentation calculate healthy and infected portion of fruit.
Different feature extraction techniques for colour and texture summarise respectively in table 2 and table 3.For classification purpose different classifier techniques summarise in table 4 and for fruit grading different segmentation techniques summarise in table 5.
II. DISEASE DETECTION AND CLASSIFICATION
In disease detection process identify which type of disease available in fruits. Like in [1] they give disease detection for two grapes disease and two for apple disease. For that first of all extract the different features from the fruit. After extraction classify disease of fruit based on its features.
A. Feature extraction
Features are extracted from the fruit because based on its features able to classify fruit disease. Extract different features from fruit. Like colour of fruit, texture and shape.
In this paper [1] two types of grapes disease and two types of apple disease have been taken. In which color, texture and shape selected as a feature vectors. Color feature extracted by HSV histogram value. Morphology used for shape detection of disease. Texture find out by wavelet transform method used for visual pattern of skin of fruit. Color and morphology give better result than texture. Morphology gives 90% result.
Volume 2, Issue 2, 2015
110 colour histogram, colour coherence vector, local binary pattern (LBP) and complete local binary pattern (CLBP). In which complete local binary pattern feature give 93% correct classification than other features because its calculate magnitude ,sign and centre value for pixels.
For extraction of colour feature from oil fresh fruit bunches [3], first of all convert to L*a*b* space consists of a luminosity L* or brightness layer, chromaticity layer a* indicating color falls along the red/green axis, and chromaticity layer b* indicating color falls along the blue/yellow axis. After this calculate standard deviation and average for three different colours red, green and blue.
Mango fruit grading by fuzzy rule based on three features size, shape and colour [4]. First size of mango identify then after colour calculated based on mean of three colour value for red, green and blue and last feature skin calculated by mean skin value by edge detection algorithm for three different value.
Detection and classification of plant leaf disease [5] for which they were used HSI (Hue Saturation Intensity) colour space. Here used HSI space because it’s give good result and also light invariant. After HSI create SGDM (spatial gray level dependency matrix) for texture analysis of disease. This matrix depended on intensity value at one pixel how it’s related with another pixel. It gives accuracy around 93%.
Three features are extracted for Strawberry respectively shape, size and colour [6]. Shape feature find out by drawing the line and get shape by K-mean clustering method. For colour feature used dominant colour method for a* channel. For size used largest diameter method. These three features are shape, size and colour able to grade the Strawberry. Colour accuracy is 88.8% and shape accuracy is above 90%.
Date fruit classification based on different features like flabbiness, size and shape [7]. For flabbiness give date quality calculate it by color intensity. For size calculate area covered by date .For shape calculate outer edge of date. Classification of date fruit was done by back propagation neural network. Grading in three grades respectively grades 1, grade 2 and grad 3.Its gives 80% accuracy. Also for date fruit extract main three features names are color, texture and shape [8]. In which color feature find out by mean and deviation values for three main colors red, green and blue. Shape was identified by number of pixels covered by date area. Texture was found out by entropy and Gray level dependency matrix.
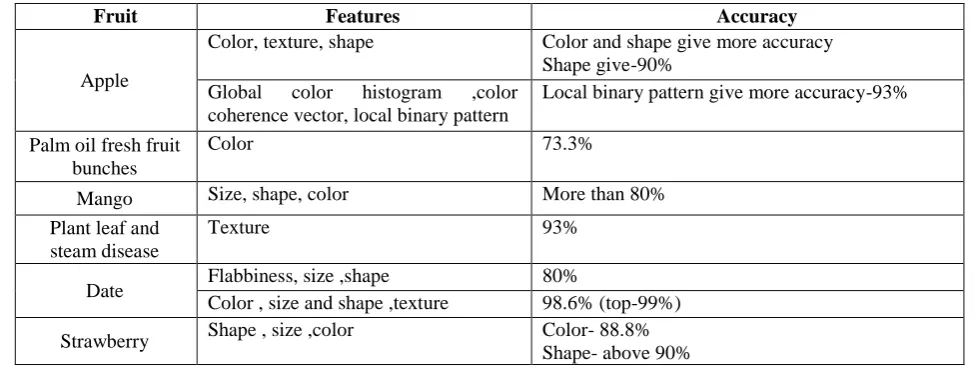
Table 1: Summary of different features [1-8]
Fruit Features Accuracy
Apple
Color, texture, shape Color and shape give more accuracy Shape give-90%
Global color histogram ,color coherence vector, local binary pattern
Local binary pattern give more accuracy-93%
Palm oil fresh fruit bunches
Color 73.3%
Mango Size, shape, color More than 80%
Plant leaf and steam disease
Texture 93%
Date Flabbiness, size ,shape 80%
Color , size and shape ,texture 98.6% (top-99%)
Strawberry Shape , size ,color Color- 88.8% Shape- above 90%
Table 2: Summary of different colour techniques
Method Merits Demerits
HSV histogram[1] 1. High accuracy.
2. Suitable for real time application.
1. Less sensitive to lighting variations.
Global color
histogram(GCH)[2]
1. Simplest approach for distinct color. 1. Not more suitable.
L*a*b*[3] 1. Colour and intensity manage
independently.
2. Ability to measure small color difference.
1. Singularity problem as other nonlinear transformations.
Mean of three color array[4] 1. Very easy for implementation. 1. Not accurate as other methods.
Dominant color method[6] 1. It’s very close to human vision. 1. It’s a complex method.
Color intensity[7] 1. Easy for implementation but required gray conversion.
Volume 2, Issue 2, 2015
111 Table 3: Summary of different texture techniques [10]
Method Features Merits Demerits
Grey Level Cooccurrence
Matrices (GLCM)[8]
1. It is in tabular form. In which how different combinations of pixel gray levels occur in an image. 2. In which second order calculate relation between groups of two pixels.
1. Smaller length of feature vector.
2. Applied it with different color space for color cooccurrence matrix.
1. They require a lot of Computation (many matrices to be computed).
2. It’s not invariant with rotation and scaling.
Gabor Filters
1. It is a signal processing method used for defining a set of radial center frequencies and orientations.
1. It’s a multi-scale, multi- resolution filter. 2. It has selectivity for orientation, spectral bandwidth and spatial extent.
1. Large bank of filters used in application so computational cost is very high.
Wavelets Transform[1]
1. It is preformed on the frequency domain rather than the spatial domain.
1. Produces best features with higher accuracy.
1. It is more complex and slower.
Independent Component
Analysis (ICA)
1. It decomposes mixed signal into a set of linearly independent signals.
1. It is capable of obtaining higher order statistics.
2. It is used to separate a multivariate signal implemented in texture classification.
1. It is new and not much popular method.
Local Binary Patterns (LBP)[2]
1. In which center pixel and its corresponding neighbor pixels, calculate thresholding value for neighbor based on centre pixel.
1. Its robustness to monotonic gray-scale changes caused such as illumination variations. 2. Its computational simplicity.
1. Binary data is sensitive to noise.
B. Classifier
Classifier is used for classifying images based on their features.
There are many classifiers are available. Naive Bayes Classifier, k-Nearest Neighbors (k-NN), Support Vector Machine (SVM), Artificial Neural Network (ANN) and Random Forest Tree Classifier.
1. Naive Bayes Classifier
Bayes classifier is a simple probabilistic classifier. It is based on applying Bayes' theorem (from Bayesian statistics).Bayes theorem is basically strong independence assumptions theorem. In [9] used Maximum a Posteriori (MAP) Naive Bayes classifier in which probabilities obtained from the estimates of the probability mass function using training data.
2. k-Nearest neighbour classifier (k-NN)
k-NN is a statistical classifier. k-NN calculate distance metric for samples and classify based on this distance. It assigns data to the most represented category within its closest k neighbours [8].In which mostly Euclidean distance used for distances calculation between the features values of the test input with training fruits. In k-NN algorithm will find out the ‘K’ shortest distance for the input fruit and then after assign the input fruit to their respective class based on ‘K’ values are closest.
3. Support Vector Machines (SVM)
Volume 2, Issue 2, 2015
112 4. Artificial Neural Network (ANN)
Artificial neural network is inspired by the concept of the biological neurons system; it is a most popular method in which it gives top accuracy 99% for date fruit [8].In which two dataset available one for training and another for testing. Train the dataset first after that compares it with testing dataset.
Neural Network (NN) was used for detection of disease for apple fruit and classifies for two apple disease [1] in this paper they are used mean squared error condition for training dataset. In this paper [14] identified normal and infected apple fruits by two layer feed forward network with sigmoid function for neurons. Network is trained with the scaled conjugate gradient back propagation algorithm.
5. Decision Tree Classifier
Decision tree classifier as name suggested is structure like a tree in which first of all source is split into subset based on its attribute values [22].In which leaves represent class labels and branches represent conjunctions of features that lead to those class. This process split the data until no further splitting possible or all has a same value of target variable. Many decision trees are consist by random forest tree classifier and outputs the category based on classes output by particular trees. Each tree gives a classification, and we say the tree "votes" for that class [9]. The forest chooses the classification having the most votes (over all the trees in the forest).
Table 4: Summary of different classifier
Classifier Merits Demerits
Naive Bayes
1. Naive Bayes classifier is required only small amount of training data for classification.
1. It can’t learn interaction between different features because it dependency exist among variable.
k-NN
1. Simple implementation.
2. Classes don’t have to be linearly separable.
1. Sensitiveness to noisy or irrelevant data. 2. Testing procedure is time consuming because of calculation of distance to all known instances.
SVM
1. SVM is well suited to work with high dimensional data.
2. Classification accuracy is more as compared to other conventional classification techniques. 3. SVM is robust enough, even when training samples have some distortion.
1. Selection of kernel function and kernel parameters for mapping original data into higher dimensional data is difficult.
2. Learning process can be time consuming.
ANN
1. Robust and user friendliness and can handle noisy data.
2. Well suited to analyze complex problem.
1. Scalability problem.
2. Require large number training samples. 3. Requires more processing time
Decision Tree
1. Easy to interpret for small-sized trees. 2. Accuracy is comparable to other classification techniques for many simple data sets.
1. Decision tree have been observed to overfit for some datasets with noisy classification/regression tasks.
III. FRUIT GRADING
In fruit grading process first step is to segment the image. After segmentation calculate infected portion of fruit and based on percentage of infection grading the fruits. Segmentation done by different segmentation techniques are as under.
A. Segmentation techniques
Segmentation means identifying region of interest from the image. In other word similar pixels are connected with each other.
Table 5: Summary of different segmentation techniques [11]
Segmentation Method Description Merits Demerits
Histogram Matching
Histogram is constructed having peaks which correspond to a region.
Low computational complexity. No prior information needed.
Spatial details not considered, cannot guarantee the segmented regions to be contiguous.
Region based approaches
Pixels are grouped in the homogeneous regions, and region merging, splitting or their combination is used
Noise immune in edge detection approach
High computational complexity.
Volume 2, Issue 2, 2015
113 Edge detection
approaches
Tries to locate the points having changes in gray level
Works well for high contrast images
Less immune to noise and doesn’t work well if the image have too many edges
Fuzzy approaches
Fuzzy operators, inference rules and properties are applied.
Approximate inference can be performed by fuzzy IF-THEN rules.
Computation can be
intensive and
determination of membership function is not an easy job.
IV.CONCLUSION
In this paper conclude different colour and texture techniques for feature extraction. Each and every technique has some merit and demerits. Based on requirement we want to use method for colour and texture. Also give summaries of different classifier with its merits and demerits ANN and SVM give better accuracy then other classifier. Also see different segmentation techniques with its merits and demerits no such segmentation technique applicable in all images so use any of technique which is suitable for our application.
ACKNOWLEDGMENT
This paperwork would not have been possible without the guidance and the help of several individuals who in one-way or other contributed and extended their valuable assistance in the preparation and completion of this study. The author is very thankful to all the researchers in this ever growing field who have contributed their time and knowledge. I would like to express my deep sense of gratitude to Udesang K. Jaliya and Darshak G. Thakore for their valuable guidance, motivation and forgiving me such an opportunity to explore new ideas. I appreciate all my friends whose direct and indirect contribution helped me a lot to accomplish this survey work and who made the period of my work more pleasant and fruitful. I would also like to thank all the teaching and non-teaching staff for cooperating with me and providing valuable advice and resources which helped me in the completion of this work. Last but not the least I would like to thank my family members, who taught me the value of hard work by their own example. They provided me enormous support during this work directly and indirectly.
REFERENCES
[1] B Monika Jhuria,Ashwani Kumar,Rushikes Borse,”Image Processing for Smart Farming: Detection of Disease and Fruit Grading”2013 IEEE Second International Conference On Image Processing , 9-11 Dec. 2013,Pp. 521 - 526, 2013.
[2] Shiv Ram Dubey and Anand Singh Jalal,” Detection and Classification of Apple Fruit Diseases using Complete Local Binary Patterns” Computer and Communication Technology, 2012 Third International Conference (IEEE) , 23-25 Nov, Pp 346-351,2012.
[3] Nursuriati Jamil, Azlinah Mohamed, Syazwani Abdullah,” Automated Grading of Palm Oil Fresh Fruit Bunches (FFB) using Neuro-Fuzzy Technique” 2009 International Conference of Soft Computing and Pattern Recognition, 4-7 Dec. 2009, Pp. 245-249.
[4] Tajul Rosli B. Razak, Mahmod B. Othman, Mohd Nazari bin Abu Bakar, Khairul Adilah bt Ahmad Ab Razak Mansor,” Mango Grading By Using Fuzzy Image Analysis” International Conference on Agricultural, Environment and Biological Sciences (ICAEBS'2012) ,May 26-27, 2012.
[5] Dheeb Al Bashish, Malik Braik, and Sulieman Bani-Ahmad,” A Framework for Detection and Classification of Plant Leaf and Stem Diseases” 2010 International Conference on Signal and Image Processing.
[6] Xu Liming and Zhao Yancho,“Automatic Strawberry grading system based on image processing”Computers and Electronics in Agriculture,Volume 71,Supplement 1,April 2010,Pp s32-s39.
[7] Yousef Al Ohali ,“Computer vision based date fruit grading system: Design and implementation”Journal of King Saud University –Computer and Information Science (2011)23,Pp29-36 .
[8] Abudulhamid Haidar, Haiwei Dong and Nikolaos Mavridis,” Image-based date fruit classification” Ultra Modern Telecommunications and Control Systems and Workshops (ICUMT), 2012 4th International Congress on , 3-5 Oct 2012, Pp 357-363.
[9] Sudheer reddy bandi,Varadharajan A ,A chinnasamy,“ Performance Evaluation Of Various Statistical Classifiers In Detecting The Diseased Citrus Leaves”, International Journal of Engineering Science & Technology;Feb2013, Vol. 5 Issue 2, p298.
[10]Vishakha Metre, Jayshree Ghorpade,” An Overview of the Research on Texture Based Plant Leaf Classification” IJCSN International Journal of Computer Science and Network, Vol 2, Issue 3, 2013.
[11]H.D. Cheng, X.H. Jiang, Y. Sun, Jingli Wang,"Color image segmentation: advances and prospects"Pattern Recognition,Vol. 34, Issue 12, December 2001, Pp 2259–2281.
Volume 2, Issue 2, 2015
114 [13]Bernard Gosselin,Olivier Kleynen, Vincent Leemans, Marie-France Destain and Olivier Debeir Devrim Unay, "Automatic grading of Bi-coloured apples by multispectral machine vision," Computers and Electronics in Agriculture, November 2010.
[14]Bindu Tiger, Toran Verma,"Identification and Classification of Normal and Infected Apples using Neural Network",International Journal of Science and Research (IJSR), Volume 2 Issue 6, June 2013.
[15]India Rank in Agriculture http://www.apeda.gov.in/apedawebsite/six_head_product/FFV.htm
[16]Digital Image Processing, Third Edition by Rafael C.Gonzalez and Richard E. Woods.
[17]Nur Badariah Ahmad Mustafa, Nurashikin Ahmad Fuad, Syed Khaleel Ahmed, Aidil Azwin Zainul Abidin, Zaipatimah Ali, Wong Bing Yit, and Zainul Abidin Md Sharrif “Image Processing of an Agriculture Produce: Determination of Size and Ripeness of a Banana” Information Technology, 2008. ITSim 2008. International Symposium on, Vol. 1,26-28 Aug. 2008.
[18]Y. Koumpouros, B.D. Mahaman, M. Maliappis, H.C. Passam, A.B. Sideridis, V. Zorkadis ,“Image processing for distance diagnosis in pest management” Computers and Electronics in Agriculture, Vol. 44,Issue 2,August 2004, Pp 121–131.
[19]Xavier P. Burgos-Artizzu,Angela Ribeiro,Maria Guijarro ,Gonzalo Pajares ,“Real-time image processing for crop/weed discrimination in maize fields” Computers and Electronics in Agriculture,Vol. 75, Issue 2, February 2011, Pp 337–346.
[20]J. Romeo, G. Pajares, M. Montalvo, J.M. Guerrero, M. Guijarro, J.M. de la Cruz,“A new Expert System for greenness identification in agricultural images” Expert Systems with Applications,Vol. 40, Issue 6, May 2013, Pp 2275–2286. [21]R.D.Tillett, "Image analysis for agricultural processes: a review of potential opportunities," Journal of Agricultural
Engineering Research, Vol. 50, Pp. 247-258, September-December 1991.
![Table 3: Summary of different texture techniques [10]](https://thumb-us.123doks.com/thumbv2/123dok_us/8873589.1815503/3.595.68.544.89.461/table-summary-different-texture-techniques.webp)
![Table 5: Summary of different segmentation techniques [11]](https://thumb-us.123doks.com/thumbv2/123dok_us/8873589.1815503/4.595.60.546.285.528/table-summary-different-segmentation-techniques.webp)
