Biogeosciences, 10, 6029–6043, 2013 www.biogeosciences.net/10/6029/2013/ doi:10.5194/bg-10-6029-2013
© Author(s) 2013. CC Attribution 3.0 License.
EGU Journal Logos (RGB)
Advances in
Geosciences
Open Access
Natural Hazards
and Earth System
Sciences
Open AccessAnnales
Geophysicae
Open AccessNonlinear Processes
in Geophysics
Open AccessAtmospheric
Chemistry
and Physics
Open AccessAtmospheric
Chemistry
and Physics
Open Access DiscussionsAtmospheric
Measurement
Techniques
Open AccessAtmospheric
Measurement
Techniques
Open Access DiscussionsBiogeosciences
Open Access Open Access
Biogeosciences
DiscussionsClimate
of the Past
Open Access Open Access
Climate
of the Past
Discussions
Earth System
Dynamics
Open Access Open Access
Earth System
Dynamics
DiscussionsGeoscientific
Instrumentation
Methods and
Data Systems
Open Access
Geoscientific
Instrumentation
Methods and
Data Systems
Open Access DiscussionsGeoscientific
Model Development
Open Access Open Access
Geoscientific
Model Development
DiscussionsHydrology and
Earth System
Sciences
Open AccessHydrology and
Earth System
Sciences
Open Access DiscussionsOcean Science
Open Access Open Access
Ocean Science
DiscussionsSolid Earth
Open Access Open Access
Solid Earth
Discussions
The Cryosphere
Open Access Open Access
The Cryosphere
DiscussionsNatural Hazards
and Earth System
Sciences
Open Access
Discussions
Biogeochemical origins of particles obtained from the inversion of
the volume scattering function and spectral absorption in coastal
waters
X. Zhang1, Y. Huot2, D. J. Gray3, A. Weidemann4, and W. J. Rhea3
1Earth System Science and Policy, University of North Dakota, Grand Forks, North Dakota 58202, USA
2Centre d’applications et de recherches en t´el´ed´etection, Universit´e de Sherbrooke, Sherbrooke, QC J1K 2R1, Canada 3US Naval Research Laboratory Code 7231, Washington, DC 20375, USA
4US Naval Research Laboratory Code 7330, Stennis Space Center, MS 39529, USA
Correspondence to: X. Zhang ([email protected])
Received: 2 May 2013 – Published in Biogeosciences Discuss.: 3 June 2013
Revised: 4 August 2013 – Accepted: 5 August 2013 – Published: 13 September 2013
Abstract. In the aquatic environment, particles can be
broadly separated into phytoplankton (PHY), non-algal par-ticle (NAP) and dissolved (or very small parpar-ticle, VSP) frac-tions. Typically, absorption spectra are inverted to quantify these fractions, but volume scattering functions (VSFs) can also be used. Both absorption spectra and VSFs were used to estimate particle fractions for an experiment in the Chesa-peake Bay. A complete set of water inherent optical prop-erties was measured using a suite of commercial instru-ments and a prototype Multispectral Volume Scattering Me-ter (MVSM); the chlorophyll concentration, [Chl] was deMe-ter- deter-mined using the HPLC method. The total scattering coeffi-cient measured by an ac-s and the VSF at a few backward angles measured by a HydroScat-6 and an ECO-VSF agreed with the LISST and MVSM data within 5 %, thus indicat-ing inter-instrument consistency. The size distribution and scattering parameters for PHY, NAP and VSP were inverted from measured VSFs. For the absorption inversion, the “dis-solved” absorption spectra were measured for filtrate pass-ing through a 0.2 µm filter, whereas [Chl] and NAP absorp-tion spectra were inverted from the particulate fracabsorp-tion. Even though the total scattering coefficient showed no correlation with [Chl], estimates of [Chl] from the VSF-inversion agreed well with the HPLC measurements (r=0.68, mean rela-tive errors= −20 %). The scattering associated with NAP and VSP both correlated well with the NAP and “dissolved” absorption coefficients, respectively. While NAP dominated forward, and hence total, scattering, our results also suggest
that the scattering by VSP was far from negligible and domi-nated backscattering. Since the sizes of VSP range from 0.02 to 0.2 µm, covering (a portion of) the operationally defined “dissolved” matter, the typical assumption that colored dis-solved organic matter (i.e., CDOM) does not scatter may not hold, particularly in a coastal or estuarine environment.
1 Introduction
The interaction of light with aquatic particles alters the spec-tral and angular characteristics of the incident light field. In-version approaches in ocean optics are based on our under-standing of these interactions, which allow water constituent properties to be inferred from measurements of the light field. Solutions to inverse problems include single particle (e.g., Green et al., 2003) as well as globe scale (e.g., Siegel et al., 2005) applications. In clear oceanic waters, phytoplank-ton and their decay byproducts are the predominant sources of optical variability (Morel, 1988; Morel and Maritorena, 2001; Gordon et al., 1988). In coastal waters with the pres-ence of particles of various types and origins, each playing a potentially significant optical role (Babin et al., 2003; Morel and Prieur, 1977), it is particularly challenging to link the measured light field to optically active water constituents and their biogeochemical origins.
be-tween the biogeochemical and optical properties of particle populations. In contrast to apparent optical properties, which also depend on the angular distribution of the incident light field, the IOPs depend only on the nature and concentration of the particles, and thus require fewer assumptions or an-cillary measurements to solve the inverse problems. Ignoring inelastic scattering, there are two fundamental inherent op-tical properties: the absorption coefficient (a, m−1)and the volume scattering function (VSF, m−1sr−1). The total scat-tering coefficient (b, m−1)and the backscattering coefficient (bb, m−1)can be derived from the VSF by integration over the appropriate angles. The sum of the absorption and scat-tering coefficients is the attenuation coefficient (c, m−1).
Absorption by particles in the ocean is largely isotropic (i.e., no directional preference); it is the spectral variations of absorption that are generally used for inferring information about water constituents. Two main classes of particles are generally distinguished when interpreting the bulk absorp-tion characteristics of substances present in the water: non-algal matter (NAM), sometimes also referred to as detrital matter, and phytoplankton cells (Sathyendranath et al., 1989; Babin et al., 2003; Magnuson et al., 2004). Putting aside mi-crobes using bacteriochlorophylls and rhodopsin-based pho-tosynthesis, all photosynthesizing microbes contain chloro-phylla (including divinyl chlorophylla) and show a char-acteristic absorption peak near 676 nm and a broader peak centered near 440 to 445 nm. Note, however, that individual spectra can exhibit considerable variability (Bricaud et al., 1998; Ciotti et al., 2002). Spectral absorption by NAM, or-ganic or inoror-ganic, generally has a decreasing exponential shape with respect to wavelength in the visible range (Woz-niak and Dera, 2007). Spectra for mineral particles often have absorption shoulders caused by certain elements (Babin and Stramski, 2004); in small amounts, however, they are gen-erally difficult to distinguish, based only on their absorption characteristics, from the organic portion of NAM (also see Estapa et al., 2012). Analytically, NAM is often separated by filtration through a 0.2 µm filter into two fractions: the dis-solved fraction referred to as colored disdis-solved organic mat-ter (CDOM) and the particulate fraction referred to as the non-algal particulates (NAP). This division, indeed, is a mat-ter of convention and the “dissolved” fraction also contains “undissolved” particles, which we refer to as very small par-ticles (VSP) (Stramski et al., 2001).
Like absorption, there are variations in the spectral shape of scattering (e.g., Doxaran et al., 2009; Gould et al., 1999), which have been used to infer the slope of the bulk parti-cle size distribution in the ocean (Boss et al., 2001; Morel, 1973). However, a significant amount of information about particles can be derived from its angular distribution, often called the volume scattering function (VSF). For example, the backscattering ratio (fraction of scattered light into the backward directions) has been used to infer the bulk refrac-tive index of particles (Twardowski et al., 2001; Boss et al., 2004). Measurements of VSFs at near forward angles, from
commercial instruments, have been used to derive the size distribution of larger particles (∼2 to 200 µm) (Chin et al., 1955; Coston and George, 1991; Knight et al., 1991; Riley and Agrawal, 1991). Building on earlier studies (Gordon and Brown, 1972; Zaneveld et al., 1974), Zhang et al. (2011) de-veloped an inversion method that uses the full angular range of VSFs to retrieve the size and composition of particles. In the inversion, the measured particle VSFs are disaggregated into fractional contributions by particle subpopulations. The VSF-inversion method has been evaluated in several stud-ies with promising results. For waters south of Hawaii, the size distribution of microbubbles inverted from the measured VSFs agreed well with concurrent acoustical results (Czer-ski et al., 2011). In the surf zone off of Scripps Pier, the wave-injected bubble and suspended sediment populations derived from the VSF-inversion were found to be consistent with acoustical measurements of bubbles and video obser-vations of mineral particles, respectively (Twardowski et al., 2012). In three coastal water locations in the United States with complex particle populations, Zhang et al. (2012) com-pared the bulk particle size distributions derived from the VSFs and the commercial LISST instrument; they found dif-ferences of less than 10 % for radiuses from 1 to 100 µm. They also showed that chlorophyll concentrations estimated from inverted particle sub-populations (with refractive in-dices of 1.04–1.06 and radiuses of 0.2–100 µm) covaried with in situ measured chlorophyll concentrations during an ob-served phytoplankton bloom event in the Chesapeake Bay.
Spectral absorption has been routinely measured in the field (Yentsch, 1962), whereas only a few datasets of VSFs have been published in the past (Petzold, 1972; Kullenberg, 1968). It is only recently that more datasets have been mea-sured (Chami et al., 2005; Berthon et al., 2007; Sullivan and Twardowski, 2009) due to the development of two new pro-totype angular scattering sensors, the Multispectral Volume Scattering Meter (MVSM or VSM) (Lee and Lewis, 2003) and the Multi-Angle Scattering Optical Tool (MASCOT) (Twardowski et al., 2012). In the present study, a field ex-periment in Chesapeake Bay with concurrent measurements of spectral absorption and angular scattering provided an op-portunity to examine the biogeochemical sources of both ab-sorption and scattering.
2 Data and methodology
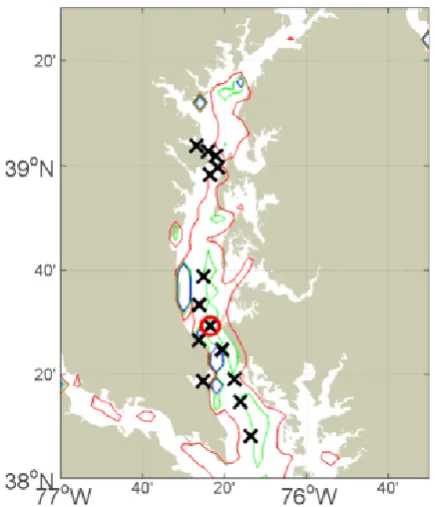
Fig. 1. The sampling locations and bathymetry (red, green and blue contours: 5, 15 and 25 m water depths) in the Chesapeake Bay. The circle highlights station CB3, for which inversion results are shown in Fig. 4.
2.1 Field experiment
The experiment took place in Chesapeake Bay between the 12 and 22 October 2009 (Fig. 1). Chesapeake Bay is a large estuary with considerable and varied freshwater inputs. Par-ticles in the water cover a wide spectrum including: terrige-nous, resuspended sediments, phytoplankton, and non-algal matter of organic origin. Between the 15 and 18 October 2009, radar measurements showed the Chesapeake Bay wa-tershed received around 90 mm of rain, which interrupted the experiment. The following few days had relatively clear skies, and an algal bloom was observed at the sampling sta-tions in the middle of the bay.
A suite of instruments was deployed, including a CTD (Sea-Bird Electronics, Inc., WA), ac-s, ac-9, ECO-VSF, WETstar (all by WETLabs, Inc., OR), HydroScat-6 (HS6, Hobi Labs, Inc., AZ), LISST-100X (Type B; Sequoia, Inc., WA) and MVSM. In addition, water samples were collected for laboratory analysis. All the instruments were deployed at the same time and location but in four different packages. The HS6, LISST and MVSM were deployed separately while the CTD, ac-s, ac-9, ECO-VSF and WETstar were in the same package. Except for the MVSM, which recorded con-tinuously at the surface, all the other instruments took pro-files of the water column. The profile data were binned; the binned data at or closest to the MVSM depth were used in this study.
2.2 Volume scattering functions
The volume scattering function was measured using three commercial instruments (the ECO-VSF, the HydroScat-6 and the LISST-100) as well as one prototype scattering me-ter, the Multispectral Volume Scattering Meter (MVSM).
The ECO-VSF measures the VSF at 100◦, 125◦and 150◦ at 470, 530 and 660 nm. During the deployments, the 100◦ and 125◦channels were incorrectly calibrated, and we were not able to obtain accurate values at those angles (James Sul-livan, personal communication, 2013); they are not presented here. The HydroScat-6 (HS6) measures the VSF at 140◦ at six wavelengths (420, 442, 470, 510, 590 and 700 nm). Both ECO-VSF and HS6 data were processed following the manu-facturers’ protocols, WET Labs ac Meter Protocol Document (Rev. M) and HOBILabs HydroScat-6 Spectral Backscatter-ing Sensor User’s Manual (Rev E), respectively, usBackscatter-ing the default settings.
The LISST-100X that we used operates at 532 nm, and measures VSFs at angles from 0.07 to 13.9◦. To reduce the ambient light contamination, the instrument was deployed vertically with its sensor looking down rather than the normal horizontal position (Zhang et al., 2012). The data collected during a cast were averaged and binned into 0.5 m depth in-tervals. The VSF was calculated following Slade and Boss (2006), and the scattering angles were calculated based on the instrument and detector geometry.
The MVSM operates at eight wavelengths (443, 490, 510, 532, 555, 565, 590, and 620 nm) with a spectral band-pass of 9 nm. It measures VSFs at an angular resolution of 0.25◦ from 0.5 to 179◦. One complete MVSM run takes approxi-mately 10 min. In the field, the instrument was held at a con-stant near-surface depth of about 1.5 m with ambient water pumped at 2 to 3 L per minute through the sample chamber using a SeaBird 5T pump placed at the outlet. For each sta-tion, we collected two complete sets of VSFs, from which an average was computed. This average was then processed following Berthon et al. (2007) to obtain the VSF.
2.3 Absorption coefficient
The attenuation and absorption coefficients were measured using an ac-s and an ac-9. A 0.2 µm AcroPak 1000 cartridge filter (Pall Co., NY) was attached to the intake tube of the ac-9’s a-meter. The corrections for temperature and salinity (Sullivan et al., 2006) were applied to both measurements. The measured absorption and attenuation spectral values for pure water were subtracted from the measurements. With these corrections, the ac-s data provided estimates of non-water attenuation,c0nw, and non-water absorption,anw0 , and the ac-9 data provided estimates of the absorption due to colored dissolved organic matter, a0CDOM. In addition, the aCDOM0 data interpolated at the ac-s wavelengths were sub-tracted from the ac-s’scnw0 andanw0 , providing estimates of particulate attenuation coefficientc0p and absorption coeffi-cienta0p. It is well understood that the attenuation and ab-sorption coefficients (c0 and a0) thus estimated are respec-tively lower and higher than the corresponding “true” val-ues (c and a), because the 0.93◦ acceptance angle of the c-meter also measures near-forward scattering (Boss et al., 2009) while a portion of light that is scattered backward is included in absorption measurements (Zaneveld et al., 1994). The value ofaCDOM0 at 715 nm (assumed to be due to scatter-ing) was subtracted froma0CDOMspectra to estimateaCDOM (e.g., Babin et al., 2003; Magnuson et al., 2004). Zaneveld et al. (1994) method was applied toc0pandap0 to estimateap. When deriving absorption coefficients, a major uncertainty is the near infrared wavelength used as a reference in the scattering correction method. The assumption that absorp-tion due to CDOM and particulates is negligible at 715 nm may not hold in our study area (e.g., Doxaran et al., 2007). However, despite these uncertainties, a recent study shows that the Zaneveld method using 715 nm as the reference per-forms reasonably well (Leymarie et al., 2010).
To obtain an estimate of non-algal particle absorption, the apwas further partitioned into contributions by phytoplank-ton and by non-algal particles (NAP) using a simple spectral inversion (nonlinear least squares fit between the measure-ment and the model) based on the following relationship:
ap(λ)=aPHY(λ)+aNAP(λ)
=[Chl]ac-s(Sfapico∗ (λ)+(1−Sf)amicro∗ (λ)) +aNAP(400)e−SNAP(λ−400)
(1)
In Eq. (1),aPHY(λ) andaNAP(λ) are respectively the phy-toplankton and the NAP absorption coefficients. The phyto-plankton absorption coefficient is represented as the prod-uct of the chlorophyll concentration ([Chl], mg m−3) and the chlorophyll specific absorption coefficient, with the lat-ter estimated as a linear mixing of two phytoplankton species that represent end members for the specific ab-sorption values, apico∗ (m2mg chl−1) for picoplankton and
amicro∗ (m2mg chl−1)for microplankton following Ciotti et al. (2002). In this parameterization,Sf (dimensionless)
rep-resents the fraction of picoplankton in the sample. The absorption by NAP is modeled as an exponentially de-creasing function with a reference value of aNAP(400) at 400 nm and an exponential slope of SNAP (nm−1). We used a bounded least squares method to simultaneously estimate [Chl]ac-s, Sf, aNAP(400) and SNAP. Bounds were set such that the solutions had to be within the following ranges: 0<[Chl]ac-s<60 mg m−3, 0< Sf<1, 0< aNAP(400) <5 m−1, 0.006< SNAP<0.012 nm−1. The bounds set for SNAP were based on the observations of Magnuson et al. (2004) in Chesapeake Bay whereas the bounds for [Chl]ac-sandaNAP(400) were set to be sufficiently high based on in situ data to avoid an artificial ceiling. The fit was carried out between 401 and 713 nm; we omitted the region between 525 and 602 nm because we observed a strong ab-sorption peak likely originating from phycobilins, which is not present in our two extreme spectra. OnlyaNAP(400) and [Chl]ac-s are reported here, but it is worth noting that the retrievedSf were always smaller than 0.07, which is con-sistent with the presence of highly packaged cells, and that aPHY(443) ranged from 8 to 50 % of the total non-water ab-sorption with an average of 30 %. We also note (not shown) that the [Chl]ac-s retrieved with this method showed a corre-lation coefficient of 0.99 with the baseline method (Boss et al., 2007).
2.4 VSF inversion
The theoretical background for general inversion techniques can be found in Twomey (1977). The technical details for the VSF-inversion were reported in Zhang et al. (2011, 2012). In this study, the VSF inversion was performed following Zhang et al. (2012). Briefly, the non-water VSF,βnw(θ )(m−1sr−1), whereθis the scattering angle, is decomposed into the con-tributions (βi(θ ))byM particle subpopulations; this is ac-complished through inversion based on a prescribed kernel functionβ¯=¯
shape either (Bi et al., 2010). Altogether, one set of the VSFs measured at 709 angles is inverted for particle subpopula-tions from approximately 90 (M=92) optically distinctive candidates, with rmode varying from 0.01∼10 µm,σ from 0.1∼1.1, and n from 0.75 (for bubbles) to 1.2. The final output of the VSF inversion includes the scattering coeffi-cient,bi (m−1), and the number concentration,Ni(m−3), for each subpopulation, i.e.,βi(θ )=biβ¯i(θ )andbi=NiCsca,i, where Csca,i (m2) is its average scattering cross-sectional area.
The inverted subpopulations were then grouped into three categories. Very small particles (VSP) represent those sub-populations with rmodei less than 0.1 µm. Since the small-est mode size assumed in the inversion is 0.01 µm, the VSP thus corresponds roughly to the dissolved particles of sizes from 0.02 to 0.2 µm based on filtration with a pore size of 0.2 µm or to small colloidal particles (Stramski and Woz-niak, 2005). The non-VSP subpopulations were divided into two groups: phytoplankton (PHY) including particles whose refractive index is between 1.03 and 1.08 (Aas, 1996, see also Fig. 3), and non-algal particles (NAP) representing everything else. Therefore, bnw=bVSP+bPHY+bNAP and bbnw=bbVSP+bbPHY+bbNAP, where the subscripts refer to the particle types mentioned above. In reality, these fractions may not always partition constituents according to their bio-geochemical properties. For example, some NAP could have a refractive index of 1.05. But, from a modeling point of view, a phytoplankton-type particle and a NAP with a sim-ilar refractive index and size would behave simsim-ilarly in terms of their angular scattering. This is a limitation of the VSF in-version. Heterotrophic bacteria are another example of a lim-itation of the approach. With radii near 0.2 µm and refractive indices around 1.05 (Stramski et al., 2001), such particles, which are part of the NAP, would be included in the phyto-plankton group.
2.5 Chlorophyll concentration
Chlorophyll concentrations were measured on extracts from filtered samples via HPLC ([Chl]HPLC, mg m−3)performed by Horn Point Laboratory analytical services (University of Maryland Center for Environmental Science) using the method of Van Heukelem and Thomas (2001). Additionally, [Chl] was estimated using two methods. The first method was described above using the partitioning of the particulate ab-sorption from the ac-s and ac-9 data.
[image:5.595.307.549.63.225.2]For the second method, following Zhang et al. (2012), [Chl] was estimated from the VSF-inversion results based on the observed relationship between chlorophyll mass per cell ([Chl]cell, g cell−1)and mean cell size (radius) as illustrated in Fig. 2. Compared to Fig. 5 in Zhang et al. (2012), which used data from three studies (Stramski et al., 2001; Taguchi, 1976; Fujiki and Taguchi, 2002), Fig. 2 included data from five additional laboratory experiments reported in (Haardt and Maske, 1987; Morel and Bricaud, 1981; Privoznik et al.,
Fig. 2. The relationship between the chlorophyll mass per cell ([Chl]cell, 10−12g) as a function of cell mean size (r, µm) was¯ evaluated from laboratory measurements on different phytoplank-ton species from Stramski et al. (2001) (SBM01), Taguchi (1976) (T76), Fujiki and Taguchi (2002) (FT02), Haardt and Maske (1987) (HM87), Morel and Bricaud (1981) (MB81), Privoznik et al. (1978) (P87), Bricaud et al. (1983) (B83), Bricaud et al. (1988) (B88), and Osborne and Geider (1989) (OG89). The inset shows the distribu-tion of the refractive index for phytoplankton species measured in SBM01 and B88.
1978; Bricaud et al., 1983, 1988; Osborne and Geider, 1989). The [Chl]VSFwas estimated as,
[Chl]VSF=X i
Ni×0.027× ¯ri2.7, (2)
using the relationship obtained in Fig. 2, and whereNi and ¯
riare respectively the concentration (cell m−3)and the mean radius of subpopulationiwhose refractive index is within the range of 1.03 to 1.08 and the mean radius is between 0.2 to 100 µm.
3 Results and discussion
3.1 Instrumental closure
Since both the ac-s and the MVSM-LISST allow the mea-surement of bnw(532), these two datasets were compared for instrumental closure (Zaneveld, 1994). From the ac-s data, the non-water scattering coefficient was first obtained as b0nw(532)=c0nw(532)−anw0 (532). From the MVSM-LISST VSFs, bnw(532)=2πRθθmax
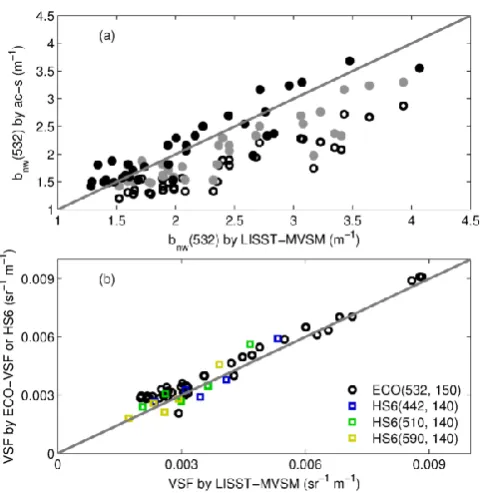
Fig. 3. Intercomparison between different instruments measuring scattering properties. (a) The comparisons ofbnw(532) estimated from the ac-s and LISST-MVSM. Two scattering corrections were progressively applied to (1)anw(532) to correct for scattering at angles from 41◦to 180◦that ac-s a-meter could not measure and (2) the LISST-MVSM basedbnw(532) with integration only down to 0.93◦to match the acceptance angle of ac-s c-meter. Open cir-cles: neither correction was applied; grey circir-cles: the 1stcorrection; black circles: both corrections. (b) The comparison of the LISST-MVSMβ(λ,θ) with ECO-VSF data measured at 150◦at 532 nm and with HydroScat-6 at 140◦ for three wavelengths of 442, 510 and 590 nm. For comparison with HydroScat-6 data, the spectral VSF values at the corresponding wavelengths were used.
affected, and sometimes dominated, by turbulence due to small scale temperature and salinity fluctuations (Bogucki et al., 1998). Second, because the VSF is weighted by a sine function of the scattering angle during the computation of bnw, the error associated with this omission is small, often less than the instrument uncertainty. For example, the underestimation ranged from 1 % if the VSFs were assumed to be flat at the missing forward angles (a typical behavior based on Mie predictions) to 2 % if the VSFs were assumed to increase following a power law (to approximate the influ-ence of turbulinflu-ence; Bogucki et al., 1998). For comparison, the measurement uncertainty for the ac-s is ∼0.005 m−1 (Twardowski et al., 1999), or about 0.2 to 0.5 % in our case, ∼6 % for the LISST (Slade and Boss, 2006), and∼5 % for the MVSM (Berthon et al., 2007).
As shown in Fig. 3a (open circles), the two datasets are highly correlated (Pearson correlation coefficientr=0.93). However, the values ofbnw0 (532)obtained from the ac-s are systematically less than those from the VSFs by an average of 27 % (mean percentage difference, MPD), which is greater than the inherent instrument uncertainties. This underesti-mation of the scattering coefficient by the ac-s is expected (McKee et al., 2008; Leymarie et al., 2010) for two reasons: (1) the effect of the acceptance angle of an ac-s, which, at about 0.9◦, is more than ten times larger than theθminused in estimating bnw from the VSF; and (2) the ac-s a-meter cannot measure scattering at angles larger than ∼41◦ (the critical angle for total internal reflection for the submerged flow tube). Using Monte Carlo simulations based on Fournier and Forand particle phase functions (Fournier and Forand, 1994), McKee et al. (2008) estimate that these effects, if un-corrected, could lead to underestimates of∼67 % or more in bnw. These are about twice as large as the error we observed in Fig. 3a, probably because of the significant differences be-tween the Fournier and Forand phase functions used in the simulation and the VSFs we measured (results not shown). To further evaluate the effect of scattering on a-meter and c-meter measurements, we progressively applied two correc-tions: (1) the proportional scattering error correction was ap-plied toanw0 following Zaneveld et al. (1994) with 715 nm as the reference wavelength, and 2) settingθminto 0.93◦while computingbnwfrom the VSF to correct for the effect of the c-meter acceptance angle (Boss et al., 2009). Applying the first correction (grey circles in Fig. 3a), as is typically done with ac-s data, reduced the MPD by nearly 50 %. Applying both corrections (black circles in Fig. 3a) significantly im-proved the comparison by decreasing the MPD to 3 %, which is well within the instrument uncertainty range. Since the 1st correction is routinely applied to the ac measurements, we estimated that the typical ac-s estimates of the scattering co-efficient (grey circles in Fig. 3a) would have to be multiplied by∼1.20 to match the estimates based on the extended an-gular measurement of the VSF.
The VSF measurements by the ECO-VSF (150◦ at 532 nm) and the Hydroscat-6 (140◦at 442, 510 and 590 nm) were compared with the LISST-MVSM (Fig. 3b). The mea-surements from the three instruments were highly correlated (r=0.94 or better) and agreed with each other within 5 %.
hand, Boss et al. (2004) show that the backscattering ratio estimated from the VSFs measured by the ECO-VSF, HS6 and Volume Scattering Meter (Lee and Lewis, 2003) (a prior version of the MVSM) agreed with each other to within 10 % for coastal waters off New Jersey. Compared with these previous results and considering the inherent instrument uncertainties, we feel that the level of agreement achieved in the present study is acceptable and indicates inter-instrument consistency of the measurements. In the highly spatially and temporally variable coastal waters that we sampled, the scatter in the data would certainly have been reduced if the instruments were deployed in the same package. Hereafter, for our measurements of scattering and backscattering, we will use bnw(532)=2πRθθmax
min βnw(532, θ )sinθdθ, where θmin=0.07◦ and θmax=179◦, and bbnw(532)=2πR90θmaxβnw(532, θ )sinθdθ.
3.2 VSF-inversion results
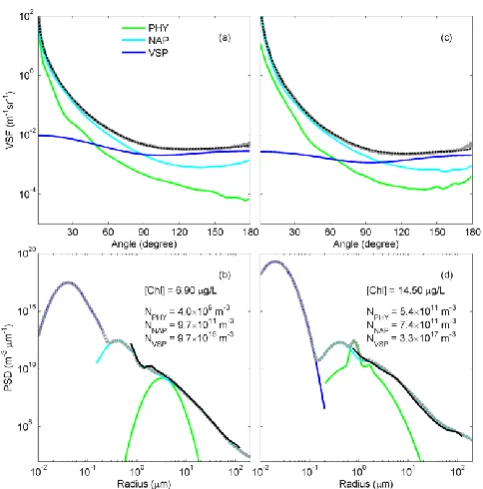
Two examples of the outputs from the inversion are shown in Fig. 4 for station CB3: (1) on 20 October 2009, one day after a week-long heavy precipitation event over the area, and (2) on 22 October 2009, when an algal bloom was observed with more than a 2-fold increase in [Chl]HPLC. The modeled VSF very closely matches the measured VSF (Fig. 4a and c). Comparing the total particle size distribu-tions (PSD), obtained by summing all particle populadistribu-tions, with those from the LISST measurements over the overlap-ping size range (Fig. 4b and d) indicates that the PSDs from the two scattering-based methods agreed very well. An in-depth comparison for coastal areas in the US showed that the overall agreement of the PSDs between the VSF-inversion and LISST is within 10 % (Zhang et al., 2012). During the bloom, when [Chl] more than doubled, the concentration of phytoplankton particles increased by more than two orders of magnitude. This occurred mostly by the addition of smaller cells to those already present, and was accompanied by a twenty-fold increase in VSP, while there was relatively lit-tle change in the NAP concentration. Also, phytoplankton particles became the dominant particle type in the size range from 0.8 to 2 µm during the bloom. As a result, the angular scattering in the backward directions due to phytoplankton particles increased (the green curve in Fig. 4c vs. Fig. 4a), although their overall contribution to the backscattering re-mained small.
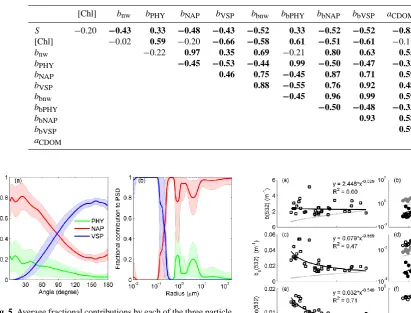
The retrieved average fractional contributions (±one stan-dard deviation) by the three particle groups to the bulk VSFs and PSDs for all VSFs measured are shown in Fig. 5. In the forward directions, the VSF is strongly dominated by NAP scattering, while VSP accounted for most of the observed backscattering (Fig. 5a). For the PSD (Fig. 5b), on aver-age, over 80 % of non-VSP particles are NAP, even though, occasionally (e.g., during the bloom), the retrieved abun-dance of phytoplankton particles exceeded NAP within cer-tain size ranges (also see Fig. 4). Chesapeake Bay has a
di-Fig. 4. Inversion results for station CB3 (circled in di-Fig. 1) on 20 Oc-tober 2009, (a and b), one day after an extended rain event and on 22 October (c and d) when an algal bloom was observed. (a and c) The measured VSFs were partitioned into contributions by phyto-plankton particles (PHY), non-algal particles (NAP) and very small particles (VSP). The solid gray lines are the measured VSFs and the dashed black lines are the sum of the groups’ VSFs representing the best fit obtained during the inversion. (b and d) The corresponding particle size distributions (PSD) for the three particle groups (cut off at the filter pore size of∼0.2 µm). The solid black lines are the PSDs derived from the LISST measurements and the dashed gray lines are the sum of the PSDs for each group. Also shown are the HPLC chlorophyll concentration ([Chl] on the figure) and the parti-cle concentration estimated for each group.
verse assemblage of phytoplankton species dominated by di-atoms throughout the year with large seasonal fluctuations of chlorophytes, cyanobacteria, cryptophytes and dinoflagel-lates (Marshall et al., 2005). From Fig. 5, it appears that phy-toplankton were not the dominant particle type, either numer-ically or in terms of their contribution to scattering, in Chesa-peake Bay during the experiment. Yet, this non-dominant population could be identified and quantified through the VSF-inversion, mainly because phytoplankton particles ex-hibit an angular scattering signature that is distinct from other particles (e.g., Fig. 4a and c).
[image:7.595.307.549.59.304.2]Table 1. Pearson correlation coefficient (r)matrix for parameters that are either directly measured or derived from the inversion.Srepresents salinity. The values in bold face indicate that the correlations are statistically significant (p <0.05). The scattering variables (bnwandbbnw, and their components of PHY, NAP and VSP) are measured and estimated at 532 nm. The absorption coefficients for CDOM and NAP are estimated at 412 nm. The [Chl] is measured using HPLC.
[Chl] bnw bPHY bNAP bVSP bbnw bbPHY bbNAP bbVSP aCDOM aNAP
S −0.20 −0.43 0.33 −0.48 −0.43 −0.52 0.33 −0.52 −0.52 −0.83 −0.64
[Chl] −0.02 0.59 −0.20 −0.66 −0.58 0.61 −0.51 −0.61 −0.11 −0.44
bnw −0.22 0.97 0.35 0.69 −0.21 0.80 0.63 0.55 0.79
bPHY −0.45 −0.53 −0.44 0.99 −0.50 −0.47 −0.33 −0.26
bNAP 0.46 0.75 −0.45 0.87 0.71 0.59 0.80
bVSP 0.88 −0.55 0.76 0.92 0.48 0.59
bbnw −0.45 0.96 0.99 0.59 0.83
bbPHY −0.50 −0.48 −0.33 −0.25
bbNAP 0.93 0.58 0.84
bbVSP 0.59 0.80
[image:8.595.241.539.113.458.2]aCDOM 0.68
Fig. 5. Average fractional contributions by each of the three particle groups to (a) the VSF and (b) the PSD. The shaded areas represent one standard deviation.
Huot et al., 2008) and in other coastal waters (Sullivan et al., 2005),bbnwwas found to decrease with [Chl]HPLC(Fig. 6c) while bnw and [Chl]HPLC were not correlated (R2=0.00, Fig. 6a). As expected from Fig. 6a and c, the backscattering ratio showed significant negative covariation with [Chl]HPLC (Fig. 6e). All relationships empirically derived betweenbnw, bbnw,b˜bnwand [Chl]HPLC(the solid curves in Fig. 6a, c and e) are, as expected, well above published Case 1 water relation-ships (Huot et al., 2008). This is consistent with a greater contribution from VSP and NAP compared with open ocean waters. It is also interesting to note that, as [Chl] increases, all bulk scattering parameters (bnw,bbnwandb˜bnw)approach the Case 1 water relationships; this suggests an influence of phytoplankton and associated particles on thebnwandbbnw that approaches that for open ocean waters.
We examined these relationships more closely using the inverted contribution from the three particle groups (Fig. 6b, d and f). The first and most obvious observation (Fig. 6b) is that the VSPs contribute very little to the total scatter-ing, which is dominated by the forward angles (also see
Fig. 6. Relationships of [Chl]HPLCwith the scattering coefficient (a and b), the backscattering coefficient (c and d), and the backscat-tering ratio (e and f). Open squares (left column) are the bulk pa-rameters estimated directly from the measured VSFs. Open circles, grey circles and black circles (right column) are the variables for the particle groups of VSP, NAP and PHY, derived from the VSF-inversion. The dotted gray line in each panel represents the cor-responding open ocean water model from Huot et al. (2008). The solid line in each panel represents a power-law regression against [Chl]HPLCofbnw(532),bbnw(532) orb˜bnw(532) in (a), (c) and (e) respectively or ofbPHY(532),bbPHY(532) orb˜bPHY(532) in (b), (d) and (f) respectively. The equation of this power-law regression and the corresponding coefficient of determination (R2)are also shown in each panel.
[image:8.595.306.552.277.458.2]in the case of backscattering (Fig. 6d). The VSPs dominate backscattering and the contribution of NAPs is lower by a factor of 2 to 3. Phytoplankton particles are the only ones for which the scattering and backscattering increase with chloro-phyll concentration (r=0.59 and 0.61 for bPHY andbbPHY vs. [Chl]HPLC respectively, Table 1), but they never make up more than 20 % of the total scattering or 10 % of the to-tal backscattering. Previous measurements ofb˜bnwin Case 1 waters have values between∼0.005 and 0.013 (Huot et al., 2008; Antoine et al., 2011; Whitmire et al., 2010) that show no or very little dependence on the trophic level (but see Twardowski et al., 2001) while coastal waters span a much greater range as observed here (also see Twardowski et al., 2001). The particles used for the inversion have a backscat-tering ratio of between 0.002 and 0.005 for NAP and between 0.0007 and 0.0034 for phytoplankton while the VSPs have a backscattering ratio of 0.2 to 0.45. Therefore, the rapid de-crease in the backscattering ratio observed in our study must originate mostly from the decreasing contribution of VSPs with increasing chlorophyll concentration. Indeed, Table 1 shows thatbVSPorbbVSPhad the most negative correlation with [Chl]HPLC.
[image:9.595.311.547.62.190.2]Notably, while bnw andbbnw at high [Chl]HPLC are near the Case 1 water relationships, the phytoplankton fraction of backscattering (bbPHY), even in these high [Chl] waters, is well below that of the “high” chlorophyll Case 1 water rela-tionship. This suggests that even in high chlorophyll Case 1 waters, a significant portion of the backscattering originates from the phytoplankton-associated NAP particles. It has been acknowledged that the homogeneous spherical assumption of the Mie theory is a major uncertainty in estimating the backscattering efficiency of oceanic particles, including phy-toplankton (Stramski et al., 2004; Clavano et al., 2007). To overcome the uncertainty associated with the spherical as-sumption, we used an asymmetric hexahedral shape which was shown to appropriately simulate the scattering by min-eral aerosol particles that do not possess a particular shape (Bi et al., 2010). For phytoplankton particles with the same refractive index and size distribution, using a hexahedral shape generally results in an average 2–3 fold increase in the backscattering ratio. Even with this increased backscat-tering efficiency, our inversion results showed that the phy-toplankton contribution represents 10–70 % of scattering and 3–30 % of backscattering of the Huot et al. (2008) relation-ships (gray lines in Fig. 6), which is still consistent (or at least not contradictory) with the previous theoretical calculations based on the homogeneous spherical assumption (Morel and Ahn, 1991; Stramski and Kiefer, 1991). But there are still uncertainties associated with the homogeneous assumption of particles (e.g., Meyer, 1979).
Fig. 7. Comparison of [Chl] estimated from the VSF-inversions (Eq. 2) and from the absorption spectrum inversion with the HPLC measurements.
3.3 Biogeochemical origins of scattering and absorbing particles
Generally speaking, scattering is mainly affected by the real part of the refractive index whereas absorption depends on the imaginary part, particularly for “soft” particles, such as those in the ocean (e.g., van de Hulst, 1981). For a given particle population, both vary with the number concentra-tion and size distribuconcentra-tion. Therefore, we should expect some consistency between the biogeochemical properties inverted from their respective measurements.
Estimates of [Chl] by the absorption- and the VSF-inversions compared well with [Chl]HPLC (Fig. 7) with r=0.68 and MPD= −20 % for [Chl]VSFvs. [Chl]HPLCand r=0.80 and MPD=9 % for [Chl]ac-s vs. [Chl]HPLC. The general agreement for [Chl] estimated by different methods also supports the validity of the VSF- and the absorption-inversions.
approach was not sensitive to the chlorophyll molecules per se (they form only a small fraction of the total mass) but to the scattering from the whole cell, predominantly com-posed of carbon, the variable carbon to chlorophyll ratio of the cell will add further noise to the relationships. Estimates of phytoplankton biomass, that is the concentration of carbon associated with phytoplankton, would thus probably be bet-ter estimated by the VSF inversion. For example, Martinez-Vicente et al. (2013) found a significant relationship between bbnw(470) and the phytoplankton carbon concentration for Atlantic Ocean waters with [Chl] less than 0.4 mg m−3. It will, thus, be of interest to continue evaluating the perfor-mance of the VSF-inversion technique to verify estimates of cell numbers or carbon concentration (the latter remains dif-ficult to measure in the ocean). Furthermore, at this point, we have not examined if the subpopulations identified by this in-version are associated with specific algal groups. As such, we cautiously prefer to interpret these distributions as providing an overall representation of the whole phytoplankton com-munity. Further work will examine if specific phytoplankton groups can be distinguished.
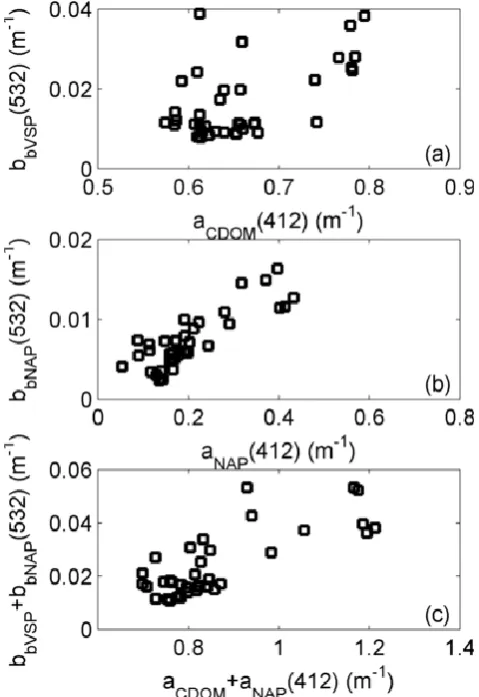
We now turn to the remaining two particle groups. The VSF-inversion distinguishes different particle populations based on the phase functions, which are not very sensitive to absorption (or the imaginary part of the refractive index) (Zhang et al., 2011). Therefore, it is challenging to derive the absorption properties from the VSF-inversion and to com-pare directly with absorption-based estimates. Instead, we examined the covariability between the scattering and the ab-sorption of the two particles groups (Fig. 8).
[image:10.595.308.548.63.412.2]For the VSF-inversion, the VSP group, representing those subpopulations with a mode radius less than 0.1 µm, corre-sponds roughly to dissolved (based on filtration with a pore size of 0.2 µm) particles of sizes (in radius) from 0.01 to 0.1 µm (see Fig. 5b). It should also be noted that for VSPs, the phase functions vary much more strongly with the size distribution than the refractive index (Zhang et al., 2011); therefore, it is difficult to further differentiate VSPs into, say, organic or inorganic fractions, from the VSF-inversion. On the other hand, CDOM estimates based on filtration represent the colored portion of particles and complex molecules with sizes less than the pore size of the filter used. Figure 8a com-pares VSF-inversion derived bbVSP(532) and aCDOM(412) measured using the ac-9 inline with a 0.2 µm filter. The scat-ter betweenbbVSP(532) andaCDOM(412) shown in Fig. 8c is expected because of the differences in the two populations that these two parameters represent and the differences be-tween the optical processes underlying scattering and absorp-tion. Despite these differences, the two variables do correlate with each other significantly (r=0.59, Table 1). Also, both varied inversely with salinity (Table 1), possibly indicating a common source of origin in riverine runoff. While circum-stantial, these factors suggest that there might be a significant overlap between the two particle populations represented by bbVSP(532) and aCDOM(412), respectively. For example, it
Fig. 8. Intercomparisons of measured absorption and estimated backscattering coefficients for CDOM and NAP. (a)aCDOM(412) measured using the ac-9 with a 0.2-µm filter vs.bbVSP(532) esti-mated for the VSP group from the VSF-inversion. (b)aNAP(412) estimated from the ac-s absorption inversion vs.bbNAP(532) esti-mated for the NAP group from the VSF-inversion. (c) absorption coefficient for the NAM population,aCDOM(412)+aNAP(412) vs. the backscattering scattering coefficient for the NAM population, bbVSP(532)+bbNAP(532).
can be expected that filtrate contains small particles that both absorb and scatter light. This also implies that CDOM de-fined based on filtration does scatter light, particularly in the backward direction (also see Fig. 5).
are also slightly higher (though not significantly different) than bbnw(532) and bnw(532). A detailed comparison of aNAP(412) and bbNAP(532) is shown in Fig. 8b. As we ac-knowledged before, the partition for NAP from the VSF-inversion is not exclusive, and it is very likely that natural NAP particles could have an index of refraction in the range of 1.03–1.08. To account for the non-sphericity of natural particles, we have assumed that all particles have a hexa-hedral shape. The shape effect, while negligible for small particles (e.g., VSP), could be significant for larger parti-cles (NAP or PHY) (Mishchenko et al., 2006; Clavano et al., 2007). In spite of these uncertainties, Fig. 8 does indicate a certain level convergence for NAP from both the scattering and absorption perspectives. A similar observation was made by Chami et al. (2006) who found thatβnw(443, 140◦), while having no correlation with phytoplankton absorption, corre-lated significantly withaNAP(400) in a coastal environment in the Black Sea. They further concluded that the same par-ticles contributing toaNAP were also the major contributors toβnw(443, 140◦). But, in this study, we were able to further quantify the scattering caused only by NAP.
Since samples passing through the 0.2 µm filter are es-sentially devoid of chlorophyll-bearing particles (Chavez et al., 1995), the major difference between the dissolved and NAP fractions is the particle size. Indeed, Table 1 shows that the optical properties, either measured or derived for these two general particle fractions, covary significantly (e.g., r=0.80 for aNAP(412) vs. bbVSP(532) and r=0.68 foraCDOM(412) vs.aNAP(412)) and all vary inversely with salinity. If we ignore the operational definition of dissolved particles for the moment (see e.g., Stramski et al., 2004), then the combined dissolved and NAP fractions would rep-resent the total non-algal matter (NAM). One advantage of examining this NAM is that the possible optical effect due to the artificial size partition is reduced. Figure 8c, compar-ingaCDOM(412)+aNAP(412) andbbVSP(532)+bbNAP(532), shows that the two NAM populations based on the VSF- and the absorption-inversions are highly related (r=0.79), either representing the same particle population or two closely cor-related populations. This also explains the existence of gen-eral covariability in the optical properties between these two populations.
4 Conclusions
IOPs provide the fundamental linkage between biogeochemi-cal and optibiogeochemi-cal properties of particle populations. In this con-tribution, we have provided the first experimental evidence that it is possible to invert the VSF to obtain the abundance of “dissolved” matter (VSP and/or CDOM), non-algal parti-cles and phytoplankton populations, which have been tradi-tionally derived from spectral absorption. Indeed, all compar-isons between the concentrations of dissolved matter, NAP and phytoplankton that have been made using
absorption-based methods and those made by inverting the VSF have showed that the estimates were well correlated. Furthermore, the VSF-inversion provided reasonably accurate measure-ments of [Chl] in the complex case 2 waters of Chesapeake Bay. Most notably, the potential for retrieving [Chl] using the VSF-based method was highlighted when both particu-late scattering and backscattering showed, respectively, no correlation and a decreasing relationship with chlorophyll.
Particles, both small and large, scatter light. Even truly dis-solved matter, such as sea salts, scatter light by modifying the density fluctuations of seawater (e.g., Zhang et al., 2009). This certainly applies to operationally-defined dissolved or-ganic matter, including CDOM. However, bio-optical mod-eling often assumes that CDOM has no contribution to scat-tering (or backscatscat-tering) (e.g., Siegel et al., 2005; Lee et al., 2002). This may be the case for clear oceanic water where scattering by CDOM is negligible, but it is questionable for coastal and estuary environments. The VSF-inversion re-sults indicated that while the scattering due to VSPs is typ-ically negligible (at most 5 %) compared with larger parti-cles, VSPs dominated backscattering (Fig. 6). We also found the VSP backscattering correlated significantly with the mea-sured CDOM absorption. Both varied inversely with salinity, possibly indicating a common biogeochemical source con-tributing to both the inferred backscattering and the measured absorption by small (or dissolved) particles.
an underestimation of backscattering, particularly for rela-tively large (i.e., non-VSP) particles, which in turn may lead to an artificial elevation of the retrieved backscattering con-tribution by VSP particles. We do not know the uncertainty associated with this homogeneous particle assumption. How-ever, our results have shown [Chl] estimated for phytoplank-ton particles, which are known to have a variety of internal and “shell” structure among different species, agreed well with the independent HPLC data. While uncertainty remains as to the sources of backscattering, we caution against the “convenient” assumption that CDOM does not scatter light, particularly in turbid coastal waters.
As can be expected for turbid environments such as the Chesapeake Bay, the phytoplankton population was not the dominant particle group either numerically or optically. The NAP population dominated the forward and the total scatter-ing as well as the particle size distribution for sizes greater than∼0.2 µm (Figs. 5 and 6). Both CDOM and NAP pop-ulations correlated significantly with the salinity (Table 1), possibly indicating a common origin from riverine runoff.
Because the VSF-inversion derives the size distribution and the refractive index simultaneously for individual parti-cle populations, this approach holds great potential for identi-fying biogeochemical properties, particularly in combination with spectral measurements of absorption.
Acknowledgements. This research was partially supported by
the US Office of Naval Research. Y. Huot was supported by funding from the Natural Sciences and Engineering Research Council of Canada (NSERC) and the Canada Research Chairs program. X. Zhang acknowledges partial funding support from NASA NNX10AH20G and NSF EPS-081442. We would like to thank Bill Snyder for organizing the deployment and Rick Gould for arranging water sample processing. Nutrient analysis was performed at the University of Maryland’s Chesapeake Biological Laboratory, and chromatographic analysis at the University of Maryland’s Horn Point Laboratory.
Edited by: E. Boss
References
Aas, E.: Refractive index of phytoplankton derived from its metabolite composition, J. Plankton Res., 18, 2223–2249, doi:10.1093/plankt/18.12.2223, 1996.
Antoine, D., Siegel, D. A., Kostadinov, T., Maritorena, S., Nelson, N. B., Gentili, B., Vellucci, V., and Guillocheau, N.: Variability in optical particle backscattering in contrasting bio-optical oceanic regimes, Limnol. Oceanogr., 56, 955–973, 2011.
Babin, M. and Stramski, D.: Variations in the mass-specific absorp-tion coefficient of mineral particles suspended in water, Limnol. Oceanogr., 49, 756–767, 2004.
Babin, M., Stramski, D., Ferrari, G. M., Claustre, H., Bricaud, A., Obolensky, G., and Hoepffner, N.: Variations in the light absorp-tion coefficients of phytoplankton, nonalgal particles, and
dis-solved organic matter in coastal waters around Europe, J. Geo-phys. Res., 108, 3211, doi:10.1029/2001JC000882, 2003. Berthon, J.-F., Shybanov, E., Lee, M. E. G., and Zibordi, G.:
Mea-surements and modeling of the volume scattering function in the coastal northern Adriatic Sea, Appl. Optics, 46, 5189–5203, 2007.
Bi, L., Yang, P., Kattawar, G. W., and Kahn, R.: Modeling optical properties of mineral aerosol particles by using nonsymmetric hexahedra, Appl. Optics, 49, 334–342, 2010.
Bogucki, D. J., Domaradzki, J. A., Stramski, D., and Zaneveld, J. R. V.: Comparison of near-forward light scattering on oceanic turbulence and particles, Appl. Optics, 37, 4669–4677, 1998. Boss, E., Pegau, W. S., Gardner, W. D., Zaneveld, J. R. V., Barnard,
A. H., Twardowski, M. S., Chang, G. C., and Dickey, T. D.: Spec-tral particulate attenuation and particle size distribution in the bottom boundary layer of a continental shelf, J. Geophys. Res., 106, 9509–9516, doi:10.1029/2000jc900077, 2001.
Boss, E., Pegau, W. S., Lee, M., Twardowski, M., Shybanov, E., and Korotaev, G.: Particulate backscattering ratio at LEO 15 and its use to study particle composition and distribution, J. Geophys. Res., 109, C01014, doi:10.1029/2002JC001514, 2004.
Boss, E., Collier, R., Larson, G., Fennel, K., and Pegau, W. S.: Mea-surements of spectral optical properties and their relation to bio-geochemical variables and processes in Crater Lake, Crater Lake National Park, OR, Hydrobiologia, 574, 149–159, 2007. Boss, E., Slade, W. H., Behrenfeld, M., and Dall’Olmo, G.:
Accep-tance angle effects on the beam attenuation in the ocean, Opt. Express, 17, 1535–1550, 2009.
Bricaud, A., Morel, A., and Prieur, L.: Optical efficiency factors of some phytoplankters, Limnol. Oceanogr., 28, 816–832, 1983. Bricaud, A., B´edhomme, A.-L., and Morel, A.: Optical properties
of diverse phytoplanktonic species: experimental results and the-oretical interpretation, J. Plankton Res., 10, 851–873, 1988. Bricaud, A., Morel, A., Babin, M., Allali, K., and Claustre, H.:
Vari-ations of light absorption by suspended particles with chloro-phyll a concentration in oceanic (case 1) waters: Analysis and implication for bio-optical models, J. Geophys. Res., 103, 31033–31044, 1998.
Campbell, J. W.: The lognormal distribution as a model for bio-optical variability in the sea, J. Geophys. Res., 100, 13237– 13254, 1995.
Carder, K., Betzer, P., and Eggimann, D.: Physical, Chemical, and Optical Measures of Suspended-Particle Concentrations: Their Intercomparison and Application to the West African Shelf, in: Suspended Solids in Water, edited by: Gibbs, R., Marine Science, Springer US, 173–193, 1974.
Chami, M., Shybanov, E. B., Churilova, T. Y., Khomenko, G. A., Lee, M. E. G., Martynov, O. V., Berseneva, G. A., and Koro-taev, G. K.: Optical properties of the particles in the Crimea coastal waters (Black Sea), J. Geophys. Res., 110, C11020, doi:10.1029/2005jc003008, 2005.
Chami, M., Shybanov, E. B., Khomenko, G. A., Lee, M. E.-G., Martynov, O. V., and Korotaev, G. K.: Spectral variation of the volume scattering function measured over the full range of scat-tering angles in a coastal environment, Appl. Optics, 45, 3605– 3619, 2006.
Chavez, F. P., Buck, K. R., Bidigare, R. R., Karl, D. M., Hebel, D., Latasa, M., Campbell, L., and Newton, J.: On the chloro-phyllaretention properties of glass-fiber GF/F filters, Limnol. Oceanogr., 40, 428–433, 1995.
Chin, J. H., Sliepcevich, C. M., and Tribus, M.: Particle Size Distributions from Angular Variation of Intensity of Forward-Scattered Light at Very Small Angles, J. Phys. Chem., 59, 841– 844, doi:10.1021/j150531a010, 1955.
Ciotti, A. M., Lewis, M. R., and Cullen, J. J.: Assessment of the re-lationships between dominant cell size in natural phytoplankton communities and the spectral shape of the absorption coefficient, Limnol. Oceanogr., 47, 404–417, 2002.
Clavano, W. R., Boss, E., and Karp-Boss, L.: Inherent Optical Prop-erties of Non-Spherical Marine-Like Particles – From Theory to Observation, in: Oceanography and Marine Biology: An Annual Review, edited by: Gibson, R. N., Atkinson, R. J. A., and Gor-don, J. D. M., Taylor & Francis, Boca Raton, 1–38, 2007. Coston, S. D. and George, N.: Particle sizing by inversion of the
optical transform pattern, Appl. Optics, 30, 4785–4794, 1991. Czerski, H., Twardowski, M., Zhang, X., and Vagle, S.: Resolving
size distributions of bubbles with radii less than 30 µm with op-tical and acousop-tical methods, J. Geophys. Res., 116, C00H11, doi:10.1029/2011jc007177, 2011.
Dall’Olmo, G., Westberry, T. K., Behrenfeld, M. J., Boss, E., and Slade, W. H.: Significant contribution of large particles to optical backscattering in the open ocean, Biogeosciences, 6, 947–967, doi:10.5194/bg-6-947-2009, 2009.
Doxaran, D., Babin, M., and Leymarie, E.: Near-infrared light scat-tering by particles in coastal waters, Opt. Express, 15, 12834– 12849, 2007.
Doxaran, D., Ruddick, K., McKee, D., Gentili, B., Tailliez, D., Chami, M., and Babin, M.: Spectral variations of light scatter-ing by marine particles in coastal waters, from visible to near infrared, Limnol. Oceanogr., 54, 1257–1271, 2009.
Estapa, M. L., Boss, E., Mayer, L. M., and Roesler, C. S.: Role of iron and organic carbon in mass-specific light absorption by particulate matter from Louisiana coastal waters, Limnol. Oceanogr., 57, 97–112, doi:10.4319/lo.2012.57.1.0097, 2012. Fournier, G. R. and Forand, J. L.: Analytical phase function for
ocean water, SPIE Ocean Optics XII, 2258, 194–201, 1994. Fujiki, T. and Taguchi, S.: Variability in chlorophyll a specific
absorption coefficient in marine phytoplankton as a function of cell size and irradiance, J. Plankton Res., 24, 859–874, doi:10.1093/plankt/24.9.859, 2002.
Gordon, H. R. and Brown, O. B.: A theoretical model of light scat-tering by Sargasso Sea particulates, Limnol. Oceanogr., 17, 826– 832, 1972.
Gordon, H. R., Brown, O. B., Evans, R. H., Brown, J. W., Smith, R. C., Baker, K. S., and Clark, D. K.: A semianalytic radiance model of ocean color, J. Geophys. Res., 93, 10909–10924, 1988. Gould, R. W., Arnone, J. R. A., and Martinolich, P. M.: Spectral de-pendence of the scattering coefficient in case 1 and case 2 waters, Appl. Optics, 38, 2377–2383, 1999.
Green, R. E., Sosik, H. M., Olson, R. J., and DuRand, M. D.: Flow cytometric determination of size and complex refractive index for marine particles: comparison with independent and bulk esti-mates, Appl. Optics, 42, 526–541, 2003.
Haardt, H. and Maske, H.: Specific in vivo absorption coefficient of chlorophyllaat 675 nm, Limnol. Oceanogr., 32, 608–619, 1987.
Huot, Y., Morel, A., Twardowski, M. S., Stramski, D., and Reynolds, R. A.: Particle optical backscattering along a chloro-phyll gradient in the upper layer of the eastern South Pa-cific Ocean, Biogeosciences, 5, 495–507, doi:10.5194/bg-5-495-2008, 2008.
Kirk, J. T. O. and Oliver, R. L.: Optical closure in an ultraturbid lake, J. Geophys. Res., 100, 13221–13225, doi:10.1029/95jc00533, 1995.
Kitchen, J. C. and Zaneveld, J. R. V.: A three-layered sphere model of the optical properties of phytoplankton, Limnol. Oceanogr., 37, 1680-1690, 1992.
Knight, J. C., Ball, D., and Robertson, G. N.: Analytical inversion for laser diffraction spectrometry giving improved resolution and accuracy in size distribution, Appl. Optics, 30, 4795–4799, 1991. Kullenberg, G.: Scattering of light by Sargasso Sea water, Deep-Sea
Res., 15, 423–432, 1968.
Lambert, C. E., Jehanno, C., Silverberg, N., Brun-Cottan, J. C., and Chesselet, R.: Log-normal distribution of suspended particles in the open ocean, J. Mar. Res., 39, 77–98, 1981.
Lee, M. E. and Lewis, M. R.: A New Method for the Measurement of the Optical Volume Scattering Function in the Upper Ocean, J. Atmos. Ocean Tech., 20, 563–571, 2003.
Lee, Z., Carder, K. L., and Arnone, R. A.: Deriving inherent optical properties from water color: a multiband quasi-analytical algo-rithm for optically deep waters, Appl. Optics, 41, 5755–5772, 2002.
Leymarie, E., Doxaran, D., and Babin, M.: Uncertainties associated to measurements of inherent optical properties in natural waters, Appl. Optics, 49, 5415–5436, 2010.
Magnuson, A., Harding Jr., L. W., Mallonee, M. E., and Adolf, J. E.: Bio-optical model for Chesapeake Bay and the Mid-dle Atlantic Bight, Estuar. Coast. Shelf. S., 61, 403–424, doi:10.1016/j.ecss.2004.06.020, 2004.
Marshall, H. G., Burchardt, L., and Lacouture, R.: A review of phy-toplankton composition within Chesapeake Bay and its tidal es-tuaries, J. Plankton Res., 27, 1083–1102, 10.1093/plankt/fbi079, 2005.
Martinez-Vicente, V., Dall’Olmo, G., Tarran, G., Boss, E., and Sathyendranath, S.: Optical backscattering is correlated with phytoplankton carbon across the Atlantic Ocean, Geophys. Res. Lett., 40, 1–5, doi:10.1002/grl.50252, 2013.
McKee, D., Piskozub, J., and Brown, I.: Scattering error corrections for in situ absorption and attenuation measurements, Opt. Ex-press, 16, 19480–19492, 2008.
Meyer, R. A.: Light scattering from biological cells: Dependence of backscattering radiation on membrane thickness and refractive index, Appl. Optics, 18, 585–588, 1979.
Mishchenko, M. I., Travis, L. D., and Lacis, A. A.: Multiple Scat-tering of Light by Particles: Radiative Transfer and Coherent Backscattering, Cambridge University Press, Cambridge, 478 pp., 2006.
Morel, A.: The scattering of light by seawater: experimental results and theoretical approach, NATO Advisory Group for Aerospace Research and Development, No. 61, 171, 1973.
Morel, A.: Optical modeling of the upper ocean in relation to its biogenous matter content (Case I waters), J. Geophys. Res., 93, 10749–10768, 1988.
oceanic waters compared to those of bacterial and algal cells, J. Mar. Res., 49, 177–202, 1991.
Morel, A. and Bricaud, A.: Theoretical results concerning light ab-sorption in a discrete medium and application to specific absorp-tion of phytoplankton, Deep-Sea Res., 28, 1375–1393, 1981. Morel, A. and Maritorena, S.: Bio-optical properties of oceanic
wa-ters: A reappraisal, J. Geophys. Res., 106, 7163–7180, 2001. Morel, A. and Prieur, L.: Analysis of variations in ocean color,
Lim-nol. Oceanogr., 22, 709–722, 1977.
Osborne, B. A. and Geider, R. J.: Problems in the assessment of the package effect in five small phytoplankters, Mar. Biol., 100, 151–159, 10.1007/bf00391954, 1989.
Pegau, W. S., Zaneveld, J. R. V., and Voss, K. J.: Toward closure of the inherent optical properties of natural waters, J. Geophys. Res., 100, 13193–13199, 1995.
Peng, F. and Effler, S. W.: Characterizations of individual suspended mineral particles in western Lake Erie: Implications for light scattering and water clarity, J. Great Lakes Res., 36, 686–698, doi:10.1016/j.jglr.2010.08.003, 2010.
Petzold, T. J.: Volume scattering function for selected ocean waters, Scripps Institute of Oceanography, La JollaSIO Ref. 72–78, 79, 1972.
Preisendorfer, R. W.: Hydrologic Optics: Introduction, Pacific Mar. Environ. lab/NOAA, Seattle, 218 pp., 1976.
Privoznik, K. G., Daniel, K. J., and Incropera, F. P.: Absorption, ex-tinction and phase function measurements for algal suspensions of chlorella pyrenoidosa, J. Quant. Spectrosc. Ra., 20, 345–352, 1978.
Quirantes, A. and Bernard, S.: Light-scattering methods for mod-elling algal particles as a collection of coated and/or non-spherical scatterers, J. Quant. Spectrosc. Ra., 100, 315–324, doi:10.1016/j.jqsrt.2005.11.048, 2006.
Riley, J. B. and Agrawal, Y. C.: Sampling and inversion of data in diffraction particle sizing, Appl. Optics, 30, 4800–4817, 1991. Sathyendranath, S., Prieur, L., and Morel, A.: A three-component
model of ocean colour and its application to remote sensing of phytoplankton pigments in coastal waters, Int. J. Remote Sens., 10, 1373–1394, doi:10.1080/01431168908903974, 1989. Siegel, D. A., Maritorena, S., Nelson, N. B., and Behrenfeld, M. J.:
Independence and interdependencies among global ocean color properties: Reassessing the bio-optical assumption, J. Geophys. Res.-Oceans, 110, C07011, doi:10.1029/2004JC002527, 2005. Slade, W. H. and Boss, E. S.: Calibrated near-forward volume
scat-tering function obtained from the LISST particle sizer, Opt. Ex-press, 14, 3602–3615, 2006.
Stramski, D. and Kiefer, D. A.: Light scattering by microorganisms in the open ocean, Prog. Oceanogr., 28, 343–383, 1991. Stramski, D. and Wozniak, S. B.: On the role of colloidal particles in
light scattering in the ocean, Limnol. Oceanogr., 50, 1581–1591, 2005.
Stramski, D., Bricaud, A., and Morel, A.: Modeling the inherent op-tical properties of the ocean based on the detailed composition of the planktonic community, Appl. Optics, 40, 2929–2945, 2001. Stramski, D., Boss, E., Bogucki, D., and Voss, K. J.: The role of
seawater constituents in light backscattering in the ocean, Prog. Oceanogr., 61, 27–56, 2004.
Sullivan, J. M., Twardowski, M. S., Donaghay, P. L., and Freeman, S. A.: Use of optical scattering to discriminate particle types in coastal waters, Appl. Optics, 44, 1667–1680, 2005.
Sullivan, J. M., Twardowski, M. S., Zaneveld, J. R. V., Moore, C. M., Barnard, A. H., Donaghay, P. L., and Rhoades, B.: Hyper-spectral temperature and salt dependencies of absorption by wa-ter and heavy wawa-ter in the 400–750 nm spectral range, Appl. Op-tics, 45, 5294–5309, 2006.
Sullivan, J. M. and Twardowski, M. S.: Angular shape of the oceanic particulate volume scattering function in the backward direction, Appl. Optics, 48, 6811–6819, 2009.
Taguchi, S.: Relationship between photosynthesis and cell size of marine diatom, J. Phycol., 12, 185–189, doi:10.1111/j.1529-8817.1976.tb00499.x, 1976.
Twardowski, M., Zhang, X., Vagle, S., Sullivan, J., Freeman, S., Czerski, H., You, Y., Bi, L., and Kattawar, G.: The optical volume scattering function in a surf zone inverted to derive sediment and bubble particle subpopulations, J. Geophys. Res., 117, C00H17, doi:10.1029/2011JC007347, 2012.
Twardowski, M. S., Sullivan, J. M., Donaghay, P. L., and Zan-eveld, J. R. V.: Microscale Quantification of the Absorption by Dissolved and Particulate Material in Coastal Waters with an ac-9, J. Atmos. Ocean Tech., 16, 691–707, doi:10.1175/1520-0426(1999)016<0691:MQOTAB<2.0.CO;2, 1999.
Twardowski, M. S., Boss, E., Macdonald, J. B., Pegau, W. S., Barnard, A. H., and Zaneveld, J. R. V.: A model for estimating bulk refractive index from the optical backscattering ratio and the implications for understanding particle composition in case I and case II waters, J. Geophys. Res., 106, 14129–14142, 2001. Twardowski, M. S., Claustre, H., Freeman, S. A., Stramski, D.,
and Huot, Y.: Optical backscattering properties of the “clearest” natural waters, Biogeosciences, 4, 1041–1058, doi:10.5194/bg-4-1041-2007, 2007.
Twomey, S.: Introduction to the mathematics of inversion in remote sensing and indirect measurements, Developments in Geomath-ematics, Elsevier Scientific Publishing Company, Amsterdam, 243 pp., 1977.
Ulloa, O., Sathyendranath, S., and Platt, T.: Effect of the particle-size distribution on the backscattering ratio in seawater, Appl. Optics, 33, 7070–7077, 1994.
Vaillancourt, R. D. and Balch, W. M.: Size distribution of marine submicron particles determined by flow field-flow fractionation, Limnol. Oceanogr., 45, 485–492, 2000.
van de Hulst, H. C.: Light Scattering by Small Particles, Dover Pub-lications, Inc., New York, 1981.
Van Heukelem, L. and Thomas, C. S.: Computer-assisted high-performance liquid chromatography method development with applications to the isolation and analysis of phytoplankton pigments, J. Chromatogr. A, 910, 31–49, doi:10.1016/S0378-4347(00)00603-4, 2001.
Westberry, T. K., Dall’Olmo, G., Boss, E., Behrenfeld, M. J., and Moutin, T.: Coherence of particulate beam attenuation and backscattering coefficients in diverse open ocean environments, Opt. Express, 18, 15419–15425, 2010.
Whitmire, A. L., Pegau, W. S., Karp-Boss, L., Boss, E., and Cowles, T. J.: Spectral backscattering properties of marine phytoplankton cultures, Opt. Express, 18, 15073–15093, 2010.
Wozniak, B. and Dera, J.: Light Absorption in Sea Water, Atmo-spheric and Oceanographic Sciences Library, edited by: Mysak, L. A. and Hamilton, K., Springer, New York, 452 pp., 2007. Yentsch, C. S.: Measurement of visible light absorption by
Zaneveld, J. R. V.: Optical Closure: From theory to measurement, in: Ocean Optics, edited by: Spinrad, R. W., Carder, K. L., and Perry, M. J., Oxford University Press, New York, 59–73, 1994. Zaneveld, J. R. V., Roach, D. M., and Pak, H.: The determination
of the index of refraction distribution of oceanic particulates, J. Geophys. Res., 79, 4091–4095, 1974.
Zaneveld, J. R. V., Kitchen, J. C., and Moore, C.: The scattering error correction of reflecting-tube absorption meters, SPIE Ocean Optics XII, 2258, 44–55, 1994.
Zhang, X., Lewis, M. R., and Johnson, B. D.: Influence of bubbles on scattering of light in the ocean, Appl. Optics, 37, 6525–6536, 1998.
Zhang, X., Hu, L., and He, M.-X.: Scattering by pure seawater: Ef-fect of salinity, Opt. Express, 17, 5698–5710, 2009.
Zhang, X., Twardowski, M., and Lewis, M.: Retrieving composi-tion and sizes of oceanic particle subpopulacomposi-tions from the vol-ume scattering function, Appl. Optics, 50, 1240–1259, 2011. Zhang, X., Gray, D., Huot, Y., You, Y., and Bi, L.: Comparison of
![Fig. 2. The relationship between the chlorophyll mass per cell([Chl]cell, 10−12 g) as a function of cell mean size (r¯, µm) wasevaluated from laboratory measurements on different phytoplank-ton species from Stramski et al](https://thumb-us.123doks.com/thumbv2/123dok_us/8168801.251681/5.595.307.549.63.225/relationship-chlorophyll-wasevaluated-laboratory-measurements-different-phytoplank-stramski.webp)
![Fig. 7. Comparison of [Chl] estimated from the VSF-inversions(Eq. 2) and from the absorption spectrum inversion with the HPLCmeasurements.](https://thumb-us.123doks.com/thumbv2/123dok_us/8168801.251681/9.595.311.547.62.190/fig-comparison-estimated-inversions-absorption-spectrum-inversion-hplcmeasurements.webp)