97
International Journal in Management and Social Science http://ijmr.net.in, Email: [email protected]FORECASTING INDEX MOVEMENTS: A STUDY WITH REFERENCE TO SELECTED NSE SECTORAL INDICES.
Dr. L. Vijaya Kumar M.Com., M.Phil. MBA, PGDHRM., B.Ed., Ph.D
Head,
Department of Information Systems Management, Ramakrishna Mission Vivekananda College, Evening College (Autonomous),
Mylapore, Chennai - 600004.
Abstract
The present study is to forecast Index Movement of selected samples indices listed in NSE. For the purpose of analysis, four important sectoral indices namely NSE Auto, NSE FMCG, NSE IT and NSE Pharma were selected, using descriptive statistics, Stationarity Test, Normality Test, Volatility Test and Rescaled Range Analysis for forecasting of Index Movements.. The daily index prices of the selected sample were collected from the official NSE website
(www.nseindia.com). The period of study was 12 years from 1st April 2005 to 31st
March 2017, From the analysis it is concluded that Information flow determines the intensity of returns for Investors. Hence careful evaluation of market information and its sensitivity can help investors retains and earn higher returns in stock markets.
Keywords: Normality Test, Volatility Test, Rescaled Range Analysis, Index Movements, NSE.
1. Introduction
98
International Journal in Management and Social Science http://ijmr.net.in, Email: [email protected]1.1Fundamental Analysis
Fundamental analysis is really a logical and systematic approach to estimate the future share price. It is based on the basic premise that share price is determined by a number of fundamental factors relating to Economy, Industry, and Company. Each share is assumed to have an economic worth based on its present and future earnings capacity. The purpose of the fundamental analysis is to evaluate the present and future earnings capacity of a share based on economy, industry and company fundamentals and thereby assess the fundamental value of the share. It comprises of the following a) Economic Analysis B) Industry Analysis C) Company Analysis.
1.2 Technical Analysis
The Technical Analysis is based on the premise that share prices are determined by the demand and supply forces operating in the market. These demand and supply forces, in turn, are influenced by a number of fundamentals factors as well as certain psychological or emotional factors. The combined impact of all these factors is reflected in the share price movements. The basic premise of technical analysis is that prices move in trends or waves which may be upward or downward. It is believed that the present trends are influenced by the past trends and that the projection of future trends is possible by an analysis of past price trends. The technical analysis is really a study of past or historical price and volume movements so as to predict the future stock price behavior.
2 Review of Literature
The following are the different studies undertaken in the different period to predict the stock market, using other tools which were used for Stock price prediction.
99
International Journal in Management and Social Science http://ijmr.net.in, Email: [email protected]The findings indicated the R/S was useful and robust method when compared to newer method of DFA.
“A Measure of persistence in daily Pound Exchange Rates”, by Brooks. C (2010), identified the persistence in time series, using Hurst exponent and Rescaled range analysis of ten daily pound exchange rates for 5191 observations. The findings indicated that there was a lack of long term memory in the exchange rates.
“Rescaled Range Analysis of the stock market returns”, by PrashantaKharel (2010), analyzed the long memory effects, fractal statistic structure of stock market returns using Re-Scale Range Analysis. The findings indicated that Rescaled range analysis and the values of Hurst exponents for the markets revealed that the market have persistence, bias and demonstrated long memory effects.
“An Analysis of Presence of Long memory in the Indian Foreign Exchange Market” by Anoop S Kumar (2011), identified the presence of long memory in the Indian Foreign Exchange Rate (NEER), using R/S Statistics, Robinson’s Gaussian Semi parametric estimate and Andrews- Guggeenberger modified GPH Estimator for the period of 207 days. The findings indicated the presence of strong version of long memory in the Indian Foreign Exchange market..
In the paper, “Using the GARCH Model to analyze and predict the
different stock markets” by Wei Jiang and Lars Forsberg (2012), introduced several volatility models and predicted the conditional variance about the rate of return in different markets, during the study period 1st April 2007 to 31st March 2011 using GARCH, E – GARCH and GJR GARCH model, for five global stock market indexes NASDAQ’s, Standard and Poor’s 500, FTSE100, HANG SENG and NIKKEI daily index. The findings indicated that the GJR – GARCH and GARCH (1.1) model predict the future conditional variance better than other models.
100
International Journal in Management and Social Science http://ijmr.net.in, Email: [email protected]ARIMA- GARCH, during the study period 1st April 2005 to 31st March 2008,
using Augmented Dickey-Fuller Test . It was found that the GARCH (1,1) model is the superior fit for forecasting the daily closing share prices.
LadislavKristoufek (2012), in the paper entitled “How are Re-scaled Range
Analyses affected by different memory and distributional properties? A Monte Carlo Study” analyzed the effect of different distributional properties and the ability of the methods to efficiently distinguish between short term and long term memory, using classical and modified R/S analysis, ARFIMA and Monte Carlo simulation Techniques. It was concluded that the R/S exhibited biased results upwards for short range dependent process and M-R/S exhibited strong biased results downwards for long range dependency.
Using Range to Standard Deviation Ratio and De-trended Fluctuation
analysis, Mitra. S.K (2012), in the paper entitled “Is Hurst Exponent Value
useful in forecasting Time Series?” measured Hurst Exponent of twelve Stock Index series from across the globe using daily values for ten years for market efficiency. The findings indicated that the Hurst exponent value was found to vary widely when the full series were splitted into smaller series of 60 trading days.
In the paper “Fractal Analysis of Time series and Distribution Properties
of Hurst Exponent”, Malhar Kale and Ferry Butar (2012), analyzed the randomness of time series in terms of persistency or anti persistency process, using rescaled range analysis of Hurst exponent and fractal dimension. It was found that time series data randomly generated from a normal distribution then the estimated Hurst Exponent, because the standard deviations of R/S are less than the DFA.
Using One Dimensional R/S Method, Two Dimensional R/S Method and
Higher Dimension R/S Method, Jie Fan (2013), in the paper entitled “Rescaled
Range Analysis in Higher Dimensions” measured the long range correlations and the presence of periodical features of a time series which were observed on the
Renmin Road of Handan, for the period of 6th December 2011 to 2nd January 2012.
101
International Journal in Management and Social Science http://ijmr.net.in, Email: [email protected]Annette Witt Bruce D. Malamud (2013), in the paper entitled
“Quantification of Long Range Persistence in Geophysical Time Series: Conventional and Benchmark- Based Improvement Techniques ” analyzed the time series on the Earth Sciences, using Hurst R/S analysis , Semi variogram analysis , De-trended fluctuation analysis and Spectral Techniques. It was concluded that the strength of long range persistence of a time series, benchmark – based improvements to the estimator predicted the performance for self affine noise with the same time series length. .
Using ARCH and PARCH model, ZahangirAlam, NomanSiddikee and
Masukujjaman (2013), in the paper entitled “Forecasting Volatility of Stock
Indices with ARCH Model”analyzed the use of ARCH model for forecasting
volatility of the DSE20 and DSE general indices, during the period 1st December
2001to 10th September 2011, using GARCH, ARCH, EGARCH, PARCH and
TARCH. The findings indicated that all the models except GARCH and TARCH models are considered as the best model jointly for DSE20 and DSE general indices return series.
Arowolo W.B (2013), in the article, “Predicting Stock Prices Returns
Using GARCH Model” investigated the forecasting properties of linear GARCH model for daily closing prices of Zenith Bank Plc in Nigeria Stock Exchanges,
during the study period 20th April 2005 to 30th December 2009, using ARCH,
GARCH. The findings indicated that GARCH model was identified to be the most appropriate for the time-varying volatility of the data.
Using Mono Fractal Analysis, Multi Fractal Analysis and Empirical
Analysis, Yi Wang, Xin Su and Xueil Zhen (2015), in the paper entitled “Fractal
102
International Journal in Management and Social Science http://ijmr.net.in, Email: [email protected]“ARIMA / GARCH (1,1) Modeling and Forecasting for a GE Stock Price Using R”, by Varun Milk (2017), developed an understanding of the time series analysis, modeling and forecasting performance using ARIMA, GARCH (1,1) and R during the study period 2001 to 2014. It is found that ARIMA and GARCH (1,1) model is applied to observe the forecasting values of low and high stock price in (USD) for GE company.
3 Research Design
The present study considered selected sectoral Indices listed in National Stock Exchange of India to analyze the behavior of Index prices using Descriptive Statistics, Augmented Dickey Fuller Test Phillips Perron Test for Stationarity , Normality test using Kolmogorov- Smirnov and Shapiro –Wilk Test, Volatility Test using ARCH and GARCH model and Rescaled Range analysis during the
study period 01st April 2005 to 31st March 2017 to assess the index price prediction
using Rescaled Range Analysis for selected sectoral sample return listed National Stock Exchange of India Ltd.
The study is different from earlier studies in the way that Sectoral Indices listed in National Stock Exchange of India namely NSE Auto, NSE FMCG, NST IT and NSE Pharma were taken into consideration for the present study during the
period 01st April 2005 to 31st March 2017. The Index price prediction is an art of
trying to determine the future value of the stock market or other financial instrument traded on the stock exchange. The successful stock market prediction will reveal the increase and extra earnings of the share. Generally, a change occurs in the price of the stock only because of certain changes in the economy, industry or company. Information about these changes alters the stock prices immediately and stock moves to a new level, upwards or downwards, depending on the types of information.
3.1 Statement of the problem
103
International Journal in Management and Social Science http://ijmr.net.in, Email: [email protected]each day is independent. It may be unchanged, higher or lower from the previous price, but that depends on new pieces of information being received in each day.
Fundamentalists believe that it may take several days or weeks before investors can fully assess the impact of new information. As a consequence, the price may be volatile for a number of days before it’s adjusted to a new level. This provides an opportunity to the analyst who is superior analytical to earn excess returns.
The efficient market theory holds the view that in an efficient market, new information is processed and evaluated as it arrives and prices instantaneously adjust to the new and correct level. An investor cannot consistently earn excess returns by undertaking the fundamental and technical analysis.
It is to be noted that the different forms of stock price prediction using Artificial Neural Network have been tested through several methods. While analyzing the previous work related to the present study, the following points were noted Varun Milk (2017) during the study period 2001 to 2014, JaydipSen and TamalDattaChaudhuri (2016), during the study period 2010 to 2015, Veerangna
Singh (2017) 7th August to 7th November 2016) and post demonetization period(8th
November 2016 to 8th February 2018), SerpilTurkyilmaz and MesutBalibey (2014)
etc., The results found that artificial neural networks and regression results are consistent with, but the results demonstrate the advantages and effectiveness of the neural network method than regression in predicting stock prices.
The studies analyzed the stock price prediction using Rescaled Range Analysis from different Stock exchanges. Taking into account, the above analysis, the present study considered the Stock Market Prediction using Rescaled Range with special reference to selected Sectoral Indices listed National Stock Exchange in India (NSE) for analyzing the Share price prediction using Descriptive statistics, Augmented Dickey Fuller Test, Phillips Perron Test for Stationarity, Autocorrelation, Normality test using Kolmogorov- Smirnov and Shapiro –Wilk Test, ARCH and GARCH model and Rescaled Range Analysis during the study period 01st April 2005 to 31st March 2017 selected Sectoral Indices listed in
104
International Journal in Management and Social Science http://ijmr.net.in, Email: [email protected]about these changes alters the stock prices immediately and stock moves to a new level, either upwards or downwards, depending on the type of information. Therefore, it becomes necessary to evaluate the share price returns from time - to - time.
3.2 Need for the Study
The present study is based on the stock market prediction of selected sample sectoral indices listed National Stock Exchange of India. This study will help the investors to assess how the current prices of stock already fully reflect all the information that is contained in the historical sequence of prices. Generally, the Efficient Market Hypothesis, Fundamental Analysis, Technical Analysis and Internet-based data sources are used for analyzing the share price movements and prediction of share return.
The stock brokers and stock market mediators who deal in stock market trading can use the fundamental analysis (Intrinsic Value), Technical analysis (Study of Charts), Traditional Times series Forecasting (Linear Prediction Model and Regression model) and Machine Learning method (Linear and Non linear model) to predict the share price and advice their clients and shareholders to get good returns.
Prediction of the stock market index is an important issue in the financial sector, generally Fractal Dimension can effectively be used to predict the stock prices in the stock market and this gives profitability opportunities to the investors and financial analysts.
Investors in stock exchange need to maximize their profit by buying and selling of securities at an appropriate time. Stock market index nonlinear pattern, so predicting the future prices of the shares is highly difficult.
105
International Journal in Management and Social Science http://ijmr.net.in, Email: [email protected]3.3 Objectives of the study
1. To assess the normality of selected samples Indices listed in Bombay
Stock Exchange of India Ltd and National Stock Exchange of India.
2. To analyze the stationarity of the daily returns of selected sectoral Indices
listed in Bombay Stock Exchange of India ltd and National Stock Exchange of India.
3. To test the Volatility of the returns of selected sectoral Indices listed in Bombay Stock Exchange of India Ltd and National Stock Exchange of India.
4. To analyze and compare the real data with predicted movements of stock
returns using Rescaled Range Analysis.
3.4 Null Hypotheses of the study
H01: There is no normality in the daily index returns of selected Sectoral Indices listed in National Stock Exchange of India (NSE) during the Study period.
H02: There is no stationarity in the daily returns of selected Sectoral Indices
listed in National Stock Exchange of India (NSE) during the study period.
H03: The volatility in thedaily index returns of selected Sectoral Indices
listed in National Stock Exchange of India (NSE) is not significant during the study period.
H04: The daily index returns of selected Sectoral Indices listed in National
Stock Exchange of India (NSE) are no long range dependence during the study period
3.5 Methodology of the Study
3.5.1 Sample Selection
106
International Journal in Management and Social Science http://ijmr.net.in, Email: [email protected]The following Sectoral Indices were selected for the study
Table 3.1 Constituents of Selected National Stock Exchange of India Ltd – NSE Sector & Industry Indices
NSE Indices Meaning
No of
Constituents Launch Date
NIFTY AUTO
The Automobile manufacturing firms listed in NSE are evaluated based on the market capitalization which forms the NSE Nifty Auto.
16
12th July – 2011/01st
January- 2000.
NIFTY FMCG
The Nifty FMCG Index is designed to reflect the behaviour and performance of Fast Moving Consumer Good’s which are non – durable, Mass
Consumption products and available off the shelf. 10
22nd September – 1999/01st
January -1996.
NIFTY IT
The Nifty IT Index captures the performance of
Indian IT Companies. 10
01st
January-1996.
NIFTY PHARMA
Nifty Pharma Index captures the performance of the
Pharmaceutical sector. 10
01st July-2005/01st January- 2001.
Sources: Data Collected from www.nseindia.com as on 27th October – 2017.
3.5.2 Sources of Data
107
International Journal in Management and Social Science http://ijmr.net.in, Email: [email protected]3.5.3 Period of Study
The present study is an attempt to find the stock market prediction using Rescaled Range Analysis of selected Sectoral Indices listed in National Stock
Exchange of India during the study period of 12 years from 1st April 2005 to 31st
March 2017.
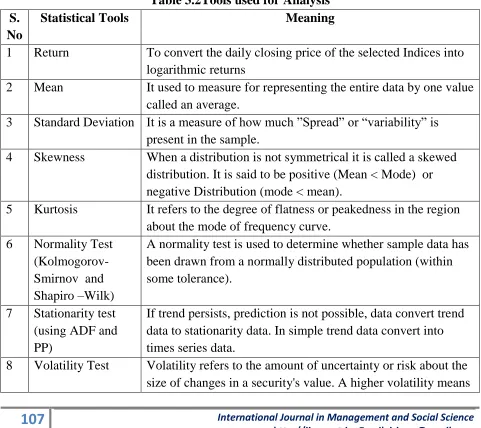
3.5.4 Tools used for Analysis
The following statistical tools were used for the analysis of the returns and
stock prediction for the selected sample during the study period from 1st April 2005
to 31st March 2017
Table 3.2Tools used for Analysis S.
No
Statistical Tools Meaning
1 Return To convert the daily closing price of the selected Indices into
logarithmic returns
2 Mean It used to measure for representing the entire data by one value
called an average.
3 Standard Deviation It is a measure of how much ”Spread” or “variability” is
present in the sample.
4 Skewness When a distribution is not symmetrical it is called a skewed
distribution. It is said to be positive (Mean < Mode) or negative Distribution (mode < mean).
5 Kurtosis It refers to the degree of flatness or peakedness in the region
about the mode of frequency curve.
6 Normality Test
(Kolmogorov- Smirnov and Shapiro –Wilk)
A normality test is used to determine whether sample data has been drawn from a normally distributed population (within some tolerance).
7 Stationarity test
(using ADF and PP)
If trend persists, prediction is not possible, data convert trend data to stationarity data. In simple trend data convert into times series data.
8 Volatility Test Volatility refers to the amount of uncertainty or risk about the
108
International Journal in Management and Social Science http://ijmr.net.in, Email: [email protected]that a security's value can potentially be spread out over a larger range of values. A lower volatility means that a
security's value does not fluctuate dramatically, but changes in value at a steady pace over a period of time.
9. Rescaled Range
Analysis
It is a statistical techniques designed to assess the nature and magnitude of variability in data over a times. It has been used to detect and evaluate the amount of persistence, randomness or mean revision in financial market time’s series data.
3.5.5 Limitations of the Study
The data for the present study was based only on Secondary source and as
such, all the limitations of a secondary source of data applies to the study also.
The duration of the study period is restricted to twelve years from 1st April
2005 to 31st March 2017.
While Calculating Descriptive, Normality, Stationarity and Volatility, only
closing index returns are considered.
The limitations of all statistical tools namely, Summary Statistics,
109
International Journal in Management and Social Science http://ijmr.net.in, Email: [email protected]4 Data Analysis & Discussion
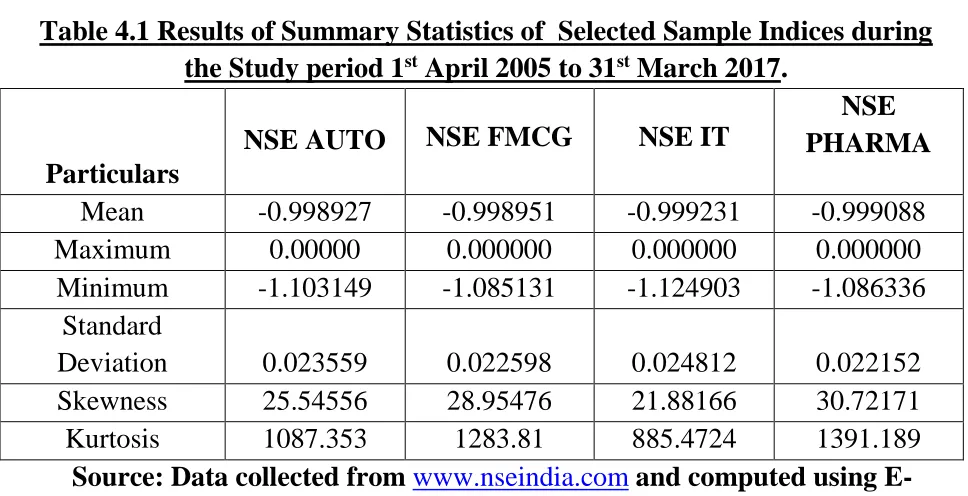
Table 4.1 Results of Summary Statistics of Selected Sample Indices during the Study period 1st April 2005 to 31st March 2017.
Particulars
NSE AUTO NSE FMCG NSE IT
NSE PHARMA
Mean -0.998927 -0.998951 -0.999231 -0.999088
Maximum 0.00000 0.000000 0.000000 0.000000
Minimum -1.103149 -1.085131 -1.124903 -1.086336
Standard
Deviation 0.023559 0.022598 0.024812 0.022152
Skewness 25.54556 28.95476 21.88166 30.72171
Kurtosis 1087.353 1283.81 885.4724 1391.189
Source: Data collected from www.nseindia.com and computed using E-views.
Table 4.1 shows the results of Descriptive statistics of NSE Auto, NSE
FMCG, NSE Information System and NSE Pharma during the study period 1st
April 2005 to 31st March 2017. The Minimum and Maximum values of selected
110
International Journal in Management and Social Science http://ijmr.net.in, Email: [email protected]Table 4.2 Summary Results of Normality Test using Kolmogorov- Smirnov and Shapiro – Wilk Statistic of Sample Indices during the study period
1st April 2005 to 31st March 2017.
Tests of Normality
Kolmogorov-Smirnov Shapiro-Wilk
Particulars
Statistic df Sig. Statisti c
Df Sig.
NSE AUTO 0.145 2978 <0.001 0.445 2978 <0.001
NSE FMCG 0.163 2978 <0.001 0.395 2978 <0.001
NSE IT 0.146 2978 <0.001 0.494 2978 <0.001
NSE PHARMA 0.177 2978 <0.001 0.362 2978 <0.001
Source: Data Collected from www.nseindia,com and Computed Using SPSS.
The results of normality analysis using Kolmogorov-Smirnov and Shapiro-Wilk Test Statistic for NSE Auto, NSE FMCG, NSE IT and NSE Pharma during
the study period 01st April 2005 to 31st March 2017 are presented in Table 4.2. It is
to be noted that the Kolmogorov-Smirnov Statistic was found to be 0.145,0.163,0146,0.177 and Shapiro-Wilk Statistic was .0445,.0395,0.494,0.362 for NSE Auto, NSE FMCG. NSE IT and NSE Pharma respectively, during the study period. With respect to the ‘p’ value, both statistics recorded statistically
significant ‘p’ value at 5% level. Hence the H01: “There is no normality in the
111
International Journal in Management and Social Science http://ijmr.net.in, Email: [email protected]Table 4.3 Summary Results of Stationarity test using Augmented Dickey Fuller Statistic and Phillips-Perron Statistic of Sample Indices during the study period
1st April 2005 to 31st March 2017.
Stationarity test
Particulars
ADF PP 1%
Level
5% Level
10% Level
Sig.
NSE AUTO -29.9132 -29.606 -3.43236 -2.86231 -2.56723 <0.001
NSE FMCG -31.5306 -30.8524 -3.43236 -2.86231 -2.56723 <0.001
NSE IT -35.9673 -35.1746 -3.43236 -2.86231 -2.56723 <0.001
NSE PHARMA -29.0398 -29.1648 -3.43236 -2.86231 -2.56723 <0.001
*MacKinnon (1996) one-sided p-values.
Source: Data collected from www.bseindia.com and Computed using E-views
Table 4.3 shows the results of Stationarity test using Augmented Dickey Fuller (ADF) and Phillips – Perron (PP) statistics for NSE Auto, NSE FMCG. NSE IT and NSE Pharma during the study period 1st April 2005 to 31st March 2017. The Augmented Dickey Filler -29.9132, -31.5306, -35.9673 , -29.0398 and Phillips Perron -29.606, -30.8524, 35.1746, 29.1648 (Ignoring the Sign) for NSE Auto, NSE FMCG. NSE IT and NSE Pharma respectively, was greater than Test critical values at 1% level (-3.43236), 5% level (-2.86231) and 10% level (-2.56723) for selected returns of for NSE Auto, NSE FMCG. NSE IT and NSE Pharma at level range. Further, the Prob Value was less than 0.05 for the selected sample return of
for NSE Auto, NSE FMCG. NSE IT and NSE Pharma (0.000). Hence the H02:
“There is no stationarity in the daily shares price return of Selected Indices”
112
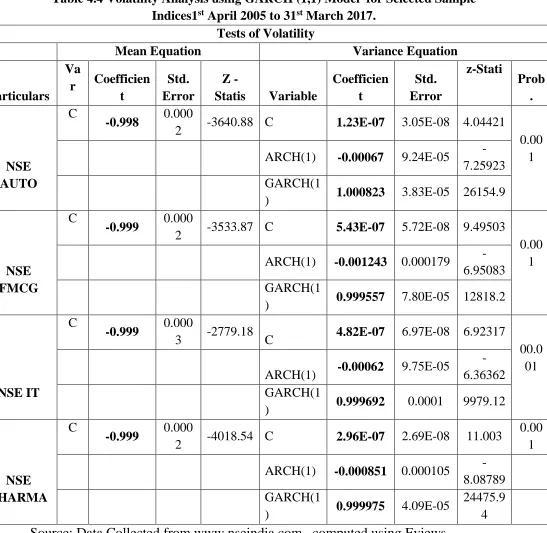
International Journal in Management and Social Science http://ijmr.net.in, Email: [email protected]Table 4.4 Volatility Analysis using GARCH (1,1) Model for Selected Sample
Indices1st April 2005 to 31st March 2017.
Tests of Volatility
Mean Equation Variance Equation
Particulars Va
r Coefficien
t
Std. Error
Z -
Statis Variable
Coefficien t Std. Error z-Stati Prob . NSE AUTO C
-0.998 0.000
2 -3640.88 C 1.23E-07 3.05E-08 4.04421
0.00 1
ARCH(1) -0.00067 9.24E-05
-7.25923 GARCH(1
) 1.000823 3.83E-05 26154.9
NSE FMCG
C
-0.999 0.000
2 -3533.87 C 5.43E-07 5.72E-08 9.49503
0.00 1
ARCH(1) -0.001243 0.000179
-6.95083 GARCH(1
) 0.999557 7.80E-05 12818.2
NSE IT
C
-0.999 0.000
3 -2779.18 C 4.82E-07 6.97E-08 6.92317
00.0 01
ARCH(1) -0.00062 9.75E-05
-6.36362 GARCH(1
) 0.999692 0.0001 9979.12
NSE PHARMA
C
-0.999 0.000
2 -4018.54 C 2.96E-07 2.69E-08 11.003
0.00 1
ARCH(1) -0.000851 0.000105
-8.08789 GARCH(1
) 0.999975 4.09E-05
24475.9 4
113
International Journal in Management and Social Science http://ijmr.net.in, Email: [email protected]Table 4.4 presents the results of the mean and variance Equation of GARCH model for for NSE Auto, NSE FMCG. NSE IT and NSE Pharma daily returns from
1st April 2005 to 31st March 2017. It is to be noted that ‘C’ represent constant. The
findings indicates that the mean equation co efficient was negative (-0.999) and significant at 5% level for for NSE Auto, NSE FMCG. NSE IT and NSE Pharma. The variance equation coefficient of ARCH (1) for NSE Auto, NSE FMCG. NSE IT and NSE Pharma returns were close to Zero (0.000) and The variance equation coefficient of GARCH (1) for NSE Auto, NSE FMCG. NSE IT and NSE Pharma returns were close to one (0.999) . The coefficient of GARCH is closer to one and ARCH (1) parameter was less than Zero. It is found from the above analysis that
the volatility was highly persistent. Hence the H03: “There is no significant
114
International Journal in Management and Social Science http://ijmr.net.in, Email: [email protected]4.5 Rescaled RangeAnalysis Results for selected sample S&P NSE Sectoral Indices during the study period 1st April 2005 to 31st March
2017.
R/S Chart 4.1 for S&P NSE Auto, FMCG, IT and Phrama during the study period 1st April 2005 to 31st March 2017.
Log (R
/S
)
Log (n)
Log R/S Log E(R/S)
0.891
1.825 1.792
Log (R
/S
)
Log (n)
Log R/S Log E(R/S)
0.935
115
International Journal in Management and Social Science http://ijmr.net.in, Email: [email protected]Chart- 4.1 displays the log-log plot, using the empirical (R/S) values and the expected R/S [E(R/S)] values, of S&P NSE Auto, FMCG, IT and Pharama during
Study period from 1st April 2005 to March 2017. For NSE Auto it is clear from the
above Chart that the log R/S plot scale was very close to the log E(R/S) plots from
Log (R
/S
)
Log (n)
Log R/S Log E(R/S)
0.887
1.885
Log (R
/S
)
Log (n)
Log R/S Log E(R/S)
0.9199
116
International Journal in Management and Social Science http://ijmr.net.in, Email: [email protected]starting point 1 to point 7 from Day 1 to Day 200. But the closeness of these two
lines did not continue and the deviation was noticed from 600th day to 1450th day
range from (1.591 to 1.807) after that the plot of Log R/S and Log E R/S again
increased from period 1500th day. Later, the line of log R/S was deviated to that of
log E(R/S) from point 33 (1550th day) to the point 59 (2950th day). It is noted that
for NSE FMCG the expected rescaled range analysis. The highest values (1.825) of
log R/S was recorded during a 2050th and the lowest value (0.819) of log (R/S) was
registered at the starting period (n = 50). The second highest value (1.824) of log
E(R/S) were found for the 2450th days and the second lowest value (1.054) of log
E(R/S) were found for the 100th days period. For NSE IT is noted that the plot
scale of log R/S was close to Log E (R/S) plot from starting to 17th Point i.e., until
500th day i.e., 1.437 from the starting period of time. After that, the R/S plot
deviated on 650th day at the point 17th i.e., (1.528) to 59th point 2950th day i.e.,
1.855. Finally for NSE Pharama from starting to 7th Point i.e., until 550th day i.e.,
1.4856 from the starting period of time. After that, the R/S plot close to Log E R/S
pot from 600th day at the Point 21th i.e., (1.638) to 25th Point 750 day i.e., 1.5416.
From the overall analysis of the above chart, the series of log R/S and log E(R/S) were identical with the random walk. This clearly shows the fact that there was absence of long memory in the case of S&P NSE Auto, NSE FMCG, NSE IT and
NSE Pharama during the study period from 1st April 2005 to 31st March 2017.
Hence the null hypothesis H04,namely, “There is no long range dependence in
the returns of Selected Sample Listed in NSE”, isaccepted.
5 Findings, Suggestions and Conclusion.
5.1 Major Findings of the Study
117
International Journal in Management and Social Science http://ijmr.net.in, Email: [email protected]variance equation for all the selected NSE sectoral indices as the Beta and Alpha value were close to one, for NSE Auto 1.000153, The analysis of V-Statistic of S&P NSE FMCG during the study period clearly reveals the fact that the highest
value of 1.5205 was recorded on 1500th day, followed by 1550th day, with a value
of 1.5109. The S&P NSE Information Technology during the study witnessed less deviations (0.0498) first and next lowest values of 1.0907 and 1.1405 respectively. The analysis of plot of V –Statistic for S&P NSE Pharma during the study period indicates the persistence in the returns generating process as the values were on the large deviation till the end of the study period.
5.2 Suggestions from the study
As all the sectoral indices witnessed negative mean returns, it is advisable for the investors to have a Portfolio of Investors which could help reduce the risk of investors. The S&P NSE FMCG would tend to increase in future also as long range dependence was absent. Hence past prices and current events which have its effect on FMCG companies should be analyzed before considering investments in FMCG. The results of S&P NSE Information Technology shows that the past data influenced the NSE IT Returns, it shows long term memory in the share price hence it was expected to continue the subsequent period also, as a result the stock return of S&P NSE IT would tend to increase in the future also. Hence the investors may use this information for best investment. It is clear that there was a deviation of long range memory in NSE Pharma, because from the second year onwards there is a large deviation between log (R/S) and Log E(R/S). It indicates the fact that the time series was not close to the expected value, when there is a change in the price the investors can easily identify the risk in the market and time.
5.3 Conclusion
The present study made an attempt to find the stock market prediction of selected sectoral indices listed in Bombay Stock Exchange of India Ltd and
National Stock Exchange of India during the study period of twelve years from 1st
April 2005 to 31st March 2017. The present study used different statistical tools,
118
International Journal in Management and Social Science http://ijmr.net.in, Email: [email protected](Augmented Dickey-Fuller and Phillip-Perron) and Volatility test (Autoregressive
Conditional Heteroskedasticity Model and Generalized Autoregressive
Conditionally Heteroskedasticity Model).
From the study, it was found the rescaled range analysis can be a powerful measurement of the current and future share price movement of selected sample of NSE Sectoral Indices. A similar study may be conducted in future to investigate the long term memory persistence in different stock market index with different study period. Comparative study related for NSE and BSE Individual stock price with different tools like ANN, Hurst Component, AFRIMA and Spectral Density or Wavelet model with Weekly or monthly share price.
From the above analysis and findings, it is concluded that Information flow determines the intensity of returns for Investors. Hence careful evaluation of market information and its sensitivity can help investors retains and earn higher returns in stock markets.
Reference from Journal
1. Gabriel Bobeica and Elena Bojesteanu (2008), “Long Memory in Volatility
An investigation on the Central and Eastern European Exchange Rates”, European Research studies, XI (4), 7-18.
2. LadislavKristoufek (2012), “Rescaled Range Analysis and Detrended
Fluctuation Analysis: Finite sample properties and Confidence Intervals”, AUCO Czech Economic Review, 4 , 315-329.
3. Brooks. C (2010), “A Measure of persistence in daily pound exchange
Rates”, Applied Economics letter, 2(11), 428-431.
4. PrashantaKharel (2010),“Rescaled Range analysis of the stock market
returns”, by cited by
file:///C:/Rs%20ana%205th%20May/KharelRescaled2010CSI.pdf.
5. Anoop S Kumar (2011), “An Analysis of Presence of Long memory in the
Indian Foreign Exchange Market””, Geodynamics Research International Bulletin, 4(1), 23-34.
6. Ahmed Ismail EI Hammady, Mohamed Abo Rizka (2011). “Neural
Networks Based Stock Market forecasting”International Journal of
119
International Journal in Management and Social Science http://ijmr.net.in, Email: [email protected]7. T N O Achia, Wangombe A and Emma Anyika (2011), “Time Series
Modeling of returns from the NSE 20 – Share Index: An empirical study of the impact of political climate on market volatility”, Journal of
Business, 1-8.
8. Wei Jiang and Lars Forsberg (2012), “Using the GARCH Model to
analyze and predict the different stock markets”, Uppsala
Universitet,1-27.
9. Sohail Chand, Shahidkamal and Imran Ali (2012), “Modeling and
Volatility Analysis of Share price Using ARCH and GARCH Models”,
World Applied Sciences Journal, 19(1), 77-82.
10.Cipriannecula and AlinaNicoletaRadu (2012), “Long Memory in Eastern
European Financial Markets Returns”, Economic Research, 25(2), 361-378.
11.LadislavKristoufek (2012), “How are rescaled range analyses affected by
different memory and distributional properties? A Monte Carlo Study”,
Institute of Information Theory and Automation, 4(8), 1-15.
12.Mitra. S. K (2012), “Is Hurst Exponent Value useful in Forecasting Time
Series?”,Canadian center of Science and Education, 8(8), 111-120.
13.Malhar Kale and Ferry Butar (2012), “Fractal Analysis of Time series and
Distribution Properties of Hurst Exponent”, Journal of Mathematical Sciences & Mathematical Education, 5(1), 8-19.
14.Jie Fan (2013), “Rescaled Range Analysis in Higher Dimensions”,
Research Journal of Applied Sciences, Engineering and Technology, 5(18), 4489-4492.
15.Annette Witt Bruce D. Malamud (2013), “Quantification of Long Range
Persistence in Geophysical Time Series: Conventional and Benchmark- Based Improvement Techniques”, SurvGeophys, 34, 541-651.
16.ZahangirAlam, NomanSiddikee and Masukujjaman (2013), “Forecasting
Volatility of Stock Indices with ARCH Model”, International Journal of
Financial Research, 4(2), 126-143.
17.Arowolo W.B (2013), “Predicting Stock Prices Returns Using GARCH
120
International Journal in Management and Social Science http://ijmr.net.in, Email: [email protected]18.TogarAlamNapitupulu and YohanesBadimanWijaya (2013). “Prediction of
Stock Price Using Artificial Neural Networks: A case of Indonesia”
journal of Theoretical and Applied Information Technology, 54(1), 104-109.
19.Selene YueXu (2014) “Stock price forecasting Using Information from
Yahoo Finance and Google Trend”, 1 – 10.
20.Oscar Alsing, OktayBahceci (2015), “Stock Market prediction Using
Social Media Analysis”, Retrieved from
file:///H:/PHD%20WORK/Data%20Colection%20for%20Introduction/Journ al%2026th%20Sep/Stock%20Market%20prediction%204th%20Oct/Stock% 20Market%20Prediction%20using%20Social.pdf.
21.SeyedEnayatolahAlavi, HasanaliSinaei and ElhamAfsharirad (2015),
“Predict the trend of stock prices using Machine Learning Techniques”,
International Academic Institute for Science and Technology,2(12),1-11
22.HakobGrigoryan (2015). “Stock prediction using Artificial Neural
Networks Case Study of TAL1T, Nasdaq OMX Baltic Stock” Database
Systems Journal, VI(2),14-23.
23.SerpilTurkyilmaz and MesutBalibey (2014), “Long Memory Behavior in
the Returns of Pakistan Stock Market: AFRIMA – FIGARACH Models”, International Journal of Economics and Financial Issues, 4(2), 400-410.
24.Yi Wang, Xin Su and Xueil Zhen (2015), in the paper entitled “Fractal
Analysis of the Agricultural Products Price Time Series”, International Journal of U and e Service Science and Technology, 8(10), 395-404.
25.Veerangna Singh (2017), “An analysis on the Demonetization Effect on
Sectorial Indices in India”, International Journal of Engineering Technology, Management and Applied Sciences, 5(4), 378-382.
26.Navale G. S, NishantDukhwala and KunalJadhav (2016). “Prediction of
Stock Market Using Data Mining and Artificial Intelligence”.
International journal of Computer Applications, 134 (12), 9-11
27.Pramod Mali, HemangiKarchalakr, Aditya Jain, Ashu Singh and Vikash
Kumar (2017), “Open Price Prediction of Stock Market using
Regression Analysis”, International Journal of Advanced Research in
121
International Journal in Management and Social Science http://ijmr.net.in, Email: [email protected]28.Nirbhey Singh Pahwa, VidhiSoni et al (2017) “Stock Prediction Using
Machine Learning a Review Paper”, International Journal of Computer
Applications, 163(5), 36-43.
29.JaydipSen and TamalDattaChaudhuri (2016), “Decomposition of Time
Series Data of Stock Markets and its Implications for Prediction – An Application for Indian Auto Sector”, Journal of Business,1-13.
30.Varun Milk (2017) “ARIMA / GARCH (1,1) Modeling and Forecasting
for a GE Stock Price Using R”, ELK Asia pacific journal of Marketing and
Retail Management, 8(1), 1-12.
Reference from Books
1. “Stock Market Volatility”, Greg N Gregoriou, 2009, CRC Press – London –
Newyork
2. Security Analysis” – Sidney Cottle, Roger F Murray and Frank E Block,
1998 (5th Edition), MC Graw – Hill Book Company- Newyork.
3. “Market Efficiency: Stock Market Behavior in Theory and Practice –
Volume – II”, Andrew W. L, 1997, an Elgar Reference Collection, Cheltenham, UK.
Reference from Website