Effect of Recombination on the Accuracy of the Likelihood Method for Detecting
Positive Selection at Amino Acid Sites
Maria Anisimova,*
,†,1Rasmus Nielsen
‡and Ziheng Yang*
*Department of Biology, University College London, London WC1E 6BT, United Kingdom,†Center for Mathematics and Physics in the Life Sciences and Experimental Biology (CoMPLEX), University College London, London WC1E 6BT, United Kingdom and‡Department of
Biometrics, Cornell University, Ithaca, New York 14853-7801 Manuscript received July 30, 2002
Accepted for publication March 31, 2003
ABSTRACT
Maximum-likelihood methods based on models of codon substitution accounting for heterogeneous selective pressures across sites have proved to be powerful in detecting positive selection in protein-coding DNA sequences. Those methods are phylogeny based and do not account for the effects of recombination. When recombination occurs, such as in population data, no unique tree topology can describe the evolutionary history of the whole sequence. This violation of assumptions raises serious concerns about the likelihood method for detecting positive selection. Here we use computer simulation to evaluate the reliability of the likelihood-ratio test (LRT) for positive selection in the presence of recombination. We examine three tests based on different models of variable selective pressures among sites. Sequences are simulated using a coalescent model with recombination and analyzed using codon-based likelihood models ignoring recombination. We find that the LRT is robust to low levels of recombination (with fewer than three recombination events in the history of a sample of 10 sequences). However, at higher levels of recombination, the type I error rate can be as high as 90%, especially when the null model in the LRT is unrealistic, and the test often mistakes recombination as evidence for positive selection. The test that compares the more realistic models M7 () against M8 (and) is more robust to recombination, where the null model M7 allows the positive selection pressure to vary between 0 and 1 (and so does not account for positive selection), and the alternative model M8 allows an additional discrete class with ⫽dN/dS that could be estimated to be⬎1 (and thus accounts for positive selection). Identification of sites under positive selection by the empirical Bayes method appears to be less affected than the LRT by recombination.
A
DAPTIVE molecular evolution has long been a sub- al.(2000a) detect positive selection by comparing two ject of intense interest among evolutionary biolo- nested probabilistic models of variableratios among gists. For protein-coding genes, robust evidence for posi- sites, the simpler of which does not allow for sites with tive selection is provided by an excess of nonsynonymous ⬎1 and the more general of which does. When the substitutions relative to synonymous substitutions (see LRT suggests presence of sites under positive selection,Yang andBielawski 2000 for review). If a change of the empirical Bayes approach can be used to identify amino acid offers a selective advantage, causing acceler- locations of those sites in a sequence (NielsenandYang
ated fixation of the nonsynonymous mutation, the non- 1998). Although the underlying evolutionary process is synonymous substitution ratedNwill be higher than the almost certainly more complex than existing models,
synonymous ratedS, with the rate ratio ⫽dN/dS⬎1. the maximum-likelihood (ML) approach provides a
sta-Since positive selection is not expected to act at all tistically sound framework for testing for presence of amino acid sites, much effort has been taken to account sites under positive selection, measuring the strength for variable selective pressures across sites to improve of selection, and identifying critical amino acids under the power of the methods for detecting positive selec- selection (Yanget al.2000a;Anisimovaet al. 2002). tion (e.g., Fitch et al.1997; Nielsen andYang 1998; A number of genes have been detected by the LRT
Suzukiand Gojobori1999; Yamaguchi-Kabata and to be undergoing positive selection. Among the nonviral
Gojobori2000;Yanget al. 2000a). Such methods have examples are mammalian-globin, mitochondrial genes little power to detect positive episodic or directional from hominoids (Yang et al. 2000a), plant chitinases selection but have been successful in detecting recur- (Bishopet al. 2000), abalone sperm lysin (Yang et al. rent diversifying selection. Likelihood-ratio tests (LRTs) 2000b), mammalian female reproductive proteins ( Swan-proposed by Nielsen and Yang (1998) and Yang et sonet al.2001), salmonid iron-binding proteins (Ford 2001), and fimbrial adhesins of Escherichia coli(Peeket al.2001). Positive selective pressure was detected with 1Corresponding author: Department of Biology, University College
LRTs in a number of viral genes: capsid genes of foot-London, Darwin Bldg., Gower St., London WC1E 6BT, United
King-dom. E-mail: [email protected] and-mouth virus (Fareset al.2001;Haydonet al.2001),
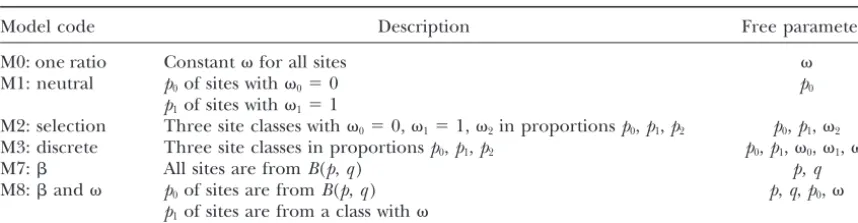
TABLE 1
Models of-ratio variation among sites used for simulation and analysis
Model code Description Free parameters
M0: one ratio Constantfor all sites
M1: neutral p0of sites with0⫽0 p0
p1of sites with1⫽1
M2: selection Three site classes with0⫽0,1⫽1,2in proportionsp0,p1,p2 p0,p1,2 M3: discrete Three site classes in proportionsp0,p1,p2 p0,p1,0,1,2
M7: All sites are fromB(p,q) p, q
M8:and p0of sites are fromB(p,q) p,q,p0, p1of sites are from a class with
the G and N genes of rabies virus (Holmeset al.2002), antigen genes, in which both recombination and posi-tive selection were reported (Wuet al.1999).
and major HIV-1 genes (NielsenandYang1998;Yang
et al.2000a;Yang2001). Recent simulations confirmed that LRTs for detecting positive selection are
conserva-MATERIALS AND METHODS
tive (Anisimovaet al.2001). Those observations suggest
that genes inferred by the LRT to undergo positive Likelihood-ratio tests:In this article we test the accuracy of selection are most likely to be true cases of adaptation likelihood-ratio tests for detecting positive selection at amino
acid sites in the presence of recombination. We consider the
rather than an artifact of the method.
following models of variable selective pressures among sites:
Furthermore, in most of the published studies,
posi-M0 (one ratio), M1 (neutral), M2 (selection), M3 (discrete),
tively selected sites inferred by the Bayes approach were M7 (), and M8 (
and;Yanget al.2000a). See Table 1.
biologically meaningful and/or clustered in a 3D struc- The simplest model, M0, assumes one -ratio for all sites. ture of a protein while being dispersed in the primary Model M1 allows two site classes, conserved sites with0⫽0
and neutrally evolving sites with 1 ⫽ 1. Model M7 allows
sequence (e.g., Bishop et al. 2000; Yang et al. 2000b;
several site classes with-ratios drawn from thedistribution
Peeket al. 2001;YangandSwanson2002).
B(p,q) and, hence, limited between 0 and 1. The three models,
However, patterns of genetic variability created by
M0, M1, and M7, are taken as null hypotheses in the LRTs
recombination can closely resemble the effects of molec- against their alternative models, M3, M2, and M8, respectively. ular adaptation (e.g.,McVean2001). With recombina- Model M3 allowsK discrete site classes with-ratios 0, 1,
. . . ,K–1taken in proportionsp0,p1, . . . ,pK–1. Here we use
tion, nucleotide sites in a sequence do not evolve along
K⫽3 as suggested byYanget al.(2000a). Note that K⫽1
a single tree, but instead along a set of correlated trees
in M0. Model M2 adds an extra class to M1 with an2estimated
(Hudson1983). Recombination leads to apparent
sub-from data. Similarly, model M8 adds one discrete class to M7
stitution rate heterogeneity (Worobey 2001). In phy- withestimated from data. We consider three LRTs: (i) M0 logeny reconstruction, it is known to lead to star-like (one ratio)vs.M3 (discrete), (ii) M1 (neutral)vs.M2
(selec-tion), and (iii) M7 ()vs.M8 (and). We note that the
phylogenies and biases in tests of the molecular clock
M0-M3 comparison is really a test of variability of selective
(SchierupandHein2000a,b). Current codon models
pressures among sites whereas the M1-M2 and M7-M8
compar-of heterogeneous -ratios among sites assume no
re-isons are tests of positive selection.
combination, raising concerns about the possibility that We simulated data under the null model and analyzed them the LRT can mistakenly interpret the effects of recombi- under both the null and the alternative models to calculate
the LRT statistic 2⌬ᐉ(twice the log-likelihood difference
be-nation as evidence for positive selection. Our previous
tween the two models). For each data set, we reconstructed
simulation examined the accuracy of the LRT in
nonre-a neighbor-joining (NJ) tree using PAUP* (Swofford2000).
combinant data sets (Anisimovaet al.2001).
This tree was then used to perform codon-based likelihood
In this article, we use computer simulation to investi- analysis with the codeml program from the PAML package gate whether the LRT can lead to false detection of (Yang2000). The statistic 2⌬ᐉwas compared with the2
distri-bution, with the degree of freedomequal to the difference
positive selection in the presence of recombination. We
in the number of free parameters between the two models;
envisage that the problem mainly concerns viral genes,
we used ⫽ 4 for the M0-M3 comparison and ⫽ 2 for
where sequence divergence is high and recombination
the M1-M2 and M7-M8 comparisons. We note that strictly
may be frequent. Although recombination also occurs speaking, the asymptotic2approximation does not apply to
in population samples from other species such as ani- those tests even without recombination and that our use of
the2distribution makes the LRTs conservative (Anisimova
mals and plants, the sequence divergence is in general
et al. 2001). We counted the number of replicates in which
too low for phylogeny-based likelihood methods to be
the LRT was significant at ␣ ⫽ 5 and 1% (type I errors)
useful (Anisimovaet al.2001). With this consideration
and in which parameter estimates in the alternative models
of sequence divergence in mind, we simulate sequences suggested positive selection; that is,2in M3 and M2 and using codon frequencies and parameter estimates ob- in M8 were⬎1. Those were the cases in which positive
selec-tion was detected falsely.
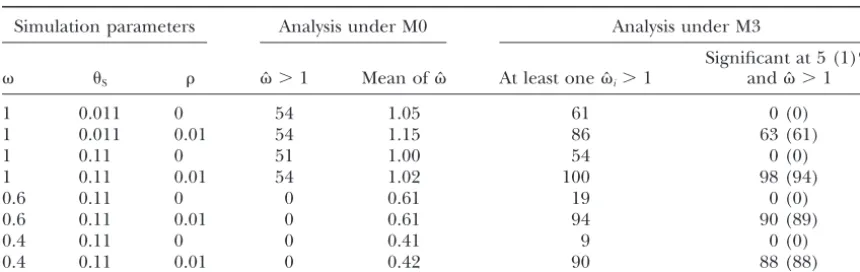
TABLE 2
Number of replicates (out of 100) in the likelihood analysis comparing M0 (one ratio) and M3 (discrete)
Simulation parameters Analysis under M0 Analysis under M3
Significant at 5 (1)% S ˆ⬎1 Mean ofˆ At least oneˆi⬎1 andˆ⬎1
1 0.011 0 54 1.05 61 0 (0)
1 0.011 0.01 54 1.15 86 63 (61)
1 0.11 0 51 1.00 54 0 (0)
1 0.11 0.01 54 1.02 100 98 (94)
0.6 0.11 0 0 0.61 19 0 (0)
0.6 0.11 0.01 0 0.61 94 90 (89)
0.4 0.11 0 0 0.41 9 0 (0)
0.4 0.11 0.01 0 0.42 90 88 (88)
Data sets of 30 sequences were simulated under M0 and analyzed using both M0 and M3. Numbers of replicates significant at 1% are in parentheses.
Coalescent simulation with recombination:Sequence data models M0 (one ratio), M1 (neutral), or M7 (), and analyzed them using both the null models and the alternative models were simulated by generating genealogies for sites in the
se-quence from a standard neutral coalescent model with recom- M3 (discrete), M2 (selection), and M8 (and). We used two levels of sequence divergence at silent sites:S⫽0.011 bination and then using them to “evolve” sequences according
to a codon-substitution model. The genealogies are described and 0.11. The strength of selection was varied by changing the-parameter. Under M0 (one ratio), we used ⫽0.4, 0.6, by anancestral recombination graph, generated by tracing the
sample of DNA sequences backward in time while recording and 1, while under M1, we assumed 0⫽ 0 and1⫽ 1 in equal proportions. Under M7, the -parameters were esti-the coalescent and recombination events (e.g.,Hudson1983;
GriffithsandMarjoram1996;Nielsen2000). While selec- mated from the HDV data:p⫽0.23,q⫽0.41. Reliable
esti-mates of the scaled recombination rateare unavailable for tion clearly operates on a protein-coding gene, we ignore
the effect of selection on the genealogy since currently no viral genes. As a result, we simulated data with different levels of recombination: ⫽0, 0.0001, 0.0005, 0.001, 0.005, and algorithm is available to simulate coalescent trees under both
recombination and strong selection. The parameters involved 0.01, with most of the simulations done using only ⫽ 0 in the coalescent simulation are ⫽2Nand ⫽2Nr, whereN (no recombination) and 0.01 (high level of recombination). is the effective population size,is the mutation (substitution) Details of the parameter values used in the simulation are rate per codon site per generation, andris the recombination given in theresults.
rate per codon site per generation. In this article, we measure In many viral genes, both recombination and positive selec-by the synonymous substitution rate and use the notation tion may be operating. We thus used simulation to examine the S, calculated asdSinGoldman andYang(1994), with the effect of recombination on identification of positively selected expected coalescence time for a pair of sequences replacing sites by the likelihood method. We simulated 30- and 10-taxa branch lengtht. This is the expected number of synonymous data sets using the alternative model M3 (discrete), assuming substitutions per synonymous site between two sequences ⵑ13.5% of sites under positive selection with2⫽2.55 and drawn at random from the population. Furthermore, since the remaining 65.8 and 20.6% of sites with 0⫽ 0.08 and our mutation/substitution model is codon based, we allow 1⫽0.61, respectively, as estimated from the HDV data set. recombination to occur between codons but not within a All replicates were moderately divergent (S⫽0.11) and only codon, so a site below refers to a codon (codon site). two levels of recombination were used ( ⫽0 and ⫽0.01). The gene genealogy can be deduced at each site from the For 10-taxa data sets we varied the strength of positive selection ancestral recombination graph. Evolution of sequences along while keeping other parameters the same: the2values were the genealogy for each site (codon) can be simulated using 2.55 and 6. Data were analyzed using alternative models, and standard methods (e.g., Anisimova et al. 2001). In brief, a sites inferred by the codeml program to be under selection continuous-time Markov chain with rate matrixQ ⫽ {qij} is were compared with the truly selected sites during the simula-superimposed along each lineage of the genealogy of a site. tion. In all simulations the sequence length was 500 codons, Multiple substitutions at the same site are thus allowed. The while the number of replicates was 100.
data were simulated using a C program written by R.N.
Values of parameters used in the simulation:All data sets were generated using codon frequencies and ML parameter
RESULTS estimates obtained from 33 geographically dispersed strains
of a hepatitis D small antigen gene. The GenBank accession
Impact of recombination on the LRT:Table 2 shows
numbers of the hepatitis D antigen strains are AB015442,
the results for the likelihood analysis comparing M0
AB01543, AB015446, AB015447, AB037947–AB037949,
(one ratio) and M3 (discrete), performed on large data
AF018077, AF104263, AF104264, AF209859, AF309420,
AJ309879, AJ309880, D01075, L22063, L22066, M28267, sets of 30 sequences. The data were simulated under
M58299, M58301, M58303, M58305, M58629, M84917, M0. For nonrecombinant data ( ⫽0), the LRT did not M92448, U19598, U25667, U81988, U81989, X04451, X63373,
reject the null model (M0) in any of the 100 replicates,
X77627, and X85253. The transition/transversion ratio was
regardless of the level of selective pressure () or silent
fixed at ⫽3.
TABLE 3
Number of replicates (out of 100) in the likelihood analysis comparing M1 (neutral) and M2 (selection)
Simulation parameters
Analysis under M2
Significant at 5 (1)% S Significant at 5 (1)% ˆ2⬎1 andˆ2⬎1
0.011 0 2 (0) 45 2 (0)
0.011 0.01 74 (61) 100 74 (61)
0.11 0 2 (2) 54 0 (0)
0.11 0.01 80 (71) 99 80 (71)
Data sets of 30 sequences were simulated under M1 (with0⫽0 and1⫽1 in equal proportions). Numbers of replicates significant at 1% are in parentheses.
lower than the significance level (␣ ⫽ 1 or 5%). This LRT was conservative, with the type I error rate lower than the significance level. With recombination ( ⫽ result is consistent with the previous observation that
the use of the 2 makes the LRT comparing M0 and 0.01), the type I error rate increased dramatically to
74% (S⫽0.011) and 80% (S⫽0.11) at the␣ ⫽5% M3 conservative (Anisimovaet al.2001).
However, when the data were simulated with recombi- significance level. Recombination increased the num-ber of replicates in which the ML estimateˆ2in model
nation ( ⫽ 0.01), the LRT falsely rejected the null
model M0 in many replicates. The type I error rate was M2 was⬎1 (Table 3).
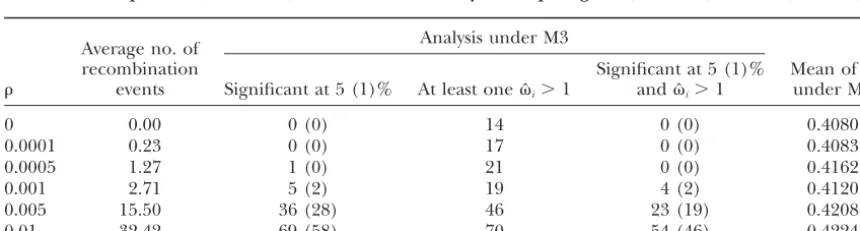
Table 4 summarizes results obtained for different re-much greater than the significance value for all
parame-ter combinations and was higher for more divergent combination rates when the LRT was used to compare models M0 (one ratio) and model M3 (discrete). The sequences (with largerS) and larger. The error rate
was as high as 98% when ⫽ 1, S ⫽ 0.11, and ⫽ average number of recombination events observed in the simulation is shown for each recombination rate. 0.01 at the ␣ ⫽5% significance level. Examination of
parameter estimates under M3 suggests that recombina- When the recombination rate was low, with ⬍0.001 or⬍2.7 recombination events in the history of a sample tion increased the number of replicates in which at least
one of the ML estimates of the-ratios under M3 was of 10 sequences, the LRT was conservative, with the type I error rate lower than the significance level (Table 4).
⬎1 and that, in most such replicates, the M0-M3
compar-ison was significant. Recombination also inflated the When ⫽0.001, the type I error rate was very slightly higher than the significance level␣. Yet the percentage estimates ofunder model M0, but the effect was minor
(Table 2). When ⫽0.01, the recombination rate ap- of replicates with falsely detected positive selection was approximately equal to the significance level␣ (Table pears to be quite high, indicating an average of 32
re-combination events in the history of a sample of 10 4). Increasing recombination rate further made the LRT highly inaccurate: positive selection was falsely de-sequences.
Next we simulated data under the neutral model M1 tected in 23% (for ⫽0.005) and 54% (for ⫽0.01) of replicates at␣ ⫽5%.
to test whether the LRT comparing M1 and M2 was
affected by recombination. The results are shown in Tables 2 and 4 also suggest that the type I error rate of the LRT is higher on big trees with 30 lineages than Table 3. In the absence of recombination ( ⫽0), the
TABLE 4
Number of replicates (out of 100) in the likelihood analysis comparing M0 (one ratio) and M3 (discrete)
Analysis under M3 Average no. of
recombination Significant at 5 (1)% Mean ofˆ events Significant at 5 (1)% At least oneˆi⬎1 andˆi⬎1 under M0
0 0.00 0 (0) 14 0 (0) 0.4080
0.0001 0.23 0 (0) 17 0 (0) 0.4083
0.0005 1.27 1 (0) 21 0 (0) 0.4162
0.001 2.71 5 (2) 19 4 (2) 0.4120
0.005 15.50 36 (28) 46 23 (19) 0.4208
0.01 32.42 69 (58) 70 54 (46) 0.4224
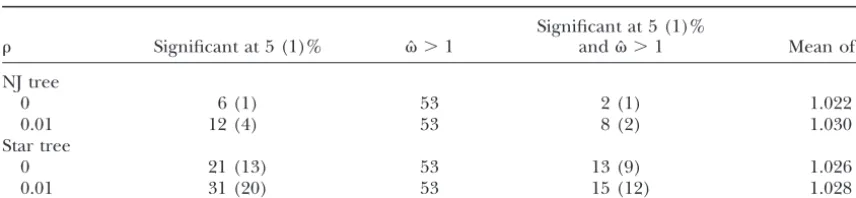
TABLE 5
Number of replicates (out of 100) in the likelihood analysis comparing M7 () and M8 (and)
Analysis under M8
Significant Significant at 5 (1)% at 5 (1)% ˆ ⬎1 andˆ ⬎1
0 8 (4) 47 4 (1)
0.001 7 (5) 49 3 (2)
0.01 21 (12) 81 20 (11)
Data sets of 10 sequences were simulated under M7B(p⫽ 0.23,q⫽0.41) withS⫽0.11. Numbers of replicates significant at 1% are in parentheses.
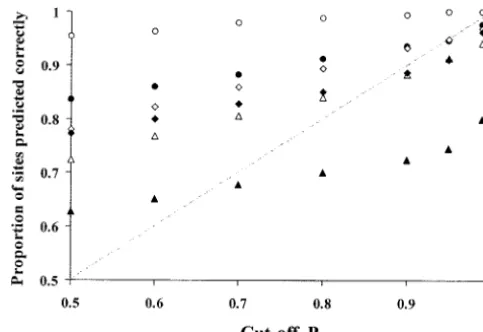
Figure 1.—Accuracy of Bayes’ prediction of amino acid
sites under positive selection, as measured by the proportion
on small trees with 10 lineages. For example, at the 5%
of identified sites that are truly under positive selection. The
significance level, the LRT comparing M0 with M3 failed
data were simulated under M3 (discrete) with 13.5% of sites
in 88% of replicates for 30-lineage data sets and in 54% under positive selection with2⫽2.55. The scaled recombina-of replicates for 10-lineage data sets. Similarly, increas- tion rate was ⫽0 (no recombination) and 0.01 (high recom-ing the mutation/substitution rate leads to an increased bination). Each data set contained 30 sequences, simulated withS⫽0.11 and was analyzed using models M2 (䊊, ⫽0;
false-positive rate in the LRT (Table 2).
䊉, ⫽0.01), M3 (䉭, ⫽0;䉱, ⫽0.01), and M8 (䉫, ⫽
Results obtained for the LRT comparing M7 () and
0;䉬, ⫽0.01).
M8 (and) are summarized in Table 5. As those two models are computationally expensive, we used only
three recombination levels: ⫽0, 0.001, and 0.01. With M0 (one ratio) were always very close to the true value, no recombination ( ⫽ 0), the type I error rate was whichever tree was used (results not shown).
close to the significance level␣(Table 5). A low recom- Bayes’ prediction of sites under positive selection in bination rate, with ⫽ 0.001 or ⵑ2.7 recombination the presence of recombination:In some genes, there is events in a sample of 10 sequences, did not appear to convincing evidence for both recombination and posi-make much difference in terms of the accuracy of the tive selection, and testing for the presence of sites under LRT (Table 5). Increasingto 0.01, orⵑ32 recombina- selection is not as important as identifying sites under tion events in a sample of 10 sequences, caused the LRT selection. Thus we used simulation to evaluate the effect to detect positive selection falsely in 20% of replicates of recombination on the accuracy of Bayes’ prediction at␣ ⫽5%. Although such an error rate is high, it is much of positive selection sites (NielsenandYang1998;Yang lower than the error rate in the M0-M3 comparison for et al.2000a). Data sets with 30 lineages each were ana-the same recombination rate (compare results for ⫽ lyzed to identify sites under selection using three
mod-0.01 in Tables 4 and 5). els: M2 (selection), M3 (discrete), and M8 (and).
The effect of incorrect phylogeny on the LRT: It is We measured the accuracy of Bayes’ prediction by the interesting to know why the LRT generates many false proportion of sites identified by the codeml program positives when the recombination rate is high. One pos- to be under selection that were truly under selection sible reason is that the tree topology is incorrect for (Anisimova et al.2002). Figure 1 shows the results of many sites since recombination causes different seg- the analysis. When there was no recombination ( ⫽ ments of the sequence to have different tree topologies. 0), the accuracy of Bayes’ site prediction was very high
TABLE 6
Counts of replicates (out of 100) in the likelihood analysis comparing M0 (⫽1 fixed) against M0 (estimated)
Significant at 5 (1)%
Significant at 5 (1)% ˆ⬎1 andˆ⬎1 Mean ofˆ
NJ tree
0 6 (1) 53 2 (1) 1.022
0.01 12 (4) 53 8 (2) 1.030
Star tree
0 21 (13) 53 13 (9) 1.026
0.01 31 (20) 53 15 (12) 1.028
Data sets of 10 sequences were simulated under M0 with ⫽ 1 and S ⫽ 0.11. Numbers of replicates significant at 1% are in parentheses.
than predicted: at the 95% cutoff,ⵑ91% of the inferred tree lengths have more of both synonymous and nonsyn-onymous substitutions. At such sites the apparent non-sites were correct. However, when M3 was used for site
identification, accuracy was much lower than predicted: synonymous rate, even if lower than the synonymous rate at that site, can be higher than the average synony-at the 95% cutoff, only 75% of the inferred sites were
predicted correctly. Such differences among models mous rate. Consequently, the method might incorrectly identify such sites as evolving under positive selection. were also found byAnisimova et al.(2002) in
simula-tions without recombination, where models M2 and M8 If this interpretation is correct, accounting for variation in both synonymous and nonsynonymous rates will produced more accurate results than M3 produced,
whichever model was used to simulate data. make the LRTs more robust to the presence of
recombi-nation. Additionally, we investigated how the accuracy of
Bayes’ prediction of selected sites in the presence of This interpretation can be used to explain why the LRT of M7-M8 is much less affected than the LRTs of recombination ( ⫽0.01) was affected by the number
of sampled lineages and by the strength of positive selec- M0-M3 and M1-M2 by the presence of recombination. The M0-M3 comparison is a test for variability among tion. Models M2 and M3 were used to analyze data sets
of 10 lineages. The accuracy of prediction (results not sites. Variation in the tree length introduced by recom-bination can be seen as heterogeneity among sites in shown) was found to be very similar to that with 30
lineages (Figure 1). We also simulated data sets of 10 the gene tree and branch lengths. Thus, it can be ex-pected that the test misinterprets such heterogeneity as lineages using the same model M3 (discrete) but with
the strength of positive selection increased from2 ⫽ variable-ratios. The case of the M1-M2 comparison is similar. Model M1 (neutral) accounts for only two site 2.55 to 2 ⫽ 6. We observed a substantial increase in
both accuracy and power of Bayes’ site prediction (re- classes with 0⫽ 0 and1 ⫽1 and is very unrealistic. As a result, model M2 (selection) misinterprets hetero-sults not shown).
geneity introduced by recombination as evidence for positive selection.
DISCUSSION A second possible reason for the failure of the LRTs
is that the tree topology, estimated by NJ for all sites in Effect of recombination on the LRT:It is not
surpris-the sequence, becomes incorrect for many sites when ing that the LRT becomes unreliable when
recombina-recombination is frequent. It has been pointed out that tion is frequent, since a basic assumption of the model
recombination causes the estimated phylogeny to have is violated. Nevertheless, it is important to understand
long terminal branches resembling a star tree (Schierup
why the test fails at high recombination rates. As yet we
andHein2000a;Worobey2001). Consistent with this do not have a good understanding of possible reasons
interpretation, we found that use of the star topology for the failure of the LRT.
leads to many false positives in the LRT even when there One possible reason is that recombination introduces
is no recombination. variation in the tree length (the sum of branch lengths
To explore this interpretation further, we examined over the genealogy, measured in time) among sites,
another LRT, in which the null model was M0 with which introduces apparent variation in both
synony- ⫽1 fixed, while the alternative model was M0 with mous and nonsynonymous substitution rates among
estimated as a free parameter. The test statistic 2⌬ᐉ sites. The codon models examined in this article
ac-was compared with the 2
1 distribution, using both the
count for variation only in nonsynonymous rates and
star tree and the NJ tree. For nonrecombinant data, the assume a constant rate at synonymous sites. The
2% when the NJ tree was used and 13% when the star that Bayes’ site prediction may still be useful if positive selection is known to operate on the gene.
tree was used (Table 6). The error rate when the NJ
While the effect of recombination on the LRT de-tree was used for recombinant data was 8% (Table 6).
pends on the recombination rate, reliable estimates of Those results appear to be consistent with our
interpre- ⫽2Nrare unavailable for viral genes. The homoplasy tation that recombination generates false positives
index (Maynard and Smith 1998) and informative-partly because the reconstructed tree is wrong for some
sites index (Worobey 2001) are correlated with the sites.
recombination rate, but their exact relationships are The effect of recombination on the LRT depends on
unknown. More rigorous estimation methods are based when in the history of the sample recombination events
on the coalescent model (Griffiths and Marjoram
have occurred. Recombinations in early internal branches
1996; Kuhneret al. 2000; Nielsen 2000; Wall 2000; are more disruptive of the genealogical tree and are
Fearnheadand Donnelly2001; Hudson 2001). For expected to have greater effect than recent
recombina-human genes, most studies suggest the estimates of ⬍ tions near the tips of the tree. If major recombination
10⫺3/bp (e.g.,HeyandWakeley1997;Nielsen2000). events can be identified in the sequence data, removing
Such amounts of recombination have little effect on the sequences involved in such events should increase the
LRT of positive selection; yet human population data performance of the LRT. Factors that affect the shape
typically lack variation so that the LRT is unlikely to of the genealogy and thus the distribution of
recombina-detect an adaptive signal (Anisimova et al.2001). For tion events on it are expected to affect the performance
more divergent data, such as viral genes, estimation of of the LRT as well. The present simulation is conducted
recombination rates is much more problematic. Most under the neutral coalescent model, which generates
methods are based on the neutral mutation model and trees with long internal branches. If the trees are more
do not account for variable selective pressures and thus star-like, such as is the case when the population
ex-do not account for variable substitution rates among pands, recombination will have less effect than that
sites in the gene or for regional positive correlation found in this study. More importantly, both strong
puri-of substitution rates. As a result, they tend to mistake fying and strong diversifying selection are known to
recurrent substitutions as evidence for recombination operate in the viral genome, and genealogies under
(McVeanet al.2002). Subsequently, the range of recom-strong selection may be different from genealogies
un-bination rate estimates in viruses is very wide and there der neutrality. There is, as yet, no theory or algorithm
is no consensus on what rates might be reasonable. A for simulating coalescent trees under strong selection
number of studies discuss the possibility of recombina-and recombination. Nevertheless, we expect that the
tion and positive selection both being present in data: effect of selection on the importance of recombination
e.g., hepatitis D inWuet al.(1999), foot-and-mouth virus to the LRT, through its effect on the tree shape, is
inHaydonet al.(2001), fimbrial major subunit fromE. quantitative rather than qualitative, and our conclusions
coliinPeeket al.(2001), and apical membrane antigen should remain valid. Studies showed that the shape of
1 gene from malaria parasite Plasmodium falciparumin the genealogy was not seriously affected by
weak-to-mod-Polley and Conway(2001). While recombination is erate purifying selection (Golding1997;Przeworski an evolutionary force maintaining genetic diversity, in
et al.1999;Slade2000;WilliamsonandOrive2002) some cases it can be seen as a strategy of evading the or by background selection (Charlesworthet al.1993, immune response, an alternative to diversification (e.g.,
1995;Hudson andKaplan 1994, 1995). Burke 1997). Numerous reports of positive selection
Detecting positive selection in the presence of recom- and recombination coexisting could also be an indica-bination: The simulations suggest that when the re- tion that current methods for detecting recombination combination rate is low, with fewer than about three and positive selection often confuse these two different recombination events in a sample of 10 sequences, the forces, taking one for the other. McVeanet al.(2002) LRT is still accurate. However, much higher recombina- extended the approximate-likelihood method of Hud-tion rates cause the LRT to produce many false positives, son (2001) in an attempt to correct for a higher rate sometimes as high as 100%. We found that Bayes’ pre- of recurrent mutations in viral and bacterial genes. Sim-diction of sites under positive selection is less affected ulations showed that the method was more robust to by recombination. The reason seems to be that Bayes’ misspecifications of the mutation model. However, it is identification of selected sites relies on reconstruction unknown whether an excess of nonsynonymous substi-of the numbers substi-of synonymous and nonsynonymous tutions at nonsynonymous sites causes an overestimation substitutions at individual sites, which is not very sensi- of recombination rate and whether the methods for tive to the tree topology. In contrast to the LRT, increas- detecting recombination are robust to variation of sub-ing the number of lineages in the sample does not stitution rates among sites.
approximation. Given the computational burdens of
selection with recombination. Genetics141:1605–1617. the current coalescent methods and the codon-based Kuhner, M. K., J. YamatoandJ. Felsenstein, 2000 Maximum
likeli-hood estimation of recombination rates from population data. models, such methods are currently computationally
Genetics156:1393–1401. intractable.
Maynard, S. J., andN. H. Smith, 1998 Detecting recombination from gene trees. Mol. Biol. Evol.15:590–599.
We thank two anonymous reviewers for improving the manuscript
McVean, G. A., 2001 What do patterns of genetic variability reveal and Joseph P. Bielawski for discussions. This study was funded by grants
about mitochondrial recombination? Heredity87:613–620. from the Biotechnology and Biological Sciences Research Council to
McVean, G., P. AwadallaandP. Fearnhead, 2002 A coalescent-Z.Y., the Human Frontier Science Program to R.N. and coalescent-Z.Y., and
based method for detecting and estimating recombination from a National Science Foundation grant DEB-0089487 to R.N. M.A. is gene sequences. Genetics160:1231–1241.
supported by a Medical Research Council studentship. Nielsen, R., 2000 Estimation of population parameters and recom-bination rates from single nucleotide polymorphisms. Genetics
154:931–942.
Nielsen, R., andZ. Yang, 1998 Likelihood models for detecting positively selected amino acid sites and applications to the HIV-1
LITERATURE CITED envelope gene. Genetics148:929–936.
Peek, A. S., V. Souza, L. E. EguiarteandB. S. Gaut, 2001 The Anisimova, M., J. P. BielawskiandZ. Yang, 2001 Accuracy and interaction of protein structure, selection, and recombination power of the likelihood ratio test to detect adaptive molecular on the evolution of the type 1 fimbrial major subunit (fimA) evolution. Mol. Biol. Evol.18:1585–1592. fromEscherichia coli.J. Mol. Evol.52:193–204.
Anisimova, M., J. P. BielawskiandZ. Yang, 2002 Accuracy and Polley, S. D., andD. J. Conway, 2001 Strong diversifying selection power of Bayes prediction of amino acid sites under positive on domains of thePlasmodium falciparumapical membrane
anti-selection. Mol. Biol. Evol.19:950–958. gen 1 gene. Genetics158:1505–1512.
Bishop, J. G., A. M. DeanandT. Mitchell-Olds, 2000 Rapid evolu- Przeworski, M., B. CharlesworthandJ. D. Wall, 1999 Genealo-tion in plant chitinases: molecular targets of selecGenealo-tion in plant- gies and weak purifying selection. Mol. Biol. Evol.16:246–252. pathogen coevolution. Proc. Natl. Acad. Sci. USA97:5322–5327. Schierup, M. H., andJ. Hein, 2000a Consequences of recombina-Burke, D. S., 1997 Recombination in HIV: an important viral evolu- tion on traditional phylogenetic analysis. Genetics156:879–891. tionary strategy. Emerg. Infect. Dis.3:253–259. Schierup, M. H., andJ. Hein, 2000b Recombination and the molec-Charlesworth, B., M. T. Morgan and D. Charlesworth, ular clock. Mol. Biol. Evol.17:1578–1579.
1993 The effect of deleterious mutations on neutral molecular Slade, P. F., 2000 Simulation of selected genealogies. Theor. Popul. Biol.57:35–49.
variation. Genetics134:1289–1303.
Suzuki, Y., andT. Gojobori, 1999 A method for detecting positive Charlesworth, D., B. CharlesworthandM. T. Morgan, 1995
selection at single amino acid sites. Mol. Biol. Evol.16:1315–1328. The pattern of neutral molecular variation under the background
Swanson, W. J., Z. Yang, M. F. WolfnerandC. F. Aquadro, 2001 selection model. Genetics141:1619–1632.
Positive Darwinian selection drives the evolution of several female Fares, M. A., A. Moya, C. Escarmis, E. Baranowski, E. Domingo
reproductive proteins in mammals. Proc. Natl. Acad. Sci. USA et al., 2001 Evidence for positive selection in the capsid
protein-98:2509–2514. coding region of the foot-and-mouth disease virus (FMDV)
sub-Swofford, D. L., 2000 PAUP*: Phylogenetic Analysis Using Parsi-jected to experimental passage regimens. Mol. Biol. Evol. 18:
mony (*and Other Methods), Version 4.0b10. Sinauer Associates, 10–21.
Sunderland, MA. Fearnhead, P., andP. Donnelly, 2001 Estimating recombination
Wall, J. D., 2000 A comparison of estimators of the population rates from population genetic data. Genetics159:1299–1318.
recombination rate. Mol. Biol. Evol.17:156–163.
Fitch, W. M., R. M. Bush, C. A. BenderandN. J. Cox, 1997 Long Williamson, S., andM. E. Orive, 2002 The genealogy of a sequence term trends in the evolution of H(3) HA1 human influenza type
subject to purifying selection at multiple sites. Mol. Biol. Evol.
A. Proc. Natl. Acad. Sci. USA94:7712–7718. 19:1376–1384.
Ford, M. J., 2001 Molecular evolution of transferrin: evidence for Worobey, M., 2001 A novel approach to detecting and measuring positive selection in salmonids. Mol. Biol. Evol.18:639–647. recombination: new insights into evolution in viruses, bacteria, Golding, G. B., 1997 The effect of purifying selection on genealo- and mitochondria. Mol. Biol. Evol.18:1425–1434.
gies, pp. 271–285 inProgress in Population Genetics and Human Wu, J. C., T. Y. Chiang, W. K. Shiue, S. Y. Wang, I. J. Sheenet al., Evolution, edited by P.Donnellyand S.Tavare. Springer-Verlag, 1999 Recombination of hepatitis D virus RNA sequences and
New York. its implications. Mol. Biol. Evol.16:1622–1632.
Goldman, N., andZ. Yang, 1994 A codon-based model of nucleotide Yamaguchi-Kabata, Y., and T. Gojobori, 2000 Reevaluation of substitution for protein-coding DNA sequences. Mol. Biol. Evol. amino acid variability of the human immunodeficiency virus type
11:725–736. 1 gp120 envelope glycoprotein and prediction of new
discontinu-ous epitopes. J. Virol.74:4335–4350. Griffiths, R. C., andP. Marjoram, 1996 Ancestral inference from
Yang, Z., 2000 Phylogenetic analysis by maximum likelihood samples of DNA sequences with recombination. J. Comput. Biol.
(PAML), Version 3.0. University College, London.
3:479–502.
Yang, Z., 2001 Maximum likelihood analysis of adaptive evolution Haydon, D. T., A. D. Bastos, N. J. KnowlesandA. R. Samuel, 2001
in HIV-1 gp120 env gene. Pac. Symp. Biocomput., 226–237. Evidence for positive selection in foot-and-mouth disease virus
Yang, Z., andJ. P. Bielawski, 2000 Statistical methods for detecting capsid genes from field isolates. Genetics157:7–15.
molecular adaptation. Trends Ecol. Evol.15:496–503. Hey, J., andJ. Wakeley, 1997 A coalescent estimator of the
popula-Yang, Z., andW. J. Swanson, 2002 Codon-substitution models to tion recombination rate. Genetics145:833–846.
detect adaptive evolution that account for heterogeneous selec-Holmes, E. C., C. H. Woelk, R. KassisandH. Bourhy, 2002 Genetic
tive pressures among site classes. Mol. Biol. Evol.19:49–57. constraints and the adaptive evolution of rabies virus in nature.
Yang, Z., R. Nielsen, N. GoldmanandA. M. Pedersen, 2000a Co-Virology292:247–257.
don-substitution models for heterogeneous selection pressure at Hudson, R. R., 1983 Properties of a neutral allele model with
intra-amino acid sites. Genetics155:431–449.
genic recombination. Theor. Popul. Biol.23:183–201. Yang, Z., W. J. SwansonandV. D. Vacquier, 2000b Maximum-Hudson, R. R., 2001 Two-locus sampling distributions and their likelihood analysis of molecular adaptation in abalone sperm application. Genetics159:1805–1817. lysin reveals variable selective pressures among lineages and sites. Hudson, R. R., andN. L. Kaplan, 1994 Gene trees with background Mol. Biol. Evol.17:1446–1455.
selection, pp. 140–153 inNon-Neutral Evolution: Theories and