Article
1
Expression Profile of Cell Cycle-related Genes in
2
Human Fibroblasts Exposed Simultaneously to
3
Radiation and Simulated Microgravity
4
Hiroko Ikeda1, †, Masafumi Muratani2, Jun Hidema3, Megumi Hada4, Keigi Fujiwara5, Hikaru
5
Souda1, §, Yukari Yoshida1, and Akihisa Takahashi1, *
6
1 Gunma University Heavy Ion Medical Center, Maebashi, Gunma 371-8511, Japan; [email protected]
7
2 Department of Genome Biology, Faculty of Medicine, University of Tsukuba, Tsukuba, Ibaraki 305-8577,
8
Japan; [email protected]
9
3 Graduate School of Life Sciences, Tohoku University, Sendai, Miyagi 980-8577, Japan;
10
11
4 Radiation Institute for Science & Engineering, Prairie View A&M University, Prairie View, TX 77446, USA;
12
13
5 Department of Cadiology, University of Texas MD Anderson Cancer Center, Houston, TX 77030, USA;
14
15
† Current affiliation: Gunma University Initiative for Advanced Research, Maebashi, Gunma 371-8511, Japan;
16
17
§ Current affiliation: Department of Heavy Particle Medical Science, Graduate School of Medical Science,
18
Yamagata University, Yamagata, Yamagata, 990-9585, Japan; [email protected]
19
* Correspondence: [email protected]; Tel.: +81-27-220-7917
20
Received: date; Accepted: date; Published: date
21
Abstract:
Multiple unique environmental factors such as space radiation and microgravity (µ G)22
pose a serious threat to human gene stability during space travel. Recently, we reported that
23
simultaneous exposure of human fibroblasts to simulated µ G and radiation results in more
24
chromosomal aberrations than in cells exposed to radiation alone. However, the mechanisms behind
25
this remain unknown. The purpose of this study was thus to obtain comprehensive data on gene
26
expression using a 3D clinostat synchronized to a carbon (C)-ion or X-ray irradiation system.
27
Human fibroblasts (1BR-hTERT) were maintained under standing or rotating conditions for 3 or 24
28
h after synchronized C-ion or X-ray irradiation at 1 Gy as part of a total culture time of 2 days.
29
Among 57,773 genes analyzed with RNA sequencing, we focused particularly on the expression of
30
82 cell cycle-related genes after exposure to the radiation and simulated µ G. The expression of cell
31
cycle-suppressing genes (ABL1 and CDKN1A) decreased and that of cell cycle-promoting genes
32
(MKI67, KPNA2, CCNB1, STMN1, and MCM4) increased after C-ion irradiation under µ G. The cell
33
cycle may pass through the G1/S and G2 checkpoints with DNA damage due to the combined effects
34
of C-ions and µ G, suggesting that increased genomic instability might occur in space.
35
Keywords: simulated microgravity; radiation; combined effects; gene expression; cell cycle
36
37
1. Introduction
38
Many manned space missions are scheduled in the near future. During such missions,
39
astronauts are continuously exposed to space radiation, which differs from that on Earth. For space
40
missions in low Earth orbit (LEO), such as at the International Space Station (ISS), the major source
41
of radiation exposure is solar storms. For exploratory missions beyond LEO, such as explorations of
42
the Moon and Mars, the effects of exposure to galactic cosmic radiation, including heavy ions, are
43
the most significant health concern. During solar storms, high-dose exposure can have acute effects,
44
including fatigue, nausea, and vomiting [1]. In contrast, during long-duration and exploratory
45
spaceflights, chronic exposure increases the risk of cancer [2,3] and can cause tissue degeneration,
46
development of cataracts [4,5], and potentially affect the central nervous system [6] and immune
47
function [7]. It has also been reported that the risk of cardiovascular disease may be increased by
48
traveling into deep space [8]. However, in another study, this conclusion was questioned because the
49
small number of samples used did not enable a statistically robust analysis [9]. Several factors are
50
leading to large uncertainties in the projection of these risks and impeding evaluation of the
51
effectiveness of possible countermeasures; these factors include the type of radiation and the
52
presence of microgravity (µ G) [10]. For the assessment and management of human health risks in
53
space, it is necessary to obtain more basic data on the combined effects of radiation under µ G.
54
In previous space experiment, there was no appreciable difference in results between space and
55
ground samples because the time spent in space was short and samples were thus exposed to space
56
radiation at a low dose [11]. In other studies, various organisms have been irradiated before space
57
flight to test the effect of µ G on the repair of radiation-induced DNA damage, but again there was no
58
appreciable difference in results [12-15]. Meanwhile, it has been reported that the presence of µ G
59
enhances the effects of space radiation [16-18], while another study reports improved recovery from
60
radiation damage under µ G [19]. Control experiments performed in space under conditions
61
equivalent to Earth’s gravity (1G) are limited. The combined effects of µ G and radiation thus remain
62
unclear [20-22], although it is thought that µ G influences the effects of radiation on living organisms.
63
In previous ground studies on the combined effects of radiation and µ G, a 3D clinostat [23] or a
64
rotating wall vessel [24] was used to simulate µ G, and in order to irradiate samples on these µ G
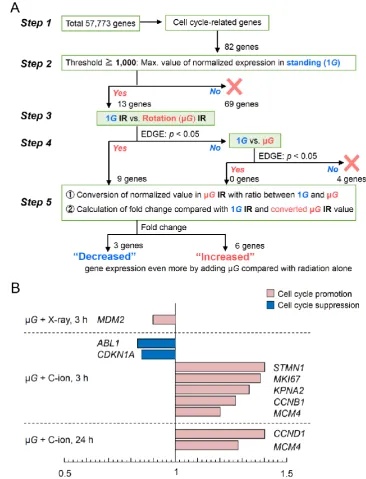
65
simulators, it was necessary to stop rotation during irradiation. As another system to simulate space
66
conditions on the ground, chronic irradiation of samples on the 3D clinostat with neutrons of
67
several MeV from the radioisotope 252Cf was reported [25,26], but the effects of radiation were not
68
compared with the status of 1G standing samples.
69
Recently, we overcame these previous problems (i.e. discontinuous µ G conditions, lack of a 1G
70
control experiment) [27-29] and carried out irradiation experiments under chronic µ G conditions. In
71
addition, in parallel with this experimental condition, we performed the same irradiation under 1G
72
standing conditions. Using our newly developed μG/irradiation system, we have reported that
73
simultaneous exposure of human fibroblasts to simulated µ G and radiation results in more
74
chromosome aberrations than in cells exposed to radiation alone [30]. We know that defects in a cell
75
cycle checkpoint may be responsible for genomic instability [31]. Genes specifically involved in the
76
cell cycle are regulated transcriptionally [32] and are expressed just before they are needed [33].
77
Therefore, we focused here on the expression of cell cycle-related genes. To address the cause of the
78
combined effects of radiation and simulated µ G on genomic instability, we obtained transcriptomic
79
data by RNA sequencing (RNA-seq) in human fibroblasts exposed simultaneously to X-rays or
80
carbon (C)-ions under simulated µ G.
81
2. Results
82
2.1. Gene Expression Profile Changes after Radiation and/or Simulated µG Treatment
83
To investigate the profile of genes whose expression changes significantly with µ G or radiation
84
treatment alone, screening of genes was carried out using Empirical Analysis of DGE [EDGE, CLC
85
Main Workbench (Qiagen Bioinformatics, Aarhus, Denmark), p-value < 0.05, fold change absolute
86
value > 2.0] for each combination of a total of 57,773 genes from RNA-seq analysis in 1BR-hTERT
87
human fibroblasts. First, to identify genes whose expression levels are altered by simulated µ G
88
alone, we compared the expression profile of cells cultured at 1G with that of cells exposed to µ G
89
for 48 h and found that 140 genes were up-regulated. In the pathway analysis using the DAVID
90
Bioinformatics Resources 6.8 (NIAID/NIH, Bethesda, MD, USA) [34] and KEGG (Kanehisa
91
laboratories of Kyoto University, Uji, Kyoto, Japan) databases [35], we found that µ G up-regulated a
92
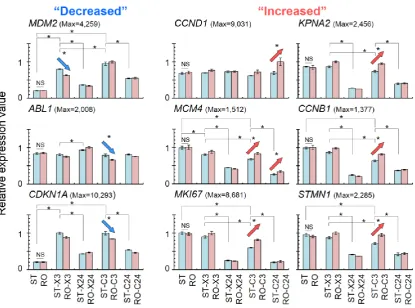
set of genes related to morphine addiction was significantly associated with the gene group for
93
which significant expression changes were observed (Table 1a).
Table 1. Numbers of up- and down-regulated gene sets and the top three of related cellular pathways
95
after µ G or radiation treatment in human fibroblasts.
96
(a) Genes up-regulated by radiation and/or simulated µ G
97
vs. ST Total genes Cellular pathways (number of genes)
ST-X3 315 p53 signaling (7), FoxO signaling (5), Adrenergic signaling in cardiomyocytes (5)
ST-X24 523 Neuroactive ligand–receptor interaction (13), Calcium signaling (11), cAMP signaling (11)
ST-C3 253 Cytokine–cytokine receptor interaction (7), p53 signaling (6), Measles (5)
ST-C24 350 p53 signaling (6), FoxO signaling (5)
RO-X3 204 p53 signaling (4)
RO-X24 674 Neuroactive ligand–receptor interaction (17), Calcium signaling (11), cAMP signaling (11)
RO-C3 211 p53 signaling (7),
Cytokine–cytokine receptor interaction (6)
RO-C24 339 PI3K–Akt signaling (10), p53 signaling (6), ABC transporters (5)
RO 140 Morphine addiction (3)
(b) Genes down-regulated by radiation and/or simulated µ G
98
vs. ST Total genes Cellular pathways (number of genes)
ST-X3 79 Cell cycle (5), MicroRNAs in cancer (4), p53 signaling (3)
ST-X24 439 Systemic lupus erythematosus (46), Alcoholism (46), Cell cycle (32)
ST-C3 198 Cell cycle (5), Systemic lupus erythematosus (4)
ST-C24 663 Systemic lupus erythematosus (55), Alcoholism (55), Cell cycle (36)
RO-X3 86 Pathways in cancer (5)
RO-X24 507 Alcoholism (46), Systemic lupus erythematosus (45), Cell cycle (33)
RO-C3 210 Pathways in cancer (7)
RO-C24 702 Systemic lupus erythematosus (55), Alcoholism (55), Cell cycle (35)
RO 103
*Calcium ion binding (6),
*G-protein purinergic nucleotide receptor activity (2),
*Myosin binding (2)
ST, standing 1G; RO, rotation for simulated µ G; X, X-ray irradiation; C, carbon-ion irradiation; 3, 3 h
99
after irradiation; 24, 24 h after irradiation. * The list by Gene Ontology-Biological Process-direct with
100
DAVID (p < 0.05, top 3 show a higher percentage in narrowing as biological process).
101
In contrast, for the group of genes that were down-regulated after µ G treatment alone, no
102
specific associated pathways were identified. By focusing on the Biological Process-Direct of Gene
103
Ontology in DAVID [34], we have found that the gene groups showed a tendency for decreased
expression were related to calcium ion binding, G-protein purinergic nucleotide receptor activity,
105
and myosin binding (Table 1b). In X-ray or C-ion treatment alone, the major pathways of
106
up-regulated genes (p53 signaling pathway) and down-regulated genes (cell cycle pathway) tended
107
to be similar. We focused on cell cycle-related genes for further data analysis because the p53
108
signaling pathway is also related to the cell cycle.
109
2.2. Radiation Exposure Led to a Marked Change in the Cell Cycle-related Gene Expression Profile
110
On the basis of our RNA-seq results from cells exposed to radiation alone (Table 1), we
111
performed further investigation to identify significant genes related to the cell cycle. Specifically, 84
112
genes encoding key molecules involved in the cell cycle were selected with information of human
113
cell cycle RT² Profiler PCR Array (Qiagen, Hilden, Germany) [36]. Of those genes, 82 were selected
114
in our sample after RNA-seq. Gene expression profile changes under each condition compared with
115
that in the non-irradiated 1G sample are shown as a heatmap in Figure 1.
116
Figure 1. Heatmap of 82 cell cycle-related genes under various conditions. ST, standing 1G; RO,
117
rotation for simulated µ G; X, X-ray irradiation; C, carbon-ion irradiation; 3, 3 h after irradiation; 24,
118
24 h after irradiation. After treatment, a total of 36 samples was analyzed for each condition (ST or
119
RO alone, N = 6; the other 8 conditions, N = 3). The range of expression levels was from −7.00
120
(yellow-green, down-regulation) to 13.00 (red, up-regulation); black being 0.00. When the difference
121
between the transformed expression value of a gene under each condition and that of ST was
122
smaller than 1.0, the gene was allocated to the no change group (a). If the difference was larger than
123
1.0, it was put into either the down-regulated (b) or up-regulated group (c).
Figure 2. (A) Criteria for identifying genes whose expression levels are different in 1BR-hTERT
125
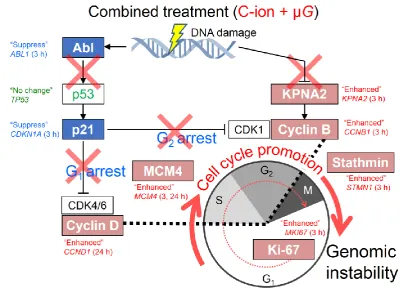
human fibroblasts when they are exposed simultaneously to radiation and µ G vs. when exposed to
126
radiation alone. To narrow down the number of target genes from the total of 57,773 genes
127
activated by radiation exposure alone, cell cycle-related genes were selected in Step 1. In Step 2, the
128
threshold was set as when the maximum normalized expression value of standing (1G) condition
129
was 1,000 or more. If this threshold was exceeded, Step 3 involved comparing the µ G effect between
130
irradiated samples: normalized expression value of irradiated standing 1G samples vs. µ G
131
irradiated samples. If Step 3 showed a significant difference (EDGE; p < 0.05) between without and
132
with µ G, the analysis proceeded to Step 5. If no difference was noted in Step 3, these genes
133
proceeded to Step 4 for judging the µ G effect alone: comparison of expression values of 1G
134
non-irradiated samples vs. rotation µ G condition non-irradiated samples. When genes passed this
135
step (EDGE; p < 0.05), they were sent to Step 5 for the calculation of fold change while considering
136
the µ G effect alone. (B) Relative fold change of nine up- or down-regulated cell cycle-related genes
137
based on calculations in Step 5. The pink bar shows the cell cycle-promoting genes and the blue bar
138
indicates the cell cycle-suppressing genes.
The heatmap represents the extent of gene expression in cells harvested 3 and 24 h after C-ion
140
or X-ray irradiation under simulated µ G compared with the expression level of the same gene in
141
non-irradiated samples under 1G. The expression levels of up-regulated genes are shown in red and
142
those of down-regulated genes are in green. The up- or down-regulation of gene expression caused
143
by X-ray or C-ion irradiation was more remarkable than the influence of simulated µ G (Figure 1b, c)
144
because the pattern did not change markedly between the 1G and µ G conditions. Upon comparison
145
to the non-irradiated 1G sample, the group of genes down-regulated upon radiation exposure alone
146
was related to several key functions for promoting the cell cycle (Figure 1b). In contrast, those
147
up-regulated genes were related to p53 signaling, such as CDKN1A (Figure 1c).
148
2.3. Changes in Cell Cycle-related Genes Expression Profile in Cells under µG and Radiation
149
To determine whether the radiation response was enhanced or suppressed by the combination
150
with µ G, we focused on genes whose expression specifically changed under the combined
151
conditions. Figure 2A shows the judgement criteria for assessing gene expression profile changes.
152
Of the 57,773 genes targeted for RNAseq analysis, 82 cell cycle-related genes were narrowed down
153
in Step 1. As Step 2, the threshold value was set with the maximum value (> 1,000) of the
154
normalized expression in 1G sample. Thirteen genes met this criterion in Step 2. Next, the genes
155
that showed significant differences under the influence of radiation were further selected based on
156
the difference in their expression under 1G vs. those in µ G environment (EDGE; p < 0.05) as Step 3.
157
Here, 9 out of 13 genes showed significant differences. On the four genes (ATM, CDC20, CDK6, and
158
TFDP1) that did not show significant differences, we performed comparative studies between
159
non-irradiated 1G cells and non-irradiated µ G cells, and examined whether µ G by itself had a
160
significant effect. We found that these 4 genes were not affected by changes in gravitational force
161
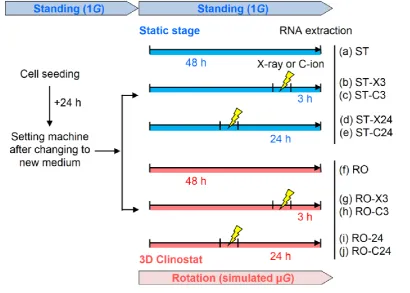
(Step 4). In Step 5, the expression value in the µ G irradiated sample was first converted using the
162
ratio of 1G non-irradiated samples vs. µ G non-irradiated samples. Next, we calculated the fold
163
change compared with the expression value of 1G irradiated samples and the converted expression
164
value of µ G-irradiated samples. If the fold change showed a decrease or increase, this means gene
165
expression even more by adding to simulated µ G compared with radiation alone.
166
Nine genes (ABL1 [37], CCNB1 [38], CCND1 [39], CDKN1A [38,39], KPNA2 [40], MCM4 [41],
167
MDM2 [42], MKI67 [43], and STMN1 [44]) were calculated by considering the effect of µ G alone
168
with several processes of Step 5 in judgement criteria (Figure 2A); relative fold changes by
169
combined treatment are shown in Figure 2B. MDM2 showed a decrease in relative expression
170
value at 3 h after X-ray irradiation under µ G. In C-ion irradiation and µ G treatment samples,
171
decreases were observed in the expression of ABL1 and CDKN1A, which are cell cycle-suppressing
172
genes, at 3 h after irradiation. In contrast, MKI67, KPNA2, CCNB1, and STMN were found to have
173
increased expression at 3 h after irradiation; meanwhile, the expression of CCND1 was increased at
174
24 h after irradiation under the µ G condition. MCM4 also showed an increase in the relative
175
expression value at both 3 and 24 h after irradiation (Figures 2B, 3). Table 2 is the summary of
176
results on these nine genes. The six up-regulated genes play roles in cell cycle promotion (Figure
177
2B). We could obtain the profile of genes with a statistically significant change in expression upon
178
adding µ G and comparing the results with those obtained with radiation alone.
179
The relative expression values of nine cell cycle-related genes were compared among different
180
conditions (µ G alone, radiation alone, or combined treatment), as shown in Figure 3. µ G alone did
181
not have a significant effect on the expression of all nine genes. As a result of X-ray or C-ion
182
exposure alone regardless of the timing of this irradiation, an increased relative expression value
183
was observed for MDM2. In addition, X-ray and C-ion irradiation showed no change in Abl1 but a
184
significant increase in CDKN1A, and CCND1 working downstream of these kinase showed no
185
change in relative gene expression. Moreover, CCNB1 showed a tendency for a decrease in its
186
relative expression value. There was also a tendency for decreases in the relative expression values
187
of cell cycle-promoting genes such as KPNA2, MCM4, MK167, and STMN1. When the same
188
physical dose of 1 Gy of X-rays or C-ions was used in this study, we found that the changes in
189
relative expression value were significantly larger for the C-ion-irradiated samples than for the
X-ray-irradiated ones (Figure 3; ST-X3 vs. ST-C3 in MDM2, KPNA2, MCM4, CCNB1, MKI67, and
191
STMN1).
192
The blue and red arrows in Figure 3 indicate a decrease and increase, respectively, in terms of
193
the relative fold change by the combined effect of radiation and simulated µ G as shown in Figure
194
2B. The combined treatment gave significantly different results compared with radiation treatment
195
alone in the gene expression of cell cycle checkpoints and promoting proteins.
196
Figure 3. Comparison of relative expression value changes of nine cell cycle-related genes screened
197
via Step 3 and Step 4 in Figure 2A; maximum values of each gene are shown here. ST, standing 1G;
198
RO, rotation for simulated µ G; X, X-ray irradiation; C, carbon-ion irradiation; 3, 3 h after
199
irradiation; 24, 24 h after irradiation. Significantly decreased relative expression values as revealed
200
by statistical analysis with EDGE (*p < 0.05, NS = not significant) are shown with blue arrows and
201
increased ones with red arrows. Bar graphs indicate relative expression value ± standard error
202
under each condition (ST or RO alone, N = 6; the other 8 conditions, N = 3).
203
3. Discussion
204
3.1. Gene Expression Profile Changes with Simulated µG
205
In this study, we found that a total of 140 genes were upregulated and 103 genes were
206
downregulated by simulated μG treatment alone. A small group of up-regulated genes was
207
associated with morphine addiction-related pathways,but no major pathways were identified for
208
the down-regulated genes. The use of Biological Process-Direct by Gene Ontology with DAVID also
209
revealed that the up-regulated genes were associated with the process involved in the regulation of
210
striated muscle contraction including MYBPH. In addition, some down-regulated genes were
211
associated with processes related to the extracellular matrix biology and muscle contraction such as
212
ACTA1 [25]. Similar results have previously been reported, thus our findings confirmed that our
213
simulated µ G system functions appropriately and that it is an effective tool for further investigation
214
of the combined effect of radiation and simulated µ G.
Table 2. Nine cell cycle-related genes affected by combined treatment with radiation and µ G identified by the
216
screening criteria shown in Figure 2A.
217
Cell
cycle
Gene ID
(protein) Ensembl Function Ref.
S
up
pr
es
sio
n
ABL1 (c-Abl)
ENSG00000 097007
This gene encodes a protein tyrosine kinase. C-Abl protects p53 by antagonizing the inhibitory effect of Mdm2, an action that requires direct interplay between c-Abl and Mdm2.
37
CDKN1A (p21)
ENSG00000 124762
The encoded protein binds to and inhibits the activity of cyclin D1–CDK4/6 or cyclin B1–CDK1 complexes, and thus functions as a regulator of cell cycle progression at G1 and G2.
38, 39
P
ro
m
o
tio
n
CCNB1 (Cyclin B1)
ENSG00000 134057
Activated cyclin B1 with CDK1 promotes several of the events of early mitosis. DNA damage leads to nuclear accumulation of inactive cyclin B1–CDK1 complexes by p21, and contributes to the establishment of permanent G2 arrest.
38
CCND1 (Cyclin D1)
ENSG00000 110092
This cyclin forms a complex with and functions as a regulatory subunit of CDK4/6, whose activity is required for cell cycle G1/S transition. DNA damage leads to nuclear accumulation of inactive cyclin D1
–
CDK4/6 complexes by p21, and contributes to the establishment of G1 arrest.39
KPNA2 (KPNA2)
ENSG00000 182481
KPNA2 expression accelerates cell cycle progression by up-regulating cyclin B and CDK1. 40
MCM4 (MCM4)
ENSG00000 104738
MCM4, a subunit of a putative replicative helicase, is essential for the initiation of eukaryotic genome replication. MCM4 is one of the crucial targets of the DNA replication checkpoint system.
41
MDM2 (MDM2)
ENSG00000 135679
MDM2 can promote tumor formation by targeting tumor suppressor p53 proteins for proteasomal degradation. Mdm2 promotes Cdc25C protein degradation and delays cell cycle progression through the G2/M phase.
42
MKI67 (Ki-67)
ENSG00000 148773
Ki-67 is associated with and may be necessary for cellular proliferation. Ki-67 contributes to normal cell cycle progression.
43
STMN1 (Stathmin 1)
ENSG00000 117632
Stathmin 1 is a ubiquitous cytosolic phosphor- protein. Stathmin is critically important not only for the formation of a normal mitotic spindle upon entry into mitosis but also for regulation of the function of the mitotic spindle in the later stages of mitosis and for the timely exit from mitosis.
44
3.2. X-ray and C-ion Irradiation Induced Changes in Gene Expression
219
From the results in Table 1, major cellular pathways targeted by X-ray and C-ion irradiation
220
were up-regulated p53 signaling and down-regulated cell cycle which work downstream the p53
221
signaling pathway. The heatmap focused on genes involved in the cell cycle not only revealed
222
similar results to those shown in Table 1, but also confirmed that the effect of radiation alone was
223
greater than that of µ G treatment alone (Figure 1).
224
These results were suggested to be consistent with the typical radiation-induced cell cycle
225
checkpoints and subsequent repair responses reported so far [45,46]. The relative expression value
226
change due to radiation alone of the cell cycle-related genes selected according to the judging
227
criteria is shown in Figure 3. The expression of ABL1 did not change, while CDKN1A also known as
228
p21 was up-regulated. CCND1 related to Cyclin D did not show a change of expression downstream
229
of ABL1 and CDKN1A at both 3 and 24 h after irradiation. p21 expression increased upon C-ion
230
irradiation, which matches the finding in a previous report [47]. Moreover, the expression level of
231
KPNA2 was decreased and that of CDKN1A was increased, while the level of CCNB1 located
232
downstream of them was decreased. MCM4, MKI67, and STMN1, which promote the cell cycle,
233
showed a tendency to be downregulated (Table 2). These results suggest that 1BR-hTERT has
234
normal cell cycle checkpoints, including not only G1 arrest but also G2 arrest, with cell cycle delay
235
through the G2/M phase by the up-regulation of MDM2 by C-ion or X-ray exposure alone.
236
3.3. Synergistic Effect of Radiation and Simulated µG on Changes in Expression Profile of Cell Cycle-related
237
Genes
238
The results of several experiments focused on the cell cycle under simulated µ G have been
239
reported using various cell lines. For example, µ G induced partial G1 phase arrest in rat
240
pheochromocytoma PC12 cells [48]. In addition, both normal murine vascular smooth muscle cells
241
and neoplastic human breast cancer cells were induced to undergo partial arrest at G2/M and
242
showed increased expression of CDKN1A upon simulated µ G [49]. Moreover, in murine
243
microvascular endothelial 1G11 cells, cell growth was inhibited and p21 was induced by simulated
244
µ G [50]. In contrast, Arase et al. reported that simulated μG reduced the expression of p21 in human
245
fibroblasts [51]. Although the adaptation and responses to µ G may differ depending on the cell type,
246
target factors, and the treatment time [49], these previous reports suggest that µ G is an important
247
factor regulating the cell cycle through the p53 signaling pathway.
248
Our results after combined treatment with C-ion irradiation and simulated µ G revealed
249
synergistic changes in the expression of genes (Figures 2B, 3). The expression of CDKN1A also
250
known as p21 was decreased at 3 h and that of CCND1 was increased at 24 h after the treatment
251
through down-regulating ABL1 (3 h) and leaving TP53 unchanged. Therefore, the results suggest
252
that G1 arrest does not occur under combined conditions of C-ion irradiation and simulated µ G.
253
Moreover, KPNA2 and CCNB1 were up-regulated with a decrease of CDKN1A at 3 h after the
254
treatment, and then G2 arrest may not occur. Based on previous reports, our results suggest that
255
C-ion irradiation alone may induce cell cycle checkpoints normally, but the checkpoints are
256
released by adding µ G treatment.
257
After combined treatment in this study, increases in expression were observed in MKI67 (all
258
phases; especially S phase), MCM4 (S phase), and STMN1 (M phase), which promote the cell cycle
259
progression (Figure 2B). While radiation treatment alone tended to suppress the cell cycle (Figure
260
3), the combined effect of C-ion irradiation and simulated µ G may promote cell proliferation.
261
Indeed, previous reports show that simulated μG promotes the proliferation and differentiation of
262
human mesenchymal stem cells [52]. Similar findings were also made in experiments using human
263
dental pulp stem cells [53] and human epidermal stem cells [54], including the result of an
264
increased percentage of Ki67-positive cells. These reports support our finding that C-ion irradiation
265
and simulated µ G together promote cell cycle progression.
On the basis of our results (Figures 2B, 3), we propose a model by which the cell cycle-related
267
pathway is modified by the combined effect of C-ion exposure and simulated µ G in 1BR-hTERT
268
human fibroblasts (Figure 4). Cells may pass through each cell cycle checkpoint with DNA damage
269
after combined treatment with C-ion irradiation and simulated µ G. We reported that combined
270
treatment of cells with simulated µ G and radiation induced a higher frequency of both simple and
271
complex types of chromosome aberrations compared with the level in cells irradiated with X-rays
272
or C-ions alone under the 1G standing condition [30]. This proposed model for the modified cell
273
cycle pathway may provide some insights into the mechanism for increased chromosome
274
aberration due to the combined effect of C-ion and simulated µ G.
275
Figure 4. Schematic representation of the proposed model of cell cycle-related pathway modified
276
by combined effect of C-ion exposure with simulated µ G in 1BR-hTERT human fibroblasts. The
277
pink column shows cell cycle-promoting genes and blue column indicates cell cycle-suppressing
278
ones.
279
In terms of the effect on 1BR-hTERT fibroblasts of X-ray irradiation in combination with
280
simulated µ G, only one gene, MDM2, showed a significant decrease in its expression. Although
281
MDM2 is known as one of the components that negatively feeds back to p53 signaling, its
282
expression was synergistically decreased by the combined effect relative to the effect of X-ray
283
irradiation alone; thus, there is a possibility that accumulation of p53 protein may occur and that
284
the cell cycle checkpoint works downstream of p53. Therefore, it is possible that there is no
285
significant difference after combined treatment with X-ray irradiation, although a similar tendency
286
was seen as a reaction to induce genome instability finally between X-ray and C-ion treatment
287
under simulated µ G in this study. Another potential reason for this result is the radiation dose used
288
in this experiment. We used 1 Gy for both C-ions and X-rays. From the cell survival curve [30], a
289
dose equivalent to 1 Gy C-ions would be 2 Gy by X-rays, and therefore a significant difference in
290
the expression of some of the genes may not have been seen in this study with X-rays. However, the
291
changes in gene expression profile due to the combined effect in genes involved in the cell cycle
292
regulation showed a similar tendency between X-ray and C-ion treatments.
In regard to previous studies on simulated µ G experiments with radiation at the ground level
294
that support our model, combined effects of these factors caused increases in double-strand breaks
295
[55] and genomic instability such as the formation of micronuclei [56], a decrease in cell cycle
296
checkpoints, and enhancements of DNA damage response (by γ-rays) [57] and chromosome
297
aberrations (by X-rays) [58]. In space experiments involving simultaneous exposure to space
298
radiation and µ G, several different sets of results have been reported, with suppression of the cell
299
cycle through activated p21 [59] and cell proliferation [60], but also no change in the amount of p21
300
protein [61,62]. The reason for this difference may be the short stay in space and the lack of a
301
sufficient dose to induce radiation effects. However, DNA damage has been detected [63-65] after
302
time spent in space, and increases in genomic instability have also been shown in the NASA Twins
303
Study [66]. Our results, which may indicate the release of checkpoints and promotion of the cell
304
cycle by combined effects of C-ion irradiation and simulated µ G, help to shed light on the
305
mechanism behind the findings in these previous reports. The results also show the need to
306
consider combined effects of simultaneously radiation and µ G exposure on the risk assessment
307
based on previous dose-response data obtained from irradiated cells under 1G conditions.
308
4. Materials and Methods
309
4.1. Cell Culture
310
Human fibroblasts (1BR-hTERT cells) were kindly provided by Dr. P.A. Jeggo (University of
311
Sussex, Brighton, UK) and Dr. A. Shibata (Gunma University Initiative for Advanced Research
312
(GIAR), Maebashi, Gunma, Japan). Cells were cultured in CO2-independent medium (COI) (Thermo
313
Fischer Scientific, Waltham, MA, USA) supplemented with 10% (v/v) fetal bovine serum (MP
314
Biomedicals, Santa Ana, CA, USA), 200 mM L-glutamine (Thermo Fischer Scientific), and
315
penicillin–streptomycin mixed solution (Nacalai Tesque, Kyoto, Kyoto, Japan) at 37°C.
316
Exponentially growing cells were cultured in disposable sealed irradiation cell culture chambers
317
(Chiyoda Co., Yokohama, Kanagawa, Japan) [67,68] before setting in the 3D clinostat [PMS-CST I;
318
Advanced Engineering Services Co. Ltd. (AES), Tsukuba, Ibaraki, Japan] for simulated μG or a static
319
stage (AES) as a 1G control, as previously reported [28].
320
4.2. Synchronized Irradiation Systems under Simulated μG or 1G
321
Irradiation of cells without stopping clinostat motion was achieved by 0.2 sec of pulse
322
irradiation when the cell growth surface of the chamber on the clinostat became perpendicular to the
323
beam of irradiation. The controller of the 3D clinostat was also connected to the high-speed shutter
324
system for X-ray irradiation or the respiratory gating system for C-ion irradiation to achieve this
325
specific positioning (i.e., synchronization) of the chamber orientation and the timing of the pulse
326
irradiation, which occurred every 60 sec. Synchronized X-ray irradiation was performed using an
327
X-ray generator [200 kV, 14.6 mA, aluminium filter (0.3 mm thick), MultiRad225; Faxitron Bioptics,
328
LLC, Tucson, AZ, USA] equipped with a high-speed shutter [Accelerator Engineering Co. (AEC),
329
Chiba, Chiba, Japan]. Synchronized C-ion irradiation was performed using a synchrotron (Gunma
330
University Heavy Ion Medical Center (GHMC), Maebashi, Gunma, Japan) and respiratory gating
331
signals with a dose-averaged linear energy transfer of 50 keV/μm at the center of the 6-cm
332
spread-out Bragg peak (SOBP) of the beam with energy of 290 MeV/n [69]. As a control, cells in the
333
same chamber mounted on a stationary clinostat (1G) were pulse-irradiated for 0.2 sec every 60 sec
334
[27,28]. The dose used was 1 Gy of X-rays or C-ions, and the dose rate was approximately 0.03
335
Gy/min for both X-ray and C-ion irradiation under the simulated μG or 1G conditions.
336
4.3. Experimental Design
337
Comprehensive gene expression analysis of human fibroblasts was performed to determine the
338
combined effects of irradiation and simulated μG. 3D clinostat-synchronized X-ray or C-ion
339
irradiation at 1 Gy was performed without stopping rotation. Samples were set on the static stage for
standing (ST) 1G and the 3D clinostat for rotation (RO) simulated µ G after changing to new medium
341
at 24 h after the seeding of cells. The cells were maintained for 3 or 24 h after X-ray or C-ion
342
irradiation as part of total culture time of 2 days in standing or rotating conditions, and then total
343
RNA was isolated from the cells (Figure 5).
344
Figure 5. Experimental design from cell seeding to RNA extraction using human fibroblasts. ST
345
(a–e) and RO conditions (f–j). No irradiation (a, f), X-ray (b, d, g, i), or C-ion (c, e, h, j) irradiation.
346
4.4. RNA Extraction
347
The DCC samples were continuously cultured under standing or rotating conditions for 3 or 24
348
h after 1 Gy irradiation with X-rays or C-ions. Immediately after these treatments, adherent cells
349
were lysed in 1.6 ml of TRIzol® Reagent (Thermo Fischer Scientific) for homogenization and frozen
350
at −80°C. Gene expression was analyzed by Tsukuba i-Laboratory LLP (Tsukuba, Ibaraki, Japan).
351
4.5. RNA Sequencing
352
A total of 36 samples were analyzed (three samples for each condition) using RNA sequencing.
353
RNA sequence reads quantified 57,773 genes. After RNA sequencing, the profiles of genes with up-
354
or down-regulation of their expression were listed according to ratios of the RPKM (Reads Per
355
Kilobase of exon per Million mapped reads) value using EDGE (Empirical Analysis of Digital Gene
356
Expression) (p < 0.05, fold change with absolute value >2.0) with the CLC Main Workbench software.
357
4.6. Pathway Analysis
358
To identify cellular pathways within these lists after narrowing down the total of 57,773 genes
359
by statistical analysis using EDGE of the CLC Main Workbench, we used the Functional Annotation
360
Tool in DAVID Bioinformatics Resources 6.8 [34]. Using the KEGG pathway database, we selected
361
the top 3 pathways which show a higher percentage in narrowing down pathways (p < 0.05). If no
362
specific pathway was identified by KEGG tools, we selected the top 3 processes that show a higher
percentage in narrowing down biological process (p < 0.05) focusing on the Gene
364
Ontology-Biological Process in DAVID.
365
4.7. Heatmap Representation for Visualization of Changing Gene Expression Level
366
The expression values of each condition were normalized using CLC Main Workbench
367
software for the screened group of 82 cell cycle-related genes. After adding 0.01 to normalized
368
expression values, log 2 conversion was performed as transformed values. The gene expression
369
level changes were presented as a heatmap using the ransformed values calculated through these
370
multiple steps with CLC Main Workbench software. To create the heatmap, versatile matrix
371
visualization and the analytical software Morpheus (https://software.broadinstitute.org/morpheus)
372
were used. Using a standing 1G non-irradiated sample (ST), if the difference of the transformed
373
value of each condition vs. ST was smaller than 1.0, allocation to the no change group was
374
performed (a). However, if the difference was larger than 1.0, allocation to the Down-regulated (b)
375
or Up-regulated group (c) was performed.
376
4.8. Statistical Analysis
377
To observe the change in gene expression profile after exposure to the radiation and simulated
378
µ G, each sample was analyzed several times (total 36 samples; 1G or simulated µ G alone, N = 6; the
379
other 8 conditions, N = 3) at Tsukuba i-Laboratory LLP. The profiles of the up- or down-regulation
380
of gene expression were listed according to the ratios of the expression value using EDGE
381
(Empirical Analysis of Digital Gene Expression) with CLC Main Workbench software. In all
382
statistical analyses, differences were considered significant at P-values less than 0.05. For selecting
383
genes among the total of 57,773 genes, fold changes with an absolute value larger than 2.0 were
384
considered statistically significant with P-values of less than 0.05. The bar graph of Figure 3 shows
385
relative expression value ± standard error for each condition (ST or RO alone, N = 6; the other 8
386
conditions, N = 3).
387
5. Conclusions
388
In this study, we achieved to identify nine cell cycle-related genes that show synergistic
389
changes by combined effects with C-ion or X-ray irradiation under simulated µ G. Radiation
390
treatment alone with C-ions or X-rays increased the gene expression of CDKN1A (p21), while each
391
cell cycle checkpoint continued to work normally. However, the combined effects of C-ions and
392
simulated µ G decreased the expression of CDKN1A, which may have resulted in failure to achieve
393
arrest at checkpoints; this promoted the cell cycle without sufficiently undergoing steps of DNA
394
damage repair. Simulated µ G may be one of the key factors that synergistically change the effect of
395
radiation at ground level, and changes in the expression of cell cycle-related genes indicated the
396
possibility of genomic instability including chromosomal abnormalities. To assess the risk of
397
radiation in future long-term stays in space, further ground and space experiments need to be
398
conducted, taking into consideration the results obtained here.
399
Author Contributions: Conceptualization, A.T. and J.H.; methodology, H.I., M.M., H.S., Y.Y., and A.T.;
400
validation, H.I. and M.M.; writing — original draft preparation, H.I. and A.T.; writing — review & editing,
401
M.H., and Y.Y.; supervision, M.H., and K.F.; project administration, A.T.; funding acquisition, M.H., and A.T.
402
Funding: This work was supported by NASA Space Biology Program (80NSSC19K0133) (M.H.), a MEXT
403
Grant-in-Aid for Scientific Research on Innovative Areas, Japan (JP15H05945, JP15H05935, and JP15K21745)
404
(A.T.), "Living in Space," Research Projects with Heavy Ions at the Gunma University Heavy Ion Medical Center
405
(GHMC) (A.T.).
406
Acknowledgments: We thank Dr. Kathryn D. Held [Massachusetts General Hospital/Harvard Medical School
407
(Boston, MA, USA), GIAR], and Dr. Anggraeini Puspitasari (GIAR) for helpful discussions, Mr. Yosuke Kano
408
(AEC) and Ms. Aya Ishizaki (GHMC) for supporting our experiments, Dr. Penny A. Jeggo (University of
409
Sussex) and Dr. Atsushi Shibata (GIAR) for supplying 1BR-hTERT cells, and Edanz Group (www.
410
edanzediting.com/ac) for editing a draft of this manuscript.
Conflicts of Interest: The authors declare no conflicts of interest.
412
Abbreviations
413
3D Three-dimensional
ABL1 ABL proto-oncogene 1, non-receptor tyrosine kinase (c-Abl)
ACTA1 Actin alpha 1, skeletal muscle
AEC Accelerator Engineering Co.
AES Advanced Engineering Services Co. Ltd.
ATM ATM serine/threonine kinase
CCNB1 Cyclin B1
CCND1 Cyclin D1
CDC20 Cell division cycle 20
CDK1 Cyclin-dependent kinase 1 (= cell division cycle protein 2, cdc2) CDK4/6 Cyclin-dependent kinase 4/6
CDKN1A Cyclin-dependent kinase inhibitor 1A (p21)
C-ion Carbon ion
COI CO2-independent medium
DAVID Database for Annotation, Visualization, and Integrated Discovery GCR Galactic cosmic ray
GHMC Gunma University Heavy Ion Medical Center GIAR Gunma University Initiative for Advanced Research HZE High atomic number and energy
ISS International Space Station
KEGG Kyoto Encyclopedia of Genes and Genomes
KPNA2 Karyopherin subunit alpha 2
LEO Low Earth orbit LET Linear energy transfer
MCM4 Minichromosome maintenance complex component 4
MDM2 MDM2 proto-oncogene
MeV/n Megaelectronvolt per nucleon µ G Microgravity
MKI67 Marker of proliferation Ki-67
MYBPH Myosin binding protein H
NIAID National Institute of Allergy and Infectious Diseases NIH National Institutes of Health
p53 p53 tumor suppressor protein RO Rotation for simulated µ G SEP Solar energetic particle SPE Solar particle event SOBP Spread-out Bragg peak ST Standing 1G
STMN1 Stathmin 1
TFDP1 Transcription factor Dp-1
References
414
1. Committee on Ethics Principles and Guidelines for Health Standards for Long Duration and Exploration
415
Spaceflights; Kahn, J.; Liverman, C.T.; McCoy, M.A. Health Standards for Long Duration and Exploration
416
Spaceflight: Ethics Principles, Responsibilities, and Decision Framework. National Academies Press, Washington,
417
2014; ISBN 978-0-309-29657-1.
418
2. Cucinotta, F.A. A new approach to reduce uncertainties in space radiation cancer risk predictions. PLoS
419
ONE 2015, 10, e0120717. doi: 10.1371/journal.pone.0120717.
420
3. Cucinotta, F.A. Space radiation risks for astronauts on multiple International Space Station missions. PLoS
421
ONE 2014, 9, e96099. doi: 10.1371/journal.pone.0096099.
4. Cucinotta, F.A.; Manuel, F.K.; Jones, J.; Iszard, G.; Murrey, J.; Djojonegro, B.; Wear, M. Space radiation and
423
cataracts in astronauts. Radiat. Res. 2001, 156, 460–466.
424
5. Jones, J.A.; McCarten, M.; Manuel, K.; Djojonegoro, B.; Murray, J.; Feiversen, A.; Wear, M. Cataract
425
formation mechanisms and risk in aviation and space crews. Aviat. Space Environ. Med. 2007, 78, A56–A66.
426
6. Cucinotta, F.A.; Alp, M.; Sulzman, F.M.; Wang, M. Space radiation risks to the central nervous system. Life
427
Sci. Space Res. 2014, 2, 54–69. doi: org/10.1016/j.lssr.2014.06.003.
428
7. Fernandez-Gonzalo, R.; Baatout, S.; Moreels, M. Impact of particle irradiation on the immune system:
429
From the clinic to Mars. Front. Immunol. 2017, 8, 177.
430
8. Delp, M.D.; Charvat, J.M.; Limoli, C.L.; Globus, R.K.; Ghosh, P. Apollo lunar astronauts show higher
431
cardiovascular disease mortality: Possible deep space radiation effects on the vascular endothelium. Sci.
432
Rep. 2016, 6, 29901. doi: 10.1038/srep29901.
433
9. Cucinotta, F.A.; Hamada, N.; Little, M.P. No evidence for an increase in circulatory disease mortality in
434
astronauts following space radiation exposures. Life Sci. Space Res. 2016, 10, 53–56. doi:
435
10.1016/j.lssr.2016.08.002.
436
10. Durante, M.; Cucinotta, F.A. Heavy ion carcinogenesis and human space exploration. Nat. Rev. Cancer 2008,
437
8, 465–472. doi: 10.1038/nrc2391.
438
11. Bender, M.A.; Gooch, P.C.; Kondo, S. The Gemini-XI S-4 spaceflight-radiation interaction experiment: The
439
human blood experiment. Radiat. Res. 1968, 34, 228–238.
440
12. Horneck, G.; Rettberg, P.; Kozubek, S.; Baumstark-Khan, C.; Rink, H.; Schäfer, M.; Schmitz, C. The
441
influence of microgravity on repair of radiation-induced DNA damage in bacteria and human fibroblasts.
442
Radiat. Res. 1997, 147, 376–384.
443
13. Pross, H.D.; Kiefer, J. Repair of cellular radiation damage in space under microgravity conditions. Radiat.
444
Environ Biophys. 1999, 38, 133–138.
445
14. Takahashi, A.; Ohnishi, K.; Takahashi, S.; Masukawa, M.; Sekikawa, K.; Amano, T.; Nakano, T.; Nagaoka,
446
S.; Ohnishi, T. The effects of microgravity on induced mutation in Escherichia coli and Saccharomyces
447
cerevisiae. Adv. Space Res. 2001, 28, 555–561.
448
15. Takahashi, A.; Ohnishi, K.; Takahashi, S.; Masukawa, M.; Sekikawa, K.; Amano, T.; Nakano, T.; Nagaoka,
449
S.; Ohnishi, T. The effects of microgravity on ligase activity in the repair of DNA double-strand breaks. Int.
450
J. Radiat. Biol. 2000, 76, 783–788.
451
16. Bücker, H.; Horneck, G.; Reitz, G. Embryogenesis and organogenesis of Carausius morosus under
452
spaceflight conditions. Naturwissenschaften 1986, 73, 433–434.
453
17. Gao, Y.; Xu, D.; Zhao, L.; Zhang, M.; Sun, Y. Effects of microgravity on DNA damage response in
454
Caenorhabditis elegans during Shenzhou-8 spaceflight. Int. J. Radiat. Biol. 2015, 91, 531–539. doi:
455
10.3109/09553002.2015.1043754.
456
18. Ikenaga, M.; Yoshikawa, I.; Kojo, M.; Ayaki, T.; Ryo, H.; Ishizaki, K.; Kato, T.; Yamamoto, H.; Hara, R.
457
Mutations induced in Drosophila during space flight. Biol. Sci. Space 1997, 11, 346–350.
458
19. Kobayashi, Y.; Kikuchi, M.; Nagaoka, S.; Watanabe, H. Recovery of Deinococcus radiodurans from radiation
459
damage was enhanced under microgravity. Biol. Sci. Space 1996, 10, 97–101.
460
20. Yatagai, F.; Ishioka, N. Are biological effects of space radiation really altered under the microgravity
461
environment? Life Sci. Space Res. 2014, 3, 76–89. doi: http://dx.doi.org/10.1016/j.lssr.2014.09.005.
462
21. Moreno-Villanueva, M.; Wong, M.; Lu, T.; Zhang, Y.; Wu, H. Interplay of space radiation and
463
microgravity in DNA damage and DNA damage response. NPJ Microgravity 2017, 3, 14. doi:
464
10.1038/s41526-017-0019-7.
465
22. Yatagai, F.; Honma, M.; Dohmae, N.; Ishioka, N. Biological effects of space environmental factors: A
466
possible interaction between space radiation and microgravity. Life Sci. Space Res. 2019, 20, 113–123. doi:
467
10.1016/j.lssr.2018.10.004.
468
23. Indo, H.P.; Tomiyoshi, T.; Suenaga, S.; Tomita, K.; Suzuki, H.; Masuda, D.; Terada, M.; Ishioka, N.; Gusev,
469
O.; Cornette, R.; Okuda, T.; Mukai, C.; Majima, H.J. MnSOD downregulation induced by extremely low 0.1
470
mGy single and fractionated X-rays and microgravity treatment in human neuroblastoma cell line, NB-1. J.
471
Clin. Biochem. Nutr. 2015, 57, 98–104. doi: 10.3164/jcbn.15-20.
472
24. Wang, T.; Sun, Q.; Xu, W.; Li, F.; Li, H.; Lu, J.; Wu, L.; Wu, Y.; Liu, M.; Bian, P. Modulation of modeled
473
microgravity on radiation-induced bystander effects in Arabidopsis thaliana. Mutat. Res. 2015, 773, 27–36.
474
doi: 10.1016/j.mrfmmm.2015.01.010.
25. Beck, M.; Moreels, M.; Quintens, R.; Abou-El-Ardat, K.; El-Saghire, H.; Tabury, K.; Michaux, A.; Janssen,
476
A.; Neefs, M.; van Oostveldt, P.; De Vos, W.H.; Baatout, S. Chronic exposure to simulated space conditions
477
predominantly affects cytoskeleton remodeling and oxidative stress response in mouse fetal fibroblasts.
478
Int. J. Mol. Med. 2014, 34, 606–615. doi: 10.3892/ijmm.2014.1785.
479
26. Pani, G.; Verslegers, M.; Quintens, R.; Samari, N.; de Saint-Georges, L.; van Oostveldt, P.; Baatout, S.;
480
Benotmane, M.A. Combined exposure to simulated microgravity and acute or chronic radiation reduces
481
neuronal network integrity and survival. PLoS One 2016, 11, e0155260. doi: 10.1371/journal.pone.0155260.
482
27. Ikeda, H.; Souda, H.; Puspitasari, A.; Held, K.D.; Hidema, J.; Nikawa, T.; Yoshida, Y.; Kanai, T.; Takahashi,
483
A. A new system for three-dimensional clinostat synchronized X-irradiation with high-speed shutter for
484
space radiation research. Biol. Sci. Space 2016, 30, 8–16. doi: 10.2187/bss.30.8.
485
28. Ikeda, H.; Souda, H.; Puspitasari, A.; Held, K.D.; Hidema, J.; Nikawa, T.; Yoshida, Y.; Kanai, T.; Takahashi,
486
A. Development and performance evaluation of a three-dimensional clinostat synchronized heavy-ion
487
irradiation system. Life Sci. Space Res. 2017, 12, 51–60. doi: 10.1016/j.lssr.2017.01.003.
488
29. Takahashi, A.; Ikeda, H.; Souda, H.; Puspitasari, A.; Held, K.D.; Hidema, J.; Nikawa, T.; Yoshida, Y.; Kanai,
489
T. Performance evaluation of new devices to synchronize heavy-ion or X-ray irradiation and simulated
490
microgravity for space radiation research ~ Improvement of a control stage ~. Proceedings of the 31st
491
International Symposium on Space Technology and Science, Japan, June 6; Imai, R. Ed.; Japan Convention
492
Services, Inc., Tokyo, Japan, 2017; 2017-p-09.
493
30. Hada, M.; Ikeda, H.; Rhone, J.R.; Beitman, A.J.; Plante, I.; Souda, H.; Yoshida, Y.; Held, K.D.; Fujiwara, K.;
494
Saganti, P.B.; Takahashi, A. Increased chromosome aberrations in cells exposed simultaneously to
495
simulated microgravity and radiation. Int. J. Mol. Sci. 2018, 20, 43. doi: 10.3390/ijms20010043.
496
31. Hartwell, L. Defects in a cell cycle checkpoint may be responsible for the genomic instability of cancer cells.
497
Cell 1992, 71, 543–546. doi: https://doi.org/10.1016/0092-8674(92)90586-2.
498
32. Cho, R.J.; Huang, M.; Campbell, M.J.; Dong, H.; Steinmetz, L.; Sapinoso, L.; Hampton, G.; Elledge, S.J.;
499
Davis, R.W.; Lockhart, D.J. Transcriptional regulation and function during the human cell cycle. Nat. Genet.
500
2001, 27, 48–54. doi: 10.1038/83751.
501
33. Cohen, B.A.; Mitra, R.D.; Hughes, J.D.; Church, G.M. A computational analysis of whole-genome
502
expression data reveals chromosomal domains of gene expression. Nat. Genet. 2000, 26, 183–186. doi:
503
10.1038/79896.
504
34. Huang, D.W.; Sherman, B.T.; Lempicki, R.A. Systematic and integrative analysis of large gene lists using
505
DAVID Bioinformatics Resources. Nat. Protoc. 2009, 4, 44–57. doi: 10.1038/nprot.2008.211.
506
35. Kanehisa, M.; Goto, S. KEGG: Kyoto Encyclopedia of Genes and Genomes. Nucleic Acids Res. 2000, 28,
507
27–30. doi: 10.1093/nar/28.1.27.
508
36. Formisano, L.; Lu, Y.; Servetto, A.; Hanker, A.B.; Jansen, V.M.; Bauer, J.A.; Sudhan, D.R.; Guerrero-Zotano,
509
A.L.; Croessmann, S.; Guo, Y.; Ericsson, P.G.; Lee, K.M.; Nixon, M.J.; Schwarz, L.J.; Sanders, M.E.; Dugger,
510
T.C.; Cruz, M.R.; Behdad, A.; Cristofanilli, M.; Bardia, A.; O'Shaughnessy, J.; Nagy, R.J.; Lanman, R.B.;
511
Solovieff, N.; He, W.; Miller, M.; Su, F.; Shyr, Y.; Mayer, I.A.; Balko, J.M.; Arteaga, C.L. Aberrant FGFR
512
signaling mediates resistance to CDK4/6 inhibitors in ER+ breast cancer. Nat. Commun. 2018, 10, 1373. doi:
513
10.1038/s41467-019-09068-2.
514
37. Levav-Cohen, Y.; Goldberg, Z.; Zuckerman, V.; Grossman, T.; Haupt, S.; Haupt, Y. C-Abl as a modulator
515
of p53. Biochem. Biophys. Res. Commun. 2005, 331, 737–749. doi: 10.1016/j.bbrc.2005.03.152.
516
38. Charrier-Savournin, F.B.; Château, M.T.; Gire, V.; Sedivy, J.; Piette, J.; Dulic, V. p21-Mediated nuclear
517
retention of cyclin B1-Cdk1 in response to genotoxic stress. Mol. Biol. Cell. 2004, 15, 3965–3976. doi:
518
10.1091/mbc.e03-12-0871.
519
39. Harper, J.W.; Elledge, S.J.; Keyomarsi, K.; Dynlacht, B.; Tsai, L.H.; Zhang, P.; Dobrowolski, S.; Bai, C.;
520
Connell-Crowley, L.; Swindell, E. Inhibition of cyclin-dependent kinases by p21. Mol. Biol. Cell. 1995, 6,
521
387–400.
522
40. Gao, C.L.; Wang, G.W.; Yang, G.Q.; Yang, H.; Zhuang, L. Karyopherin subunit-α 2 expression accelerates
523
cell cycle progression by upregulating CCNB2 and CDK1 in hepatocellular carcinoma. Oncol. Lett. 2018,
524
15, 2815–2820. doi: 10.3892/ol.2017.7691.
525
41. Ishimi, Y.; Komamura-Kohno, Y.; Kwon, H.J.; Yamada, K.; Nakanishi, M. Identification of MCM4 as a
526
target of the DNA replication block checkpoint system. J. Biol. Chem. 2003, 278, 24644–24650. doi:
527
10.1074/jbc.M213252200.