PCA and SOM based Dimension Reduction Techniques
for Quaternary Protein Structure Prediction
Sanyukta Chetia
Department of Electronics and Communication Engineering,
Gauhati University-781014, Guwahati, Assam, India.
Kandarpa Kumar Sarma
Department of Electronics and Communication Engineering,
Gauhati University-781014, Guwahati, Assam, India.
ABSTRACT
Proteins play a vital role in every organism. The role played by a protein is mostly due to its structure and hence predicting the structure of a protein is important. There are vast numbers of experimental techniques that can be used to predict the structure of a protein but these are very time consuming, expensive and tedious. As such, research is going on to develop approaches using soft-computing techniques that can be used to predict the structure of a protein in lesser time compared to traditional methods. The approach reported in this paper is to predict the structure of a protein using an image of a protein collected from Protein Data Bank (PDB). Certain image processing and dimension reduction techniques are applied together to a soft-computational framework to achieve the intended objective. The paper also shows how combination of dimension reduction techniques like Principal Component Analysis (PCA) and Self Organizing Map (SOM) along with some soft computational tools helps to predict the structure of a protein. The proposed approach is very much dissimilar to the approaches reported earlier based on estimation of an amino acid sequence. Here, we have used Artificial Neural Network (ANN) as a soft computational tool to predict the structure of a protein.
General Terms
Algorithm
Keywords
3D image, PCA, SOM, ANN, protein structure prediction
1.
INTRODUCTION
[image:1.595.318.538.226.405.2]Proteins play a wide variety of functions in every organism. The backbone of proteins is amino acid molecules [1] [2]. Protein structure prediction leads to the discovery of different important drugs, enzymes etc. and hence it is considered to be one of the most important research domains. Of late, machine learning techniques have received attention as important aids to predict the structure of a protein in lesser time and with reduced complexity. Artificial Neural Network (ANN) as a soft computational tool can be considered to be one such machine learning technique that can be used to predict the structure of a protein, as it possesses the learning capability from the environment. The prediction of proteins is related to identification of its four different levels known as primary, secondary, tertiary and quaternary structure [2]. The different structures of proteins are shown in figure 1.
Figure 1.Hierarchical level of protein structure [3]
The primary structure of a protein mainly consists of a chain of amino acid molecules linked by peptide bonds. The secondary structure of a protein mainly consists of three sub-structures known as alpha-helices, beta sheets or strands and coil or loop. Proteins generally have a tendency to fold into a compact form. This state of a protein is said to be the tertiary structure of a protein. When a large number of protein molecules are combined, it gives rise to the so called quaternary structure of a protein [4].
Here, we are proposing a technique to predict the structure of a protein using 3D image of a protein, certain dimension reduction techniques and ANN. Images of protein Hemoglobin, Glyoxylase and Myoglobin are collected from PDB [5]. From these images, features are extracted in such a way that the contents retain the most relevant information about the image excluding the non-relevant portions. This in essence, is dimension reduction. The feature sets thus obtained are next used as ANN’s input enabling it to learn and subsequently predict the structure of a protein.
2.
LITERATURE REVIEW
A few notable works have been reported which dealt with protein structure prediction. A work by Bordoloi et.al [6] is related to the prediction of secondary structure of proteins using ANN. Secondary structure prediction from amino acid sequence is the main motive of their work. They have used three proteins namely Hemoglobin, Sickle cell anemia and Myoglobin and coded the proteins with the help of coded amino acids. A total of three classifiers are designed. The third classifier produces the desired secondary structure of proteins when the input to the first classifier is amino acids and the input to the second classifier is the amino acid sequence. A follow up of this work is reported in [7].
The work in [1] shows an approach to predict the tertiary structure of a protein from amino acid sequences using Multi-layer Perceptron Architecture. They have devised a coding scheme whereby the amino acid symbols are transformed to a real-valued vector. These transformed values are next normalized in the range of 0.05-1.00. They have collected the (φ) / (ψ) values from the PDB and converted the values to binary form. A set of RS126 dataset is used for training and 30 proteins from SCOP database are used for testing. They have used different window size which means different units of (φ) / (ψ) values are taken in each layer of the MLP and the prediction accuracy has been established based on these window sizes.
In [2], the paper focusses the work in such a way that the accuracy of the predicted secondary structure is high but the computational complexity is low. Conjugate Gradient (CG) learning algorithm is used. In their approach for predicting secondary structure of a protein which is a combination of three sub structures namely alpha helices, beta sheets and loops, they have also used amino acid sequences as the inputs. Their main goal is to make the ANN more efficient and as such they have used a dimension reduction technique called Principal Component Analysis (PCA).
3.
BASIC THEORETICAL
CONSIDERATIONS
This section provides the basic theoretical insights related to the experiments performed as a part of this work.
3.1
Principal Component Analysis (PCA)
PCA was first proposed by Karl Pearson in 1901. It is mostly used as a technique for reducing the dimensions of data. Dimension reduction has to be done in such a way that the most important information that is contained in the data is not lost. In this respect, PCA serves as an effective dimension reduction method and accomplishes this by retaining the most useful principal components having larger variance and neglecting components having smaller variance [8]. The process of dimension reduction must be taken into account while predicting the structure of a protein as it reduces the training time of ANN which in turn reduces the computational complexity to perform the experiment.
3.2
Self-Organizing Map (SOM)
[image:2.595.314.507.218.365.2]SOM was first proposed by T.Kohonen. It is a type of ANN that requires no target vector. Given an input data pattern, it has the capability to classify data itself without any external supervision. Hence, it is said to be an unsupervised ANN [9]. The training process in SOM is competitive. The basic components in SOM are neurons which allow it to take meaningful decisions. It is also a dimension reduction technique that uses a mapping or projection procedure from a large dimension to a smaller dimension. It helps in reducing the dimensions of data by grouping the input patterns that have a similarity among themselves [10]. A simple SOM architecture is shown in figure 2.
Figure 2.SOM architecture [11]
3.3
ANN as a Soft Computational Tool
An ANN is a bio-inspired mechanism with the ability to learn from the surrounding. It is a non-parametric tool capable of using the learning for subsequent processing. The various applications of ANN include signal processing, control, robotics, pattern recognition, speech production, speech recognition, vision, data compression etc. The learning capability of ANN is due to the presence of components called artificial neurons. These artificial neurons just like the human neurons process the information. These can perform various mathematical and computational tasks. In an ANN, the input patterns are trained for a given target. After training, the network needs to be tested so as to see whether it can recognize the patterns or not and also to classify the patterns accordingly. The level of training an ANN has undergone is determined by mean square error (MSE). ANN can be used in a variety of network architecture like feed-forward, feed-back, fully interconnected net, competitive net etc. [9]. In our approach for protein structure prediction, we have used feed-forward architecture in multi-layer perceptron (MLP) configuration. A feed forward architecture in MLP configuration is shown in figure 3.
[image:2.595.321.502.613.734.2]
HEMOGLOBIN DECISION
GLYOXYLASE DECISION
[image:3.595.76.508.86.301.2]
MYOGLOBIN DECISION PROTEIN STRUCTURE
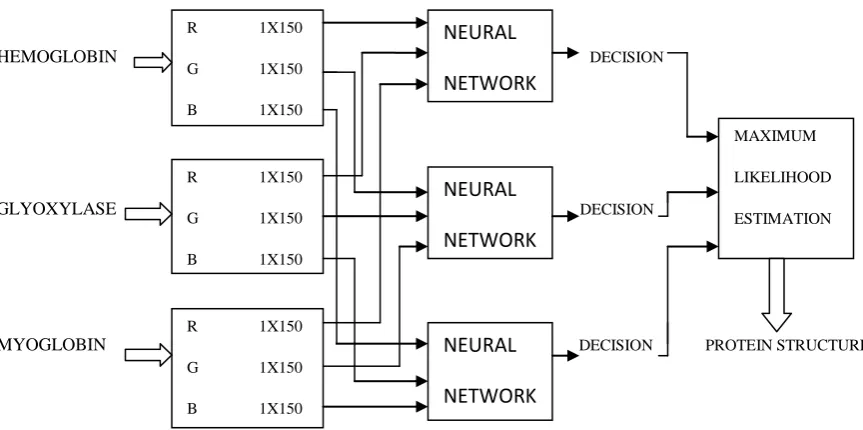
Figure 4.Proposed model for protein structure prediction
4.
PROPOSED MODEL FOR PROTEIN
STRUCTURE PREDICTION
The work has been done using PCA and SOM based dimension reduction techniques. The work done summarized as in figure 4.
4.1
PCA Based Method
The PCA based method consists of the following steps: Certain numbers of 3D image of protein Hemoglobin, Glyoxylase and Myoglobin are collected from PDB. The images of the proteins are shown in figure 5.The dimension of these images are very large and hence dimension reduction is technique such as PCA is used. Feature extraction is performed on these images separately. The red (R), green (G) and the blue (B) components of each image is separated out. PCA is performed and the first 150 principal components of each color components are retained. Three classifiers are designed. The first classifier is trained with the red (R) components of the images, the second classifier is trained with the green (G) components of the images and the third classifier is trained with the blue (B) components of the images. Each of the three classifiers produces three decisions. The aim is to find out the red (R), green (G) and the blue (B) components of which image is most likely. This is found out using Maximum Likelihood Estimation (MLE). The final structure of a protein can be predicted using the concept of majority selection process.
4.2
PCA and SOM Based Method
The PCA and SOM based method is also used to perform data dimension reduction. Like the previous case, 3D image of protein Hemoglobin, Glyoxylase and Myoglobin are collected from PDB. The dimension of these structures is now handled with PCA and SOM combined together. Feature extraction is performed on these images separately. The red (R), green (G) and the blue (B) components of each image are separated out. PCA extracts first 150 principal components of each color components which are used as inputs to the SOM. After
training in the optimum organized state, the weight matrix that is obtained for each color component is retained.
Just as the previous case, three classifiers are designed with the first classifier trained with the weight matrix of the red (R) components of the image, the second classifier trained with the weight matrix of the green (G) components of the image and the third classifier trained with the weight matrix of the blue (B) components of the image. Each of the three classifiers produces three decisions. The aim is to find out the red (R), green (G) and the blue (B) components of which image is most likely. This is found out using MLE. Based on the majority selection process the structure of a protein is predicted.
Figure 5.Images of protein
R 1X150
G 1X150
B 1X150
NEURAL
NETWORK
R 1X150
G 1X150
B 1X150
NEURAL
NETWORK
R 1X150
G 1X150
B 1X150
NEURAL
NETWORK
MAXIMUM
LIKELIHOOD
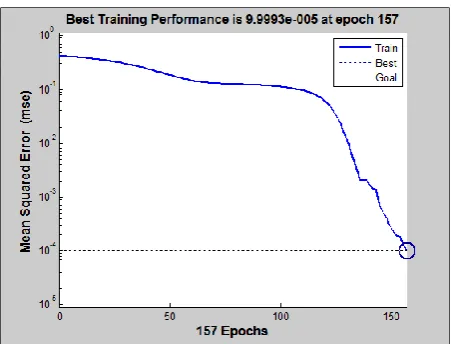
[image:3.595.316.556.501.643.2]Figure 6.Performance curve for red (R) component using PCA
Figure 7.Performance curve for green (G) component using PCA
[image:4.595.54.280.268.444.2]Figure 8.Performance curve for blue (B) component using PCA
[image:4.595.316.542.271.444.2]Figure 9.Performance curve for red (R) component using PCA and SOM
Figure 10.Performance curve for green (G) component using PCA and SOM
Figure 11.Performance curve for blue (B) component using PCA and SOM
5.
RESULTS AND DISCUSSION
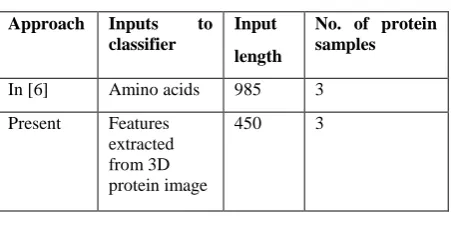
[image:4.595.316.541.471.646.2] [image:4.595.54.280.473.645.2]Table 1.Comparison of the approach applied in [6] and present approach
Approach Inputs to classifier
Input length
No. of protein samples
In [6] Amino acids 985 3 Present Features
extracted from 3D protein image
450 3
Table 2.Comparison of the ANN performance in [6] and present approach
Approach Computational Complexity
Performance goal
Time
In [6] More 10-6 80 sec
Present Less 10-4 4.5sec on
average
Table 1 gives a comparison of the approach applied in [6] and the present approach of our work. It can be seen that the inputs to a classifier in case of [6] are amino acids whereas the inputs are the color components or the weight matrix of the color components in this approach. This makes a difference to our work with the existing works. Although the number of protein samples is three in both the cases, it can be seen that the input length to the classifier is 985 in case of [6] and 450 in our approach. The larger input length gives rise to the computational complexity and hence, the computational complexity is found to be higher in [6] than this approach since, in the present approach, the inputs are applied to ANN only after dimension reduction using PCA and SOM.
A discussion of the approach presented in this paper is given as- the ANN classifiers are trained with the color components of the images and the weight matrix of the color components. The network architecture used is MLP and the training method used is Gradient Descent with Adaptive Learning Rate Algorithm. The performance goal is set to 0.0001 and the total number of epochs chosen is 900. It can be seen from the performance curves in figure 6-11 that the performance goal is achieved after a certain number of training sessions. After the network is trained with the images, the network is tested with the same sets of training images to see whether the network has learnt to classify patterns or not. It has been found that during testing the network with the same sets of training images, the network gives 100 percent accuracy. The network has been provided with an input length of 450 and the network is now tested with unknown images of a protein. It has been found that certain number of unknown proteins resembles the trained proteins. This shows the similarity of the unknown structure of a protein to the known structure of a protein. The unknown structure is thus, predicted using MLE. It has been found that both PCA and SOM produce the same result in structure prediction only the computational complexity is different.
The performance curves that are obtained when the network is trained with the red (R), green (G) and blue (B) components of the image are shown in figures 6, 7, and 8 respectively. The performance curves that are obtained when the network is trained with the weight matrix of each of the color
[image:5.595.50.276.93.208.2]components are shown in figures 9, 10 and 11 respectively. Table 3 illustrates the configuration of ANN while table 4 and 5 illustrates the transfer functions of the hidden layers using PCA and combined PCA and SOM respectively. Also, the performance of ANN using PCA and combined PCA and SOM is illustrated in table 6 and 7 respectively.
Table 3.ANN configuration
ANN Training type
Maximum no. of epochs
No. of hidden layers
MLP traingda 900 3
Table 4.Transfer function of hidden layers in MLP color component is used
First layer Second layer Third layer
logsig logsig logsig
Table 5.Transfer function of hidden layers when weight matrix of color component is used
First layer Second layer Third layer
logsig tansig tansig
Table 6.Performance of ANN using PCA
Protein Color component
Epoch Time MSE
Hemoglobin, Glyoxylase, Myoglobin
Red (R) 152 1 sec 9.99 x 10⁻⁵ Green (G) 222 2 sec 9.64 x 10⁻⁵ Blue (B) 157 1 sec 9.99 x 10⁻⁵
Table 7.Performance of ANN using combined PCA and SOM
Protein Color component
Epoch Time MSE
Hemoglobin, Glyoxylase, Myoglobin
Red (R) 269 3 sec 9.41 x 10⁻⁵ Green (G) 129 1 sec 3.52 x 10⁻⁵ Blue (B) 177 1 sec 9.81 x 10⁻⁵
6.
CONCLUSION
through which protein structures can be predicted without resorting to tedious experimental techniques.
The present approach is found to be superior in terms of computational complexity to the one described in [6].
This work can lead to the final derivation of quaternary structure of a protein. The usefulness of predicting the quaternary structure of a protein lies in the fact that we can know about the functioning of different proteins. The proper function of a protein is determined by the tertiary and the quaternary structure of a protein. Due to the malfunctioning of different proteins, various types of deficiencies or diseases occur in the human body. If we can predict the structure of the protein we can design suitable drugs or enzymes and hence predicting the structure of a protein is becoming a major challenge.
7.
REFERENCES
[1] S. K. Kushwaha and M. Shakya, “Multi-layer Perceptron Architecture for Tertiary Structure Prediction of Helical Content of Proteins from Peptide Sequences’’, Proceedings of International Conference on Advances in Recent Technologies in Communication and Computing, pp. 465 – 467, 2009
[2] M. K. Elbashir and J Wang., “Protein Secondary Structure Prediction: Speeding up Conjugate Gradient Neural Network’’, Proceedings of 3rd International Conference on Biomedical Engineering and Informatics (BMEI 2010), pp. 2347 – 2351, 2010
[3] BIO 100 Principles of Biology I
Organic Molecules in Living Systems (http://www.doctortee.com/dsu/tiftickjian/bio100/biol-molecules.html)
[4] Protein structure
(http://en.wikipedia.org/wiki/Protein_structure)
[5] RCSB Protein Data Bank
(http://www.rcsb.org/pdb/home/home.do)
[6] H. Bordoloi and K. K. Sarma, “Protein Structure Prediction using Artificial Neural Network’’, International Journal of Computer Applications on Electronics, Special Issue of International Conference on Electronics, Information and Communication Engineering - ICEICE No.3, Dec 2011
[7] H. Bordoloi and K. K. Sarma, “Protein Structure Prediction Using Multiple Artificial Neural Network Classifier”, Studies in Computational Intelligence, 2012, Volume 395, Soft Computing Techniques in Vision Science, Pages 137-146, Springer Verlag, Berlin, 2012 [8] Satish Kumar, “Neural Networks-A Classroom
Approach” ,McGraw-Hill, New Delhi,2011
[9] S N Sivanandam, S Sumathi and S N Deepa, ``Introduction to Neural Networks using MATLAB``, Tata McGraw-Hill Education, New Delhi,2006
[10]Self- Organizing Map (http://en.wikipedia.org/wiki/Self-organizing_map)
[11]Wires Data Mining and Knowledge Discovery (http://wires.wiley.com/WileyCDA/WiresArticle/wisId-WIDM1052.html)
[12]Artificial Neural Network
![Figure 1.Hierarchical level of protein structure [3]](https://thumb-us.123doks.com/thumbv2/123dok_us/8115245.792303/1.595.318.538.226.405/figure-hierarchical-level-of-protein-structure.webp)
![Figure 2.SOM architecture [11]](https://thumb-us.123doks.com/thumbv2/123dok_us/8115245.792303/2.595.321.502.613.734/figure-som-architecture.webp)