ISSN 2286-4822
www.euacademic.org DRJI Value: 5.9 (B+)
Characterization of Liver Changes in Obese Patient
Using Computed Tomography
MOHAMED HASANEEN
College of Medical Radiological Sciences Sudan University of Science and Technology, Khartoum, Sudan Al-Ghad International College of Applied Medical Science Medical Imaging Technology Department, Dammam, KSA
MOHAMED YOUSEF
College of Medical Radiological Sciences Sudan University of Science and Technology, Khartoum, Sudan Radiologic Sciences Program, Batterjee Medical College
Jeddah, Saudi Arabia ASMA ELAMIN
College of Medical Radiological Sciences Sudan University of Science and Technology, Khartoum, Sudan
LUBNA BUSHARA
Hail University, College of Medical Applied Sciences Department of Diagnostic Radiology, Hail – KSA
MOHAMMED SALIH
Al-Ghad International College for Applied Medical Science Medical Imaging Technology Department, Abha, KSA
GAMAREDINE ELTAYB
Al-Ghad International College of Applied Medical Science Medical Imaging Technology Department, Dammam, KSA
Abstract
Background: Obesity is a reversible condition characterized
steatohepatitis, fibrosis, cirrhosis and hepatocellular carcinoma (HCC), which may occur in up to 15% of cases.
Methods: This study was conducted to evaluate the
relationship of body mass index (BMI) and the changes in the liver (Size, texture and pathology) by computed tomography (CT) in order to better understand obesity risk factors such as fatty liver disease (FLD) specific for second type non-alcoholic fatty liver disease (NAFLD).
Results: Over the 28-month period, 138 men and 62 women (n
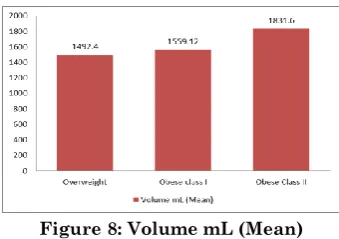
= 200) were recruited into the study. Their ages ranged from 17-79 years (mean, 48 years). BMI ranged from 25.2-39.8 kg/m2 (mean [SD], 32.5 [± 7] kg/m2). The mean (SD) BMI in the men was 30.6 (± 3.6) kg/m2 and that in the women was 35.7 (± 3.5) kg/m2. 76 patients had low-risk BMI (25-29.9 kg/m2) and liver volume mean was 1492cc, 64 patients had a moderate-risk BMI (30-34.9 kg/m2) and liver volume mean was 1559cc, and 60 patients had a high-risk BMI (35-39.9 kg/m2) and liver volume mean was 1831cc, fatty liver was 28% from all patients.
Conclusions: Our results indicated that the liver volume
increased approximately linearly with increasing BMI, there is strong and near linear relationship between BMI and NAFLD. Fatty liver was high incidences in men than women, Gallbladder stones was the highest incidence rate among all BMI cottagers
Key words: Obesity, BMI, Fatty liver disease, NAFLD, liver volume, and liver pathology related obesity.
1. INTRODUCTION:
Obesity is a major health problem worldwide, Obesity also increases the risk of developing several chronic diseases such as type II diabetes, insulin resistance, coronary heart disease and form of liver disease called nonalcoholic fatty liver disease (NAFLD). (Ahmed A, 2015)
steatohepatitis (NASH, fat in the liver causing liver inflammation), to cirrhosis (irreversible, advanced scarring of the liver as a result of chronic inflammation of the liver). All of the stages of nonalcoholic fatty liver disease are now believed to be closely associated with obesity. In fact, the BMI correlates with the degree of liver damage, that is, the greater the BMI the greater the liver damage. (Ahmed A, 2015)
In 2016, 39% men and 39% of women aged 18+ were overweight (BMI ≥ 25 kg/m2) and 11% of men and 15% of women were obese (BMI ≥30 kg/m2). (WHO, GHO. data 2016)
Computed Tomography evaluation of NAFLD is based on the attenuation values of the liver parenchyma, evaluated as Hounsfield units (HUs), and dependent on tissue composition. As the attenuation value of fat (i.e., approximately -100 HU) is much lower than that of soft tissue, NAFLD lowers the attenuation of liver parenchyma, the accurate diagnosis of fatty infiltration of the liver has been well described on unenhanced CT studies. (Lawrence DA, 2012)
The aim of the current study was to Characterization of liver changes (size, texture and pathologies) amongst obese patient using computed tomography.
2. MATERIALS AND METHOD
This is a retrospective study has been conducted in Fedail hospital, and Royal Scan diagnostic center- Khartoum-Sudan in the period from July 2016 to December 2018.
2.1-Subjects
2.2-Inclusion criteria:
- Any ages and genders Patients. - Contrast-enhanced abdominal CT. - Overweight Patients (above 25 BMI)
2.3-Exculusion criteria - Body mass index less than 25 - Incomplete images.
- Images with artifacts (for example: respiratory artifacts) which would make density measurements inaccurate or unreliable
2.4-Study variables
A clinical data sheet for each patient was contain age, gender and the main variable is the BMI, the measurements of liver (textures and size) and the report of the suggested diagnosis from computed tomography liver scan.
2.5-Machine used
Multi detectors computed tomography units (Toshiba - 64 slice) and (Siemens -16 slice) with automatic injector unit
2.6-Technique used
Unenhanced CT, the normal liver has slightly greater attenuation than the spleen and blood, and intrahepatic vessels are visible as relatively hypo-attenuated structures. Fatty liver can be diagnosed if the attenuation of the liver is at least 10 HU less than that of the spleen or if the attenuation of the liver is less than 40 HU.
2.7-Measurement
The following measurements of the liver were performed independently by researcher. Midhepatic point craniocaudad (MHP CC). Maximum CC to liver tip (Max CC). Maximum transverse dimension and (MHP) anteroposterior (AP) dimension of the liver.
The criteria for detection of Fatty liver on CT by measurement liver and spleen Attenuation on non-intravenous contrast scans included the following: liver attenuation 10 HU less than the spleen attenuation, absolute liver attenuation of less than 40 HU, and liver-to-spleen attenuation ratio less than 1. (Dendl L. M., 2012)
2.8-Analysis
The results were picked up about the incidental findings and analyzed using the statistical methods of mean and standard deviation, followed by generation of different figures, graphs, and tables. The research subjects were classified into three clusters (overweight, obese class I and obese class II). Computed tomography was utilized to detect the changes in liver (size, texture and pathologies) amongst obese patients.
2.9-Ethical consideration
3. RESULTS
The study results of the study represented as the following:
Figure 1: Gender distribution
Figure 2: Frequency distribution of Obesity among patients
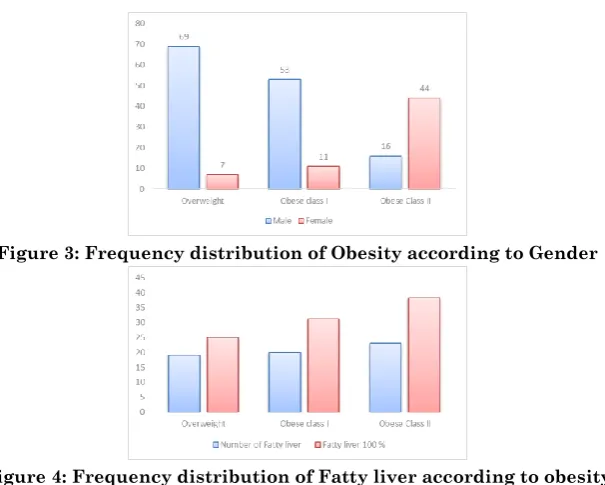
Figure 3: Frequency distribution of Obesity according to Gender
Figure 5: Frequency distribution Fatty liver according to gender
Figure 6: Frequency distribution of Non-Fatty liver according to obesity class
Figure 7: Characterization liver dimensions (Mean) related to BMI
Figure 9: Characterization pathologies related to BMI
Figure 10: Highly incidences pathology
4. DISCUSSION
had a high-risk BMI (35-39.9 kg/m2) and liver volume mean was 1831cc, which indicate that the liver volume increased approximately linearly with increasing BMI , fatty liver was 28% from all patients with high incidences in men than women, Gallbladder stones as illustrated in Figure 10 was the highest incidence pathology among all BMI cottagers.
Diagnoses of fatty infiltration of the liver with CT was been performed by using unenhanced CT, this study showed that fatty infiltration of the liver is diagnosed on portal venous phase CT by qualitatively identifying regions of focal fatty sparing as areas of increased attenuation against the background fatty low-density liver parenchyma. Using this type of qualitative assessment, we have shown 70% sensitivity and 100% specificity in diagnosing fatty infiltration of the liver on contrast-enhanced CT.
Also this study as depicted by Figure 3 that overweight was higher in men (about 90.8 %) than women (9.2 %), obesity class I was higher in men (83 %) than women (17.1 %) and obesity class II was higher in women (73.3 %) than men (26.6 %) Almost 3 in 4 men (88.4 %) were considered to be overweight or obesity class I, and about 2 in 3 women (70%) were considered to be obesity class II. the prevalence of overall obesity and extreme obesity increased significantly among women, however, there were no significant increases for men. Figure 8 present that BMI are significant factors that influence liver diameter and volume. A correlation between organ size and weight in anthropometric findings increases in BMI is supported to increase in liver size, in this study we found that BMI exerts a greater influence on liver size and volume. The max craniocaudally lengths (max.CC) as portrayed in Figure 7 is significantly higher in high-risk BMI (35-39.9 kg/m2) than those of the moderate-risk BMI (30-34.9 kg/m2).
databases from the reference BMI category (<24 kg/m2) through to BMI category less than (>40 kg/m2), In the gender-stratified analysis Figure 5 shows that Men have a modestly greater absolute risk of developing NAFLD in all BMI categories than women, data which fit with greater liver fat content in men and their higher risk of type 2 diabetes at most BMIs. Physicians need to be aware of the strong and near linear relationship between BMI and NAFLD risk.
Fatty liver disease is often undiagnosed due to the lack of systematic screening, the relationship between BMI and a recorded diagnosis of NAFLD presented here does not necessarily reflect the true relationship. Many patients with NAFLD are not recognized as having it, because liver function tests can be normal and may even have minor elevations are often not further investigated using medical imaging. Future studies are needed to determine whether there is a temporal change in the recording of NAFLD diagnosis.
There was no association between BMI and gallstones in this study. In Figure 9 at least 17% of individuals with high obesity (BMI > 35) have evidence of gallstone disease. Further studies confirmed that patients chance of having gallstones are increased by having an abdominal distribution of body fat, leading to the conclusion that obesity represents a risk for gallstones both through total body fat mass and through fat regional distribution.
CONCLUSION
immune dysfunction, so the morbidly obese should highlight the importance of both prevention of weight gain and weight reduction strategies in the prevention and management of obesity.
REFERENCES
1. Ahmed A, Wong RJ, Harrison SA. Nonalcoholic Fatty Liver Disease Review: Diagnosis, Treatment, and Outcomes. Clin Gastroenterol Hepatol 2015; 13:2062.
2. Carol Mattson Porth –(2008)pathophysiology fifth edition, Eighth, North American; LWW
3. Ji H, McTavish GD, Mortele KJ et, al (2010) Hepatic imaging with multidetector CT:Brigham and Women's Hospital: Harvard Medical School.
4. Kopka L, Rodenwaldt J, Hamm B (2008) Biphasic multi-slicehelical CT of the liver:Osaka, Japan: Osaka University Graduate School of Medicine.
5. Lawrence DA, Oliva IB, Israel GM. Detection of hepatic steatosis on contrast-enhanced CT images: diagnostic accuracy of identification of areas of presumed focal fatty sparing. AJR Am J Roentgenol. 2012;199:44–47
6. Marchesini G, Bugianesi E, Forlani G, Cerrelli F, Lenzi M, Manini R, Natale S, Vanni E, Villanova N, Melchionda N, Rizzetto M 2003 Nonalcoholic fatty liver, steatohepatitis, and the metabolic syndrome. Hepatology 37:917–923
7. Muggli D, Müller MA, Karlo C, Fornaro J, Marincek B, Frauenfelder T. A simple method to approximate liver size on cross-sectional images using living liver models. Clinical Radiology. 2009 Jul;64(7):682–9.
8. Organization WHO. Global Health Observatory (GHO) data – Overweight and obesity; 2016.