COMPARATIVE STUDY ON OPTIC DISC
SEGMENTATION TECHNIQUES
A.Padma
1, Dr.M.Sivajothi
2, Dr.M.Mohamed Sathik
31
Department of Computer Science, Sri ParaSakthi College for Women, (India)
2
Department of Computer Science, Sri ParaSakthi College for Women, (India)
3
Department of Computer Science, Sadakathullah Appa College, (India)
ABSTRACT
The main objective of this paper is to compare the overall performance of two approaches which can be used to
section the optic disc from fundus pictures. Glaucoma is a persistent eye disorder that reasons blindness. It is
one of the most not unusual causes of blindness within the global. It results in visual impairment which cannot
be regained. Although glaucoma is not curable, detection of the disease in proper time can prevent its further
development. The optic disc represents the vital capabilities in a retinal photograph that can be used to
diagnose certain retinal diseases. In this paper, strategies are carried out and their performances are in
comparison to find the high-quality method to segment the optic disc with high accuracy. The primary approach
segments the optic disc using super pixel classification technique. The second method uses level set method for
segmenting the optic disc. To analyze the overall performance of these approaches, several performance metrics
are used. This paper uses Precision rate, Recall rate, F-measure, Sensitivity and Specificity to analyze the
performance. From the experimental outcomes it is shown that the Super pixel technique performs better than
the alternative strategy.
Keywords
:
Glaucoma Screening , Level Set Segmentation, Optic Disc Segmentation Optic Cup
Segmentation, Parameter Optimization
1.
INTRODUCTION
Glaucoma is a disease of the eye causing optic nerve damage. The severity of the ailment may be understood by means of the reality that it is the second leading cause of blindness inside the global (Narasimhan and Vijayarekha 2011; Bulletin of the world health enterprise 2004). There is a plodding
160 | P a g e 21 mmHg [6]. Different methods of tracing glaucoma contain inclusive of Optical Coherence Tomography (OCT), Scanning Laser Polarimetry (SLP), and Confocal Scanning Laser Ophthalmoscopy (CSLO) to generate reference pictures to look at the eye and its inner structure [5].
These techniques are luxurious and require professional supervision. It is considered that
combining numerous imaging strategies will substantially improve the accuracy of glaucoma identity. The glaucoma disease is characterized with the aid of exchanges inside the shape of nerve fibers and optic disc parameters such as diameter, volume, and area [5], [7]. Structural modifications occur because of obstruction to the discharge of aqueous humor, which in turn will increase IOP. This injures the optic nerve fiber and stops the transmission of information from eye to the brain [8].
Ophthalmologists look at distinct regions to discover disorder at some stages in eye inspection. Special methods have been employed to determine representative features such as irregularity of blood vessels [9]. The fundus images are used for the analysis of glaucoma [10], [11] and diabetic retinopathy [12]. Mutilation to optic nerve fiber is detected using morphological features of fundus photographs [13]. Morphological capabilities including cup to disc ratio, the ratio of area of blood vessels in inferior-superior side to the nasal-temporal side and ratio of distance among the optic disc center and optic nerve head to diameter of the optic disc are used to discover glaucoma [10]. In morphological methods, choosing structural factors is hard which won't yield high classification accuracy [1], [10]. Image segmentation primarily based strategies were used for glaucoma detection [10], [14]. These segmentation methods have shortcomings like localization, thresholding or demarcation which may additionally lead to unacceptable consequences and unavoidable mistakes in glaucoma analysis [1]. In order to overcome these difficulties, automatic analysis strategies are preferred for glaucoma diagnosis.. Latest studies have proven that texture features [1], [15], [16] are very effective for glaucoma image detection. Higher Order Spectra (HOS) coupled with texture attributes are used to improve the classification accuracy [15]. In [16], Discrete Wavelet transform (DWT) energies are used as features for glaucoma detection. The HOS bispectrum features and wavelet energy features are used for glaucoma identification in [1]. Not like DWT, the Empirical Wavelet Transform (EWT) is a signal dependent decomposition technique. The DWT has a group of fixed basis functions which can be signal independent. The concept of EWT depends upon frequency spectrum of the signal.
F-measure, Sensitivity and Specificity to analyze the overall performance. From the experimental results it is shown that the Super pixel technique performs higher than the opposite approach.
The rest of the paper is organized as follows: In segment 2, the review of first method is presented. In segment 3, the second technique is depicted, together with its layout idea and realistic implementation approach. In phase 4, the overall performances of the two methods are compared and the experimental results are shown. Finally, conclusions are made in phase 5.
II
OPTIC
DISC
SEGMENTATION
USI
N
G
SUPERPIXEL
CLASSIFICATION
ALGORITHM
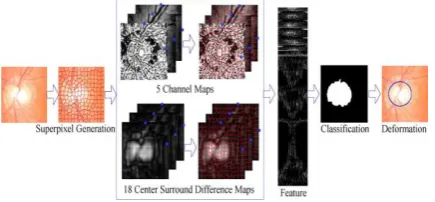
2.1 Super Pixel Generation
TheRGB image is taken as input. A super pixel is a group of pixels which have similar characteristics such as colour and brightness. Super pixels are generated using Simple Linear Iterative Clustering algorithm[17]. The Super pixel of RGB image is converted into HSV image and the h and s colorspaces are separated. The value v from HSV colorspace is not included since it is similar to red channel. The histogram equalization is applied to red r, green g, blue b, hue h and saturation s and is included to form five channel maps.
Fig. 1. Overall Block Diagram of Method1
2.2 Center Surround Statistics
Center surround statistics from super pixels is proposed as a texture feature. Nine spatial scale dyadic Gaussian pyramids are generated. The maps are computed from r, g and b channels to form 6 * 3 = 18 maps.
Assuming Ti where i= 1,2,3,...as the ith map, the feature CSSj consists of mean mj and variance vj of maps
within super pixels
where mj and vj from super pixel SPj with nj pixels are computed
2.3 Feature Extraction
Features are computed from five channel maps and center surround difference maps.Based on the assumption SPj1,SPj2,SPj3 and SPj4 are determined as neighbouring pixels for SPj.
The CSS feature for SPj was given as
.
4]
162 | P a g e
2.4 Final feature and Deformation
A support vector machine is used as the classifier to classify the super pixel as disc or non disc region. Mean filter is applied on the decision values to perform smoothing. By assigning +1 to positive and
-1 to negative samples, a matrix with binary value 1 as object and 0 as background is obtained.
The largest connected object is obtained from morphological operations and its boundary is employed as raw estimation of OD boundary. The Elliptical Hough transform is used for fitting ellipse and ASM (Active Shape Model) is employed to fine tune the disc boundary.
III
OPTIC
DISC
SEGMENTATION
USI
N
G
LEVEL
SET
SEGMENTATION
ALGORITHM
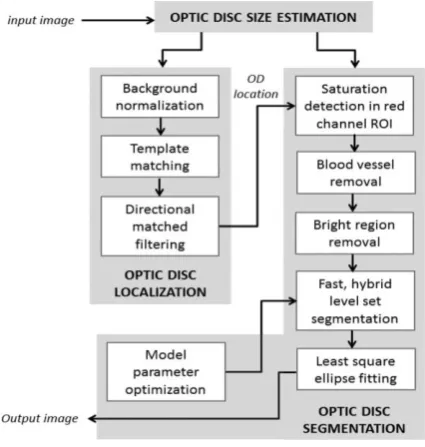
This is a fast and robust method for OD localization and segmentation. This method consists of three main phases namely OD size estimation, OD Localization and OD boundary segmentation.
3.1 OD Localization
The RGB image is taken as input. The image lightness is more uniform and homogenous in OD region than in RGB red channel. So the RGB image is converted into CIELAB image. Since the contrast of OD margin is high, the red channel is separated in CIELAB image. In order to reduce the false detection of OD candidates, an image illumination correction is applied. To locate the OD candidates, a binary template is selected where the disc is assigned a value 1 and the black background is assigned a value 0.The radius of the circle in the template is the estimated OD radius rOD-img. The template width is set as 3 X rOD-img . The Pearson correlation coefficient is
used to measure the degree to which CIELAB brightness sub image and the template match.
3.2 OD Segmentation
Regions such as exudates, PPA and myelinated nerve fiber show high correlations in the template matching algorithm. Based on the idea that the main vessel arcades originate from the OD center, the OD center is located by removing the false positives. A 2-D matched filter kernel is used to convolve with the green channel image to detect the main vessels on OD. In order to enhance the success rate of OD detection, a rectangular region is used with each OD candidate for vertical matched filtering. The size of the rectangular is assumed as 2 rOD-img X 6
rOD-img . The OD candidate with the maximum contrast in the region after matched filtering is determined to be
the OD location.
The vessels appear less prominently in the red channel and the OD appears with most contrast against the background. That‟s why the OD segmentation is performed in red channel. So the red channel is split up in ROI image.
papillary region remains unchanged, except for a small area at the boundary (on the inferior nasal, i.e., lower left, corner) where the blood vessels occupied in the input image.
The level set methodology was first proposed by Osher and Sethian [18]. The primary concept is to embed a propagating the front implicitly as the zero level set of a higher dimensional characteristic function ϕ(x, y, t).
Fig. 2. Overall Block Diagram of Method2
IV
PERFORMANCE
ANALYSIS
Experiments were conducted on a group of color images to verify the effectiveness of the proposed scheme. For the experimental purpose several standard, 512 × 52 cover images are taken. Some of these images are shown in Figure 3.
164 | P a g e
4.1. Experimental Results
To evaluate the performance of the proposed method several performance metrics are available. This paper uses the Precision Rate, Recall Rate, Sensitivity, Specificity and F-Measure to analyzes the performance.
1. Precision Rate
The precision rate is defined as the ratio of true positives to the sum of true positives and false positives. It is also called as Positive Predictive value (PPV)
where TP = True Positive (Equivalent with Hits) FP = False Positive (Equivalent with False Alarm)
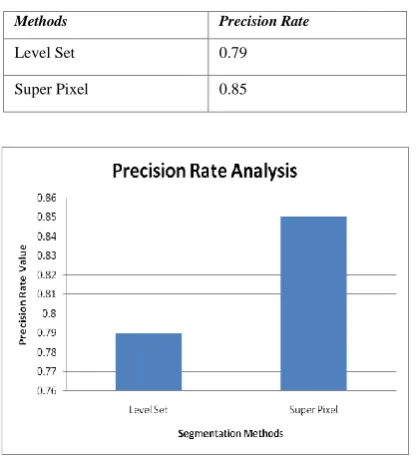
Table. 1 Precision Rate for two methods
Methods Precision Rate
Level Set 0.79
Super Pixel 0.85
Fig 4 Precision Rate for two methods
From fig 4, it is found that the precision rate value for Super pixel method is greater than the level set method. In this metric, true positive is one in which the case is positive and identified as positive. In other words, the persons who are affected by glaucoma were identified as affected. The precision rate mainly depends upon the value of false positives. As the false positive value increases, the value of precision rate decreases.
2. Recall Rate
are correctly identified as such the percentage of sick people who are correctly identified as having the disease condition.
Where TP = True Positive (Equivalent with Hits) FP = False Negative (Equivalent with Miss)
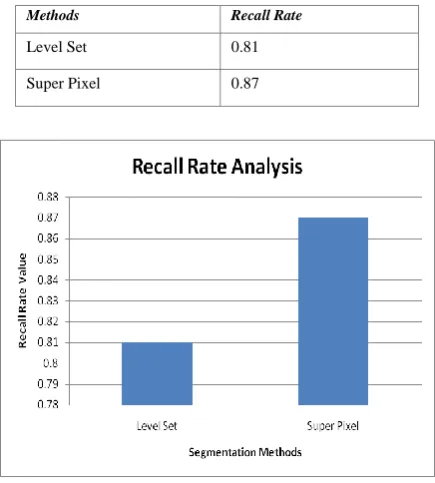
Table 2 Recall Rate for two methods
Methods Recall Rate
Level Set 0.81
Super Pixel 0.87
Fig 5 Recall rate for two methods
Fig 5 shows that the recall rate value determined is found to be higher for super pixel classification technique and lower for level set technique.In this metric, it measures the proportion of positives that are correctly identified. False negatives indicate that the number of persons affected by eye disease is identified as healthy person. Based on the value of false negatives, the value of recall rate gets changed. As the false negative value increases, the recall value decreases.
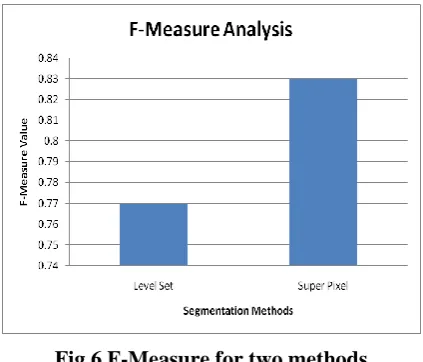
3. F-Measure
F-measure is the ratio of product of precision and recall to the sum of precision and recall. The f-measure can be calculated as,
166 | P a g e
Table.3 F-Measure for two methods
Methods F-Measure
Level Set 0.77
Super Pixel 0.83
From Table 3 it is observed that the F-measure value is superior for super pixel classification approach than the level set approach. Using this metric, product of precision and recall is calculated. Then the sum of precision and recall is calculated and the ratio between these two is taken as F-measure.
Fig 6 F-Measure for two methods
As the ratio of product of precision and recall rate to the sum of precision and recall rate is measured as F-measure, it mainly varies depending on the values of false positives and false negatives.
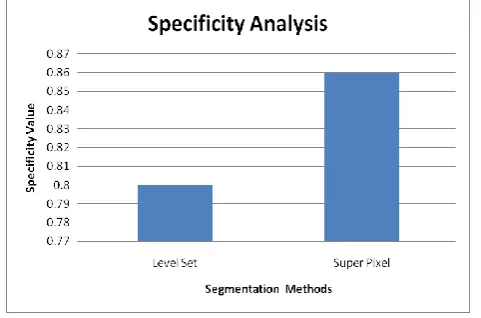
4. Specificity
Specificity measures the proportion of negatives which are correctly identified such as the percentage.
where, TN – True Negative (equivalent with correct rejection) FP – False Positive (equivalent with false alarm
Table 4 Specificity for two methods
Methods Specificity
Level Set 0.80
Fig 7 Specificity value for two methods
From Fig 8, the value of specificity is found to be lower for level set approach than super pixel approach.It measures the proportion of negatives that are correctly identified as the percentage of healthy people who are correctly identified as not having the condition. In this metric, true negative is one in which the case is negative and predicted as negative. As the value of false positive increases, the value of specificity decreases.
V CONCLUSION
This paper is to compare the performance of two methods which are used to segment the optic disc from the digital fundus images. The optic disc (OD constitute the important features in a retinal image that can be used to diagnose certain retinal diseases. In this paper two methods are implemented and their performances are compared to find the best method to segment the optic disc with high quality. The first method segments the optic disc using super pixel segmentation approach. The second method uses level set approach for segmenting the optic disc. To analyse the performance of these method several performance metrics are used. This paper uses Precision Rate, Recall Rate, F-Measure and Specificity to analyze the performance. From the experimental results it is shown that the Superpixel method performs better than the other method.
REFERENCES
[1] M. R. K. Mookiah, U. R. Acharya, C. M. Lim, A. Petznick, and J. S. Suri, “Data mining technique for automated diagnosis of glaucoma using higher order spectra and wavelet energy features,”
Knowledge-Based Systems, vol. 33, pp. 73–82, 2012.
[2] Y. C. Tham, X. Li, T. Y. Wong, H. A. Quigley, T. Aung, and C. Y. Cheng, “Global prevalence of glaucoma
and projections of glaucoma burden through 2040: A systematic review and meta-analysis,”
Ophthalmology, vol. 121, no. 11, pp. 2081–2090, 2014.
[3] R. Bock, J. Meier, L. G. Ny´ul, J. Hornegger, and G. Michelson, “Glaucoma risk index: Automated glaucoma detection from color fundus images,” Medical Image Analysis, vol. 14, no. 3, pp. 471–481, 2010.
[4] S. Kavitha, N. Zebardast, K. Palaniswamy, R. Wojciechowski, E. S. Chan, D. S. Friedman, R. Venkatesh, and P. Y. Ramulu, “Family history is a strong risk factor for prevalent angle closure in a south indian
168 | P a g e [5] M. J. Greaney, D. C. Hoffman, D. F. Garway-Heath, M. Nakla, A. L. Coleman, and J. Caprioli,
“Comparison of optic nerve imaging methods to distinguish normal eyes from those with glaucoma,” InvestigativeOphthalmology and Visual Science, vol. 43, no. 1, pp. 140–145, 2002.
[6] S. Y. Shen, T. Y. Wong, P. J. Foster, J. L. Loo, M. Rosman, S. C. Loon, W. L. Wong, S. M. Saw, and T. Aung, “The prevalence and types of glaucoma in Malay people: The Singapore Malay eye study,”Investigative Ophthalmology and Visual Science, vol. 49, no. 9, pp.3846–3851, 2008.
[7] L. G. Ny´ul, “Retinal image analysis for automated glaucoma risk evaluation,” Proc. SPIE: Medical Imaging, Parallel Processing of Images, and Optimization Techniques, vol. 7497, pp. 1–9, 2009.
[8] R. A. Gafar and T. Morris, “Progress towards detection and characterisation of the optic disk in glaucoma
and diabetic retinopathy,” Informatics for Health and Social Care, vol. 32, no. 1, pp. 19–25, 2007.
[9] J. Staal, M. Abr`amoff, M. Niemeijer, M. Viergever, and B. V. Ginneken, “Ridge based vessel segmentation in color images of the retina,” IEEE Transactions on Medical Imaging, vol. 23, no. 4, pp. 501–509, 2004.
[10] J. Nayak, U. R. Acharya, P. S. Bhat, N. Shetty, and T. C. Lim, “Automated diagnosis of glaucoma using digital fundus images,”Journal of Medical Systems, vol. 33, no. 5, pp. 337–346, 2009.
[11] W. L. Yun, U. R. Acharya, Y. Venkatesh, C. Chee, L. C. Min, and E. Ng, “Identification of different stages of diabetic retinopathy using retinal optical images,”Information Sciences, vol. 178, no. 1, pp. 106– 121,
2008.
[12] J. Nayak, P. S. Bhat, U. R. Acharya, C. Lim, and M. Kagathi, “Automated identification of diabetic retinopathy stages using digital fundus images,”Journal of Medical Systems, vol. 32, no. 2, pp. 107–115,
2008.
[13] N. V. Swindale, G. Stjepanovic, A. Chin, and F. S. Mikelberg, “Automated analysis of normal and
glaucomatous optic nerve head topography images,”Investigative Ophthalmology and Visual Science, vol.
41, no. 7,pp. 1730–1742, 2000.
[14] W. Adler, T. Hothorn, and B. Lausen, “Simulation based analysis of automated classification of medical
images,” Methods of Information in Medicine, vol. 43, no. 2, pp. 150–155, 2004.
[15] U. R. Acharya, S. Dua, X. Du, S. V. Sree, and C. K. Chua, “Automated diagnosis of glaucoma using texture
and higher order spectra features,”IEEE Transactions on Information Technology in Biomedicine, vol. 15,
no. 3, pp. 449–455, 2011.
[16] S. Dua, U. R. Acharya, P. Chowriappa, and S. V. Sree, “Wavelet based energy features for glaucomatous image classification,” IEEE Transactions on Information Technology in Biomedicine, vol. 16, no. 1, pp. 80– 8
[17] R. Achanta, A. Shaji, K. Smith, A. Lucchi, P. Fua, and S. Susstrunk,“Slic superpixels compared to state-of-the-art superpixel methods,”IEEE Trans. Pattern Anal. Mach. Intell., vol. 34, no. 11, pp.2274–2281, Nov. 2012.