ULTIMATE LOAD ANALYSIS OF BARCOM TEST MODEL
EMPLOYING THE DISCRETE ELEMENT METHOD
L.E.Kosteski1, J.D.Riera2, I.Iturrioz1
1Department of Mechanical Engineering, UFRGS, Porto Alegre, Brazil. 2Department of Civil Engineering, UFRGS, Porto Alegre, Brazil.
E-mail of corresponding author: [email protected]
ABSTRACT
The paper describes the analysis performed to predict the behavior up to failure of the pre-stressed concrete containment vessel model built at BARC experimental facilities in Tarapur, India. The truss-like discrete element method (DEM) was used to perform a nonlinear numerical analysis of the structure, a 1:4 reduced scale physical model of the pre-stressed concrete containment structure of the 540 MWe Tarapur, India, NPP (Units 3 and 4) subjected to internal pressure up to rupture. This method has been previously used with success in several areas of engineering where the simulation of fracture and fragmentation of non-homogeneous materials is essential and allows the prediction of fracture and size effects. In the present analysis the DEM is used to model one of the cylindrical panels of the containment cylinder, where failure is expected to occur. The panel is inserted in a FEM model of the entire containment to provide approximately correct boundary conditions. Since explicit time integration is resorted to in the analysis, the influence of the loading rate is previously examined. In the simulation analysis, relevant concrete material properties are assumed to be random fields of the spatial coordinates. The resulting displacement-pressure curves at pre-selected locations of the panel are given, as well as distribution of fractures and conventional steel stresses for different pressure levels up to failure. The failure configurations obtained in four simulations are finally shown.
INTRODUCTION
This work describes the analysis performed to predict the behavior up to failure of the prestressed concrete containment vessel model built at BARC experimental facilities in Tarapur, India. The BARCOM test model is a 1:4 scale representation of existing pressurized water reactors (PHWR) prestressed concrete inner containments of the 540 MW Tarapur Nuclear Power Plants (NPP) - Units # 3 and 4 - in India. In the reduced scale model, designed for an accident internal pressure of 0.1423 Mpa, the two steam generator openings in the dome as well as the main air lock, the fuel machine air lock and the emergency air lock barrel openings in the cylindrical shell were modeled.
The dominant load for the case under consideration is internal pressure, gravity loads and environmental effects constituting secondary effects. Under those conditions, the basic excitation of the containment cylinder is the hoop tensile membrane stress resultant due to internal pressure, which is twice the meridional or longitudinal stress resultant. In addition, compression dead loads tend to reduce the latter, which renders the development of longitudinal fractures in the containment cylinder as the expected failure mode.
One fundamental objective of NPP designer is to prevent that a failure mode starts in a pipe or equipment opening, that is, the global strength of the containment should not be affected by the presence of openings, which must therefore be designed to fail at a higher value of the internal pressure than that required to cause failure of the cylinder. The same principle applies to the detailing of the stiffening ring at the intersection of the dome and the cylinder, and of the cylinder with the base, regions subjected to large bending effects. Thus, in a correctly designed containment building, failure due to the fractures induced by the hoop membrane stress resultant should be expected. The following analysis assumed then such failure mode and predictions of the expected ultimate pressure must be regarded, from a reliability analysis viewpoint, as an upper bound of the experimental value. It is germane to point out that in a previous large scale experimental evaluation of containment under internal pressure, the observed failure mode was exactly the failure mode assumed in the present study [1].
THE TRUSS-LIKE DISCRETE ELEMENT METHOD
The truss-like Discrete Element Method (DEM) employed in this paper is based on the representation of a solid by means of an arrangement of one dimensional elements able to carry only axial loads. The equivalence between an orthotropic elastic continuum and the cubic arrangement of uni-axial elements consisting of a cubic cell with eight nodes at its corners plus a central node was shown by Nayfeh and Hefzy [2]. The discrete elements representation of the orthotropic continuum was adopted by the authors to solve structural dynamics problems by means of explicit direct numerical integration of the equations of motion, assuming the mass lumped at the nodes. Each node has three degrees of freedom, corresponding to the nodal displacements in the three orthogonal coordinate directions. DEM fundamental assumptions and equations are described in details in another paper presented at this conference and will not be reproduced herein due to space limitations1.
An important feature of the approach is the assumption that the specific fracture energy Gf is not constant
throughout the structure. In this paper, a Weibull distribution with coefficient of variation of 40% was adopted. It should be underlined again that fracture localization weakens as the non-homogeneous nature of the material becomes more pronounced, i.e., as the coefficients of variation of the fields that describe the material properties increase. Applications of the DEM in studies involving non-homogeneous materials subjected to fracture in which the single crack assumption through each element is valid, may be found in [3,4,5,6,7]. Additionally, references [8,9,10,11,12] demonstrate the reliability of the approach by comparing DEM predictions with experimental results or other numerical techniques.
DESCRIPTION OF THE MODEL OF A 45º SECTOR OF THE CONTAINMENT CYLINDER
The containment building was modeled employing the finite elements method (FEM) implemented in program Abaqus-Explicit v 6.9, except for a 45º cylindrical panel (see Fig.3a), which was modeled by means of a DEM routine introduced by the authors for this specific purpose in Abaqus- Explicit v 6.9. The sector modeled with discrete elements corresponds to a 45º opening circular cylindrical panel. This sector, shown in Fig. 3b, has 385830 degrees of freedom (DOF), corresponding to 128610 nodes, each with 3 DOF, 1.444.119 uni-axial elements, and 27327 steel rebars. In this sector, steel rebars are represented in the DEM model as individual uni-axial elements. Thus, fracture and fragmentation according to DEM assumptions, can only occur within this panel.
CONCRETE DEM MODEL. In Abaqus, each element is assigned a section, and each section is assigned a material type. Thus, in the cubic arrangement implied in the DEM formulation, four different sections may be identified (see Fig. 2) corresponding to: elements along corners (A), on lateral faces (C), internal (I) and diagonal (D). To account for the intrinsic variability of the material properties, defined as random fields, the following scheme is resorted to. A set of fifty values of each relevant material property is generated for each element section (A to D), such that the mean frequency of occurrence of each value of the material property is the same. The material properties adopted in the analysis are the following: Young’s Modulus E = 3.354E10 Pa, Lc= 0.047 m,
mean value of specific fracture energy Gf = 100 N/m, CV of Gf= 0.40 and Poisson’s ratio ν = 0.25. The fracture
criteria adopted for concrete and implemented in Abaqus is based on Hillerborg’s model [13] and is related with the specific fracture energy Gf of the material.
To model the cylindrical shell of the NPP containment, the basic cubic lattice arrangement of the DEM formulation is transformed to a circular cylindrical coordinate system, as discussed by Riera and Iturrioz [14]. Figure 3b shows a plot of the resulting DEM model of a generic 45º panel of the containment cylinder.
STEEL REBARS IN DEM MODEL. Steel rebars were accounted for by means of uni-axial elements that link selected nodes of the 3D truss-like model. These elements, subjected only to axial loads, are characterized by an elasto-plastic constitutive law with Ductile Damage Evolution. Young’s Modulus is 200000 MPa and the Yield Stress is 415 Mpa. The presence of the steel reinforcement alters the fracture properties of surrounding concrete [14] To account for this effect, concrete elements that have the same orientation of a neighboring steel rebar (distance smaller than a block dimension) have the specific fracture energy increased by a factor of 20. The structure has steel reinforcements on the inner and outer face of the wall, in both vertical and hoop directions. Stirrups are also modeled as individual rebars.
Fig.3: a) View of the complete FEM containment model, b) Plan view of DEM model of 45º sector of containment building and c) detail of cross-section.
a
b
PRESTRESSING TENDONS IN DEM MODEL. The effect of pre-stressing tendons was introduced in the model in the form of nodal forces (DEM) or external pressure (FEM), which are assumed to remain invariant during the loading process. Since tendon forces should increase as internal pressure is applied, this assumption entails a simplification, to be later removed in a more elaborate model. It is observed, however, that as the internal pressure increases, the tendon stresses soon reach the plastic region where they increase quite slowly up to failure. Hence, a lower bound response may be determined, in which the tendons pre-stressing force is considered equal to 80% of the ultimate tensile strength (UTS), specified as 26.6 Tons/cable (260.68 kN/cable). An upper bound response was also computed, admitting a pre-stressing force equal to the ultimate tensile strength. In both cases the tension in the tendons was applied first and then the internal pressure introduced in a second stage, thus reproducing the actual sequence of load application.
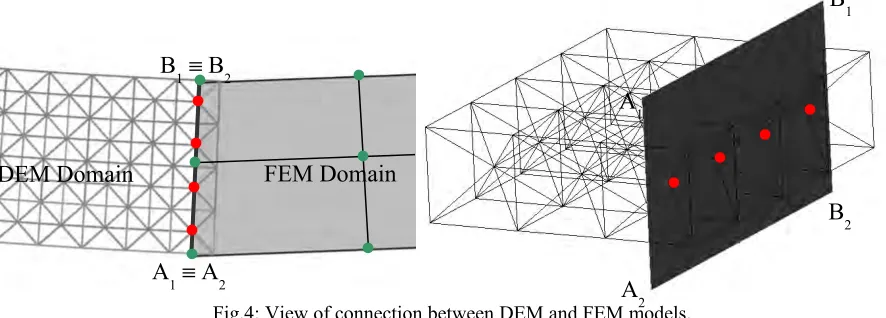
INTERFACE BETWWEN FEM AND DEM MODELS. The DEM model of a generic 45º sector was bounded by a FEM model using 3D tetrahedral elements, as schematically shown in Figure 3a. The FEM model contains 1343 elements and is designed to provide correct boundary conditions to the DEM cylindrical panel, by modeling the non-failing part of the containment, up to the load that causes failure of the 45º sector. The DEM model is connected to the FEM model by establishing a link between DEM central nodes and the external layer (red circles in Figure 4) and contact surface of the FEM model (A1A2B1B2 nodes shown on the grey surface in Figure 4). It may be seen in
Figure 4 that it is not necessary that the nodes of the FEM mesh coincide with the nodes of the DEM mesh. The displacement compatibility between DEM and FEM models is satisfied on the surface (A1A2B1B2).
The material of the FEM model was assumed to be isotropic and linearly elastic. In the dome an elastic modulus Ec = 3.354E10 Pa was adopted, while for the rest of the FEM model Ec = 3.00E10 Pa. This modulus was
defined to obtain a satisfactory agreement between the displacement computed employing both models. The specific mass and Poisson’s ratio of concrete were 2500 Kg/m3 and 0.25, respectively.
Fig.4: View of connection between DEM and FEM models.
INFLUENCE OF LOADING RATE AND FAILURE PRESSURE PREDICTION
All loads corresponding to dead weight and pre-stressing where applied first and an internal pressure with a variable loading rate was applied next. Figure 5 shows displacement-pressure curves at middle height of the DEM panel for different loading rates. The results clearly show that the spurious vibrations observed for the fastest loading rate (7 MPa/s) are greatly reduced for 1.75 MPa/s and hardly perceptible for lower rates. On the other hand, the differences between displacement-pressure curves, as expected, become important in the non-linear range, once extensive fracture and yielding occur in the structure. Differences decrease indicating convergence of response predictions, as the loading rate decreases. Figure 6 shows the rupture configurations of steel reinforcement for each loading rate. The stress distributions in the steel rebars is also shown. The loading rate for this case adopted for response predictions was 0.875 MPa/s, because both the deformation pressure curve as well as the final configuration stabilize at that rate and the processing cost is not excessive.
MODEL ERROR INDUCED BY ACCOUNTING FOR PRE-STRESS WIRES BY EXTERNAL PRESSURE
In order to assess the error induced by replacing prestressing tendons by means of external nodal forces, a
FEM Domain
DEM Domain
A
1≡
A
2B
1≡
B
2A
2
A
10.00 0.05 0.10 0.15 0.20 0.25 0.30 0.35 0.40 0.45 0.50 -5
0 5 10 15
7.00 MPa/s 1.75 MPa/s 0.875 MPa/s 0.50 MPa/s
D
is
pl
ac
em
en
t
(m
m
)
Pressure (MPa)
Fig.5: Computed displacement normal to shell surface in terms of the test pressure for four loading rates (Elevation + 6.800 m.
•
p= 7 MPa/s p• = 1.75 MPa/s p• = 0.875 MPa/s p• = 0.5 MPa/s
Fig.6: Steel reinforcements tension and rupture configuration for different loading rates.
Fig.7: Reduced model of DEM panel, Concrete elements, steel rebar and tensor.
0.0 0.1 0.2 0.3 0.4 0.5 0.6
0 10 20 30 40 50 60 70
Lower Bound Upper Bound Explicit Tendon
D
is
p
la
c
e
m
e
n
t
(m
m
)
Pressure (MPa)
Fig.8: Pressure-displacement curve and details for the reduced model.
DETERMINATION OF LOAD CARRYING CAPACITY
Four simulations were performed for each case (i.e. with the lower and upper bounds of the equivalent pressure associated to the lower and upper bounds of the yield strength of the prestressing tendons), in accordance with the previous discussion, assuming the specific fracture energy of concrete was a 3D random field with Weibull probability distribution and the mechanical properties summarized in Table 1. Figure 9 shows the steel rebars rupture distribution (indicating also the stress distribution) as well as the final fracture configuration of the concrete panel, after the containment cylinder presents a big opening, that is, total collapse. Localization of deformations in some of the generated cracks continuosly grows during the rupture process, leading finally to the steel reinforcement breaking. The pattern of concrete cracking shown corresponds to the upper layer.
The predicted bounds for the displacement vs. internal pressure curves are shown in Figure 10. The variability induced by the random properties of concrete is very low, the coefficients of variation of curve parameters are of the order of 1%, so the curves for the four simulations are almost identical and hence only one curve was plotted. The Figure also indicates the points when yielding of the steel reinforcemenet begins and when the first rebar breaks. These points correspond in the lower bound model to a pressure of 0.448 MPa and to a pressure of 0.512 MPa in the upper bound model. These values may be regarded as lower and upper bounds of the ultimate pressure for the BARCOM Test Model, presently under consideration. Note finally that although the different simulations led to practically the same value of the ultimate pressure, the failure modes did differ in the four simulations, tending in the lower bound case to consist of a longitudinal tensile crack in the center of the panel,
0.00 0.05 0.10
-5 -4 -3 -2 -1 0
Pressure (MPa)
0.40 0.45 0.50 0.55 0.60
while in the upper bound case the crack displaces to the edges of the panel, suggesting the influence of bending stresses.
Lower bound Upper Bound
DEM-1 DEM-2 DEM-3 DEM-4 DEM-1 DEM-2 DEM-3 DEM-4
Fig.9: Steel reinforcements and concrete rupture configurations for four simulations of concrete properties, lower (left) and upper (right) bound solutions as described in text..
0.00 0.05 0.10 0.15 0.20 0.25 0.30 0.35 0.40 0.45 0.50 0.55 0
10 20 30 40 50 60 70
Inner Pressure (MPa)
D
is
p
la
c
e
m
e
n
t
(m
m
)
Displacement Lower Bound Upper Bound
-4.0x10⁴
0.0 4.0x10⁴
8.0x10⁴
1.2x10⁵
1.6x10⁵ 2.0x10⁵
2.4x10⁵
Pu = 0.512 MPa Pu = 0.448 MPa
E
n
e
rg
y
(N
/m
)
Damage Energy Lower Bound Upper Bound
CONCLUSIONS
The response of the BARCOM Test Model up to failure was predicted employing the Discrete Element Method (DEM) to model one panel of the structure, in which random material properties, large displacements, fracture of concrete and steel yielding were considered. This fully non-linear panel was inserted in a conventional FEM model of the full structure to perform the numerical integration, since a similar analysis of the complete structure would not be feasible on account of computer requirements. On the basis of the model described in the paper, the ultimate pressure is predicted to slighly exceed the midpoint between the lower and upper bounds given above, i.e. around 0.49 Mpa. However, leakage may occur before the predicted collapse occurs, because above 0.42Mpa through the shell cracks were detected.
ACKNOWLEDGEMENTS
The support of CNPq and CAPES (Brazil) is greatfully acknowledged.
REFERENCES
[1] Dameron, R.A., et al. 2002. Posttest Analysis of the NUPEC/Sandia 1:4 Scale Prestressed Concrete Containment Vessel. NUREG/CR-6809, SAND2003-0839P, Albuquerque, NM: Sandia National Laboratories. (http://www.nrc.gov/reading-rm/doc-collections/nuregs/contract/cr6810/).
[2] Nayfeh, A.H., and Hefzy, M.S., “Continuum modeling of three-dimensional truss-like space structures”, AIAA Journal, vol 16(8), 1978, pp. 779-787.
[3] Iturrioz, I., “Aplicação do método dos elementos discretos ao estudo de estruturas laminares de concreto armado” Ph.D. thesis, CPGEC, Universidade Federal do Rio Grande do Sul, Porto Alegre, Brazil. 1995. [4] Riera, J.D., Iturrioz, I., “Discrete elements model for evaluating impact and impulsive response of
reinforced concrete plates and shells subjected to impulsive loading”, Nuclear Engineering and Design, vol 179, 1998, pp. 135-144.
[5] Dalguer, L.A., Irikura, K., Riera, J.D., Chiu, H.C., “The importance of the dynamic source effects on strong ground motion during the 1999 Chi-Chi, Taiwan, earthquake: Brief interpretation of the damage distribution on buildings”, Bull. Seismol. Soc. Am., vol. 91, 2001, pp. 1112-1127.
[6] Rios, R.D., “Aplicações do método dos elementos discretos em estruturas de concreto”, Ph.D. thesis, PPGEC, Universidade Federal do Rio Grande do Sul, Porto Alegre, Brazil. 2002.
[7] Miguel, L.F.F., Riera, J.D., Iturrioz, I., “Influence of size on the constitutive equations of concrete or rock dowels”, International Journal for Numerical and Analytical Methods in Geomechanics, vol. 32, No. 15, 2008, pp. 1857-188. doi: 10.1002/nag.699.
[8] Dalguer, L.A., Irikura, K., Riera, J.D., “Simulation of tensile crack generation by three-dimensional dynamic shear rupture propagation during an earthquake”, J. Geophys. Res., vol. 108(B3), 2003. pp 2144. [9] Riera, J.D., Miguel, L.F.F., Dalguer, L.A., “On the constitutive criteria for the fault: Influence of size and
tensile cracks generation during rupture”, Paper presented at SMiRT 18: International Conference on Structural Mechanics in Reactor Technology, Beijing, China, 2005.
[10] Miguel, L.F.F., “Critério constitutivo para o deslizamento com atrito ao longo da falha sísmica”, Ph.D. thesis, 229 pp., PPGEC, Escola de Engenharia, Universidade Federal do Rio Grande do Sul, Porto Alegre, Brazil. 2005.
[11] Miguel, L.F.F., Riera, J.D., Dalguer, L.A., “Macro constitutive law for rupture dynamics derived from micro constitutive law measured in laboratory”, Geophys. Res. Lett., vol 33, 2006, L03302, doi: 10.1029/2005GL024912.
[12] Miguel, L.F.F., Riera, J.D., “A constitutive criterion for the fault: modified velocity-weakening law”, Bull. Seismol. Soc. Am., vol 97(3), 2007, pp. 915-925, doi: 10.1785/0120060107.
[13] Hillerborg, A., “A model for fracture analysis”, Cod. LUTVDG/TVBM 300-51-8. 1971.