Spatial and Temporal Changes in Land Use and Water Quality in Endangered Cape Fear Shiner Habitats
by
Stacie Reckling
Submitted to the Graduate Faculty of North Carolina State University
In partial fulfillment of the Requirements for the Degree of Master of Environmental Assessment
Raleigh, North Carolina
2019
Approved by advisory committee:
Tamara Pandolfo, Chair
2
Abstract
Reckling, Stacie. Master of Environmental Assessment. Spatial and Temporal Changes in Land Use and Water Quality in Endangered Cape Fear Shiner Habitats.
The Cape Fear shiner (Notropis mekistocholas) is an endangered minnow species endemic to the Cape Fear watershed. The future existence of the shiner is threatened largely by degraded water quality and population fragmentation by dams. An important factor that can affect the quality of a surface water body is the land use within its watershed. Using a geographic information system (GIS), we created a unique watershed which drained to Cape Fear shiner habitats and we analyzed how anthropogenic land use in the watershed had changed between 1974 and 2012. We also obtained water quality data collected during the same time period at five North Carolina Department of Environmental Quality (NCDEQ) monitoring stations located in Cape Fear shiner habitats. Measurements of several common water quality indicators including specific conductance, temperature, pH, dissolved oxygen, fecal coliform and total phosphorus were aggregated and analyzed for changes over time. Between 1974 and 2012, the greatest shifts in land use occurred for land classified as “low usage” which decreased by 16.9% and land classified as “semi-developed” or “developed” which gained 14.8% and 2.5%
3
Table of Contents
1 Introduction ... 4
2 Study area ... 5
3 Data preparation and methodology ... 6
3.1 Watershed delineation ... 6
3.2 Land use mapping and change detection ... 6
3.3 Water quality analysis ... 6
3.3.1 Selection of water quality monitoring stations ... 6
3.3.2 Regional Kendall test on water quality data ... 7
4 Results ... 8
4.1 Land use change ... 8
4.2 Regional Kendall water quality trends ... 9
4.3 Water quality at monitoring stations ... 10
4
1 Introduction
Rich species diversity helps stabilize ecosystems under stress from changing environmental conditions. Human demands on freshwater ecosystems are increasing and could lead to the extinction or imperilment of plant and animal species (Strayer and Dudgeon 2010). In the past three decades, many native freshwater fish populations in the southern United States have become threatened or endangered including the Cape Fear shiner (Notropis mekistocholas) (Warren et al. 2000). The Cape Fear shiner is a small minnow species endemic to the Haw River, the Rocky River and the Deep River located in the Cape Fear watershed of North Carolina (USFWS 2005). In 1987, the Cape Fear shiner was added to the endangered species list and three areas in the Rocky River and the Deep River were designated as critical habitat (Federal Register 1987).
The Cape Fear shiners’ decline in abundance and range are mainly attributed to habitat
fragmentation by dams, and habitat degradation caused by human development (USFWS 2017) (Hewitt et al. 2006). Fragmentation by dams can reduce genetic diversity in small populations which may negatively affect their ability to respond to environmental disturbances (Cooper 2017). However, genetic variation among studied populations of Cape Fear shiners remains relatively high and several impoundments have been removed (Saillant et al. 2004). The demolition of the Carbonton Dam in 2005 allowed mixing of isolated populations of shiners in the Deep River (USFW 2005). The Hoosier Dam, which once isolated populations of Cape Fear shiners in the Rocky River, was removed in November 2018allowing shiners access to high-quality reaches and isolated populations (Ward et al. 2018). The High Falls Dam, an
impoundment separating populations of Cape Fear shiners in the Deep River, is also being considered for removal (Baxley 2018).
The influence of anthropogenic land use change on the decline of Cape Fear shiner populations has yet to be evaluated. Transformation of land within a watershed can alter the geomorphic processes that maintain freshwater ecosystems resulting in degraded water quality. North Carolina has one of the highest rates of population growth in the U.S. Much of this growth is occurring in the North Carolina Piedmont where Cape Fear shiner critical habitat areas exist (US Census Bureau 2016). Areas which undergo heavy population growth often have increased transformation of land from undeveloped or natural to developed (Shukla et al. 2018). Urbanization in a catchment can increase the amount of impervious surface and intensify the flow of polluted runoff into receiving waters (Allan 2004). Cape Fear shiners have exhibited decreased growth and survival when exposed to various pollutants including organic pesticides, polycyclic aromatic hydrocarbons and metals (Hewitt et al. 2006). These pollutants enter surface-water bodies as runoff, thereby linking land use of the catchment with surface water quality (Allan 2004).
5
shiner critical habitat. Current and historical water quality data collected by the NCDEQ monitoring stations can be aggregated and used to characterize changes in water quality over time. In this study GIS and historic water quality datasets were analyzed to determine whether changes in anthropogenic land use can be correlated to changes in water quality within a watershed that contains Cape Fear shiner habitat.
2 Study area
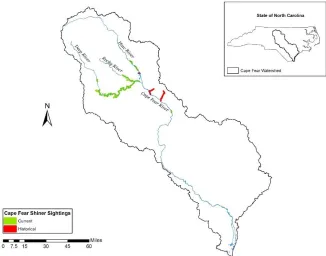
The Cape Fear River Basin is located in the Piedmont region of North Carolina, USA. It is the most inhabited basin in the state encompassing approximately one fourth of the state’s population (Shea et al. 2006). It originates in the headwaters of the Haw River and the Deep River, passes through the Triad and Triangle regions, and then flows southeast to meet the Atlantic Ocean in Wilmington, North Carolina. The Cape Fear shiner inhabits waters in the upper Cape Fear River Basin including tributaries and main streams of the Deep, Haw, Rocky, and Cape Fear rivers in Chatham, Harnett, Lee, Moore and Randolph counties (USFWS 2005; NCNHP 2018) (Fig 1).
6
3 Data preparation and methodology 3.1 Watershed delineation
In ArcMap version 10.5, we used Arc Hydro tools to define a watershed that drains to Cape Fear shiner river habitats. Terrain processing was performed on a digital elevation model (DEM) that had been clipped to the extent of the upper Cape Fear River Basin (USGS 2012). A unique watershed polygon was created to exemplify land draining to shiner habitats by choosing a point on the delineated stream network that was slightly downstream of the confluence of the Haw and Deep rivers.
3.2 Land use mapping and change detection
A dataset completed as a part of the United States Geological Survey (USGS) National Water-Quality Assessment (NAWQA) Program and designated the NAWQA Wall-to-Wall
Anthropogenic Land Use Trends (NWALT) was used to determine changes in anthropogenic land use over time (Falcone 2015). NWALT includes five 60-meter geospatial rasters which show nineteen anthropogenic land use classes for five time periods: 1974, 1982, 1992, 2002, and 2012. In ArcMap version 10.5, we masked the rasters to the Cape Fear shiner watershed polygon, converted the rasters into polygons and merged the polygons by land use classes. We determined the total change in area for each land use class using the field calculator tool in ArcMap and calculated the percent change by decade. We identified the decade where the greatest total percent change in anthropogenic land use had occurred.
3.3 Water quality analysis
3.3.1 Selection of water quality monitoring stations
NCDEQ manages several water quality monitoring coalitions which collect surface water samples from 270 stations monthly in order to assess a variety of physical, chemical and
biological parameters. Since several NCDEQ monitoring coalition stations are located along the Haw, Rocky and Deep rivers, we used these existing water quality datasets to determine trends in water quality within the watershed. We used an NCDEQ monitoring coalition stations
7
Figure 2. Location of NCDEQ monitoring stations and Cape Fear shiner sightings within the delineated watershed.
3.3.2 Regional Kendall test on water quality data
8
4 Results
4.1 Land use change
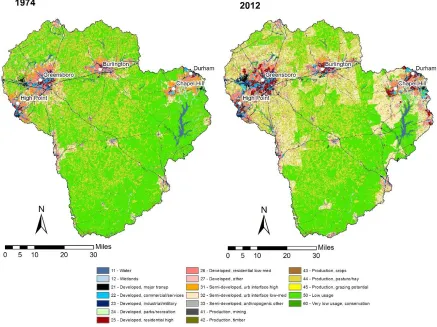
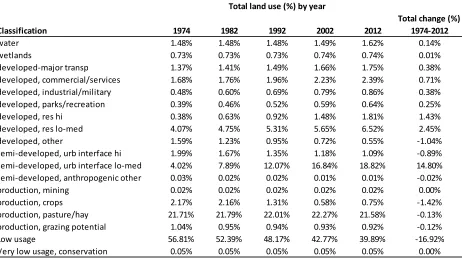
Analysis of anthropogenic land use within the watershed draining to known Cape Fear shiner locations has shown an increase in development between the years 1974 and 2012 (Fig 3). Land classified as “low usage” decreased by 17% or 341,895 acres while land classified as “semi-developed, urban interface lo-med” increased by 15% or 298,976 acres. Additionally, land classified as “developed” increased by 4.6% or 92,047 acres (Table 1). Shifts in land use from “low usage” to “semi-developed” or “developed” appear to occur in close proximity to urban areas including the cities of Greensboro, Burlington, High Point, and Chapel Hill (Fig 3). Land used for production purposes lost 1.7% or 33,711 acres over the four decades (Table 1). All other land use classifications experienced losses or gains of less than 1% between decades and thus, were considered minor changes at the watershed scale. The greatest total percent change in land use occurred between 1992 and 2002 and therefore, water quality data
collected from January 1, 1992 to December 30, 2002 were used to represent changes in water quality over time within the watershed (Table 1).
9
Table 1. Classification of total land use (%) and total change (%) between 1974 and 2012.
4.2 Regional Kendall water quality trends
The Regional Kendall test reported that several statistically significant water quality trends occurred between 1992 and 2002 in the study area. Specific conductance exhibited an increasing regional trend at a rate of 6 µmhos/cm per year (p = 0.005). Fecal coliform levels demonstrated a decreasing trend at a rate of 3.75/100 mL per year (p = 0.003). Temperature, pH, DO, and phosphorus did not exhibit statistically significant regional trends.
Classification 1974 1982 1992 2002 2012
Total change (%) 1974-2012
water 1.48% 1.48% 1.48% 1.49% 1.62% 0.14%
wetlands 0.73% 0.73% 0.73% 0.74% 0.74% 0.01%
developed-major transp 1.37% 1.41% 1.49% 1.66% 1.75% 0.38%
developed, commercial/services 1.68% 1.76% 1.96% 2.23% 2.39% 0.71%
developed, industrial/military 0.48% 0.60% 0.69% 0.79% 0.86% 0.38%
developed, parks/recreation 0.39% 0.46% 0.52% 0.59% 0.64% 0.25%
developed, res hi 0.38% 0.63% 0.92% 1.48% 1.81% 1.43%
developed, res lo-med 4.07% 4.75% 5.31% 5.65% 6.52% 2.45%
developed, other 1.59% 1.23% 0.95% 0.72% 0.55% -1.04%
semi-developed, urb interface hi 1.99% 1.67% 1.35% 1.18% 1.09% -0.89%
semi-developed, urb interface lo-med 4.02% 7.89% 12.07% 16.84% 18.82% 14.80%
semi-developed, anthropogenic other 0.03% 0.02% 0.02% 0.01% 0.01% -0.02%
production, mining 0.02% 0.02% 0.02% 0.02% 0.02% 0.00%
production, crops 2.17% 2.16% 1.31% 0.58% 0.75% -1.42%
production, pasture/hay 21.71% 21.79% 22.01% 22.27% 21.58% -0.13%
production, grazing potential 1.04% 0.95% 0.94% 0.93% 0.92% -0.12%
Low usage 56.81% 52.39% 48.17% 42.77% 39.89% -16.92%
Very low usage, conservation 0.05% 0.05% 0.05% 0.05% 0.05% 0.00%
10
4.3 Water quality at monitoring stations
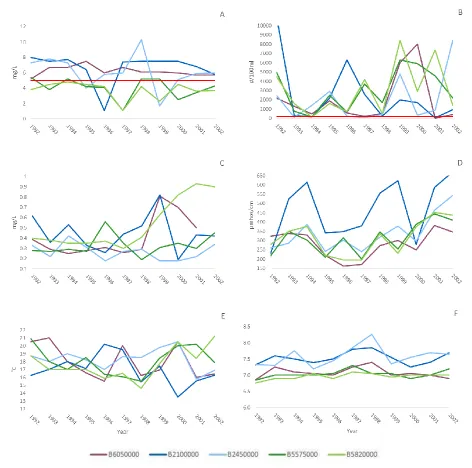
Evaluating indicators of water quality at individual stations between the years 1992 and 2002 provided additional insight into spatial and temporal fluctuations in water quality surrounding Cape Fear shiner sightings. We analyzed minimum monthly DO measurements and compared them to the North Carolina quality standard for Class C waters (≥5 mg/L) (NCDEQ 2005). We also analyzed and compared maximum monthly fecal coliform levels to North Carolina’s Class C surface water standard (≤200 organisms/100 mL) (NCDEQ 2005). Since the state of North Carolina has not set standards for specific conductance or total phosphorus, maximum monthly measurements for these parameters were assessed for changes over time. Median annual pH and median annual temperature were calculated and evaluated for changes over time.
Dissolved oxygen Minimum monthly DO levels were at or below the DO water quality standard
for Class C waters (≥5 mg/L) at Deep River stations B5820000 and B5575000 in all years (Fig 4A). Minimum monthly DO for Haw River station B2100000 fell below 5 mg/L in 1996. Haw River station B2450000 DO levels fell below 5 mg/L in 1995 and 1999. Station B6050000 exhibited minimum monthly DO readings consistently above the water quality standard.
Fecal coliform Maximum monthly fecal coliform measurements exceeded North Carolina’s
Class C surface water standards (≤200 organisms/100 mL) at all stations in 1992, 1995, 1999, 2000, and 2002 (Fig 4B; NCDEQ 2005). Maximum monthly levels were between ten and forty times greater than the set water standard.
Total phosphorus Maximum monthly total phosphorus measurements varied at each
monitoring station over time (Fig 4C). Maximum total phosphorus levels at stations B5575000, B5820000, and B6050000 increased over time while levels at stations B2100000 and B2450000 decreased over time (data not shown).
Specific conductance Maximum monthly levels of specific conductance increased over time for
all stations (Fig 4D). Maximum monthly specific conductance was higher at Haw River station B2100000 than the other stations for nine out of eleven years.
Temperature Median annual water temperatures varied at each monitoring station over time
(Fig 4E).
11
Figure 4. Minimum monthly DO (A), maximum monthly fecal coliform (B), and maximum monthly total phosphorus (C), maximum monthly specific conductance (D), median annual temperature (E), and median annual pH (F) measurements at NCDEQ stations from 1992 to 2002. Red lines indicate North Carolina’s Class C surface water standards.
5 Discussion
12
buildings or parking lots, the environment is less capable of absorbing and diffusing any contaminants present in surface runoff. Specific conductance is an indirect measure of the presence of dissolved solids in water, and can be used as an indicator of water pollution
(Morgan et al. 2012). Therefore, increasing regional trends in specific conductance in the study area suggest that greater amounts of contaminated runoff from impervious surfaces are
flowing into the rivers. Increasing quantities of polluted runoff entering these rivers could negatively impact the success of Cape Fear shiner populations as demonstrated by past in-situ experiments (Hewitt et al. 2006). Runoff can absorb heat as it passes over impervious surfaces which can also increase the temperature of receiving waters (U.S. EPA 2017). Sporadic inputs of warm runoff may explain the highly variable temperatures observed for all of the river monitoring stations. It is unknown whether Cape Fear shiners are sensitive to temperature fluctuations like those observed in this study.
Development of land typically coincides with population growth. An increasing human
population requires more water and creates greater quantities of waste water to be discharged into surface waters. Wastewater treatment plant (WWTP) effluent can affect nutrient loads, fecal coliform levels and specific conductance in receiving waterbodies (U.S. EPA 2017). Since phosphorus is often the limiting nutrient in aquatic systems, even a small addition of
phosphorus can result in algae blooms, or aquatic plant overgrowth (Ouattara et al. 2014). Microbial decomposition of plant overgrowth can create environments with low DO levels which could impact the health of the Cape Fear shiner (Ouattara et al. 2014). According to the Cape Fear River Basinwide Water Quality Plan, no new nitrogen or phosphorus producing facilities were permitted in the Haw River watershed in order to maintain existing nitrogen and phosphorus loads (NCDEQ 2005). The Deep River watershed lacks a similar plan to limit
nutrient inputs. This may be contributing to the incidence of higher maximum monthly
phosphorus levels and minimum monthly DO levels below the state standard identified at Deep River monitoring stations. Likewise, fecal coliform bacteria can be found in WWTP effluent and indicate the possible presence of other pathogenic organisms. Although we identified a
statistically significant downward regional trend in fecal coliform levels between 1992 and 2002, maximum monthly fecal coliform readings were considerably higher than the NC state standard of ≤200 organisms/100 mL (NCDEQ 2005). Although it is understood that land used for animal operations can contribute to increases in fecal coliform in surface waters, land used for production in the delineated watershed has decreased (Allan 2004). This suggests that at times, the quantity or quality of effluent from waste water treatment plants could negatively impact water quality and biota in this watershed. As previously discussed, specific conductance has increased in the study area over time. In addition to storm water runoff, contaminants in WWTP effluent may be influencing specific conductance measurements.
13
fecal coliform measurements greatly exceeded NC state standards which suggests periods of sanitary sewer overflow (U.S. EPA 2017). Contaminants in untreated sewage could negatively impact shiner health. Cape Fear shiners may be able to overcome stressors linked with land development because the removal of several dams has allowed them to access additional river habitats. However it is doubtful that changes in land use are the only contributor to changes in water quality in the Haw, Rocky, and Deep rivers. An additional GIS analysis could help to determine if other factors like climate change, population density, or destruction of riparian buffers are impacting water quality. The survival and recovery of endangered species like the Cape Fear shiner will depend on closely monitoring and protecting their river habitats and the land surrounding them.
References
Allan, J. 2004. Landscapes and Riverscapes: The Influence of Land Use on Stream Ecosystems. Annu Rev Ecol Evol Syst. 35:257-284
Baxley, J. 2018. High Falls Dilemma: Save the Fish or Save the Dam? The Pilot. https://www.thepilot.com/news/high-falls-dilemma-save-the-fish-or-save-the-dam/article_0f16dff0-b051-11e8-9a93-0b3375f4675d.html. Accessed 2019 March 3.
Cooper, AR, Infante, DM, Daniel, WM , Wehrly, KE , Lizhu Wang, L, and Brenden, TO. 2017. Assessment of dam effects on streams and fish assemblages of the conterminous USA. Sci Tot Environ. 586:879-889.
Falcone, J.A. 2015. U.S. conterminous wall-to-wall anthropogenic land use trends (NWALT). 1974–2012: U.S. Geological Survey Data Series 948, 33 p. plus appendixes 3–6 as separate files. http://dx.doi.org/10.3133/ds948. Accessed 2018 July 7.
Federal Register (1987) Federal Register, 52, no. 186. September 25. Office of the Federal Register, Washington DC.
Helsel, DR, Mueller, DK, and Slack, JR. 2006. Computer program for the Kendall family of trend tests: U.S. Geological Survey Scientific Investigations Report. 2005–5275, 4 p.
Hewitt, AH, Cope, WG, Kwak, TJ, Augspurger, T, Lazaro, PR, and Shea, D. 2006. Influence of water quality and associated contaminants on survival and growth of the endangered cape fear shiner (Notropis mekistocholas). Environ Tox and Chem. 25:2288-2298.
14
North Carolina Division of Water Quality. 2005. Cape Fear River Basinwide Water-Quality Management Plan. North Carolina Department of Environment and Natural Resources, Raleigh, NC, USA. https://deq.nc.gov/about/divisions/water-resources/planning/basin-planning/water-resource-plans/cape-fear-2005. Accessed 2019 April 7.
North Carolina Natural Heritage Program. 2018. Biotics Database. Division of Land and Water Stewardship, Department of Natural and Cultural Resources, Raleigh, North Carolina.
https://ncnhde.natureserve.org/content/data-download. Accessed 2018 June 28.
Ouattara, N, Garcia-Armisen, T, Anzil, A, Brion, N and Servais, P. 2014. Impact of Wastewater Release on the Faecal Contamination of a Small Urban River: The Zenne River in Brussels (Belgium). Water Air Soil Pollut. 225:2043.
Read, EK, Carr, L, De Cicco, L, Dugan, HA, Hanson, PC, Hart, JA, Kreft, J, Read, JS and Winslow, LA. 2017. Water quality data for national-scale aquatic research: The Water Quality Portal. Water Resour Res. 53:1735–1745.
Saillant, E, Patton, JC, Ross, KE, and Gold, JR. 2004. Conservation genetics and demographic history of the endangered Cape Fear shiner (Notropis mekistocholas). Mol Ecol. 13:2947-2958.
Serrano, L, Wells, E, McRae, S, and Ward, S. 2018. North Carolina dam removal helps Rocky River and the endangered fish that lives there. USFWS.
https://www.fws.gov/southeast/articles/north-carolina-dam-removal-helps-rocky-river-and-the-endangered-fish-that-lives-there/. Accessed 2019 Mar 6.
Shukla, AK, Chandra Shekhar, PO, Mijic, A, Buytaert, W, Pathak, S, Garg, RD, & Shukla, S. 2018. Population growth, land use and land cover transformations, and water quality nexus in the Upper Ganga River basin. Hydrology and Earth System Sciences. 22(9):4745-4770.
Strayer, DL and Dudgeon, D. 2010. Freshwater biodiversity and conservation: recent progress and future challenges. J N Am Benthol Soc. 29(1):344-358.
U.S. EPA (Environmental Protection Agency). 2017. Causal Analysis/Diagnosis Decision Information System (CADDIS): https://www.epa.gov/caddis-vol2/caddis-volume-2-sources-stressors-responses-urbanization-wastewater-inputs. Accessed 2019 April 24.
U.S. Fish and Wildlife Service. 2005. Cape Fear shiner Fact Sheet 2. http://www.fws.gov/nc-es/fish/cfshiner.html. Accessed 2018 Oct 8.
15
U.S. Geological Survey. 2012. 3DEP products and services: The National Map, 3D Elevation Program. https://nationalmap.gov/3DEP/3dep_prodserv.html. Accessed 2019 Feb 3.
Vander Borgh, Mark. 2018. NC Monitoring Coalition Stations. NCDEQ.
http://data-ncdenr.opendata.arcgis.com/datasets/dwr-2012-ir-ams-data. Accessed 2019 Jan 3.
Warren, ML, Brooks, MB, Walsh, SJ, Bart, HL, Cashner, RC, Etnier, DA, Freeman, BJ, Kuhajada, BR, Mayden, RL, Robison, HW, Ross, ST, and Starnes, WC. 2000. Diversity, distribution, and conservation status of the native freshwater fishes of the southern united states. Fisheries. 25:7-31.