E STIM ATION O F LINKAGE BY THE M E T H O D OF
M INI M UM DISCREPANCY
*
V. N. M U R T Y
Central Tobacco Research Institute, Rajahmundry, Andhra State (India)
Received December 31, 1953
T present different methods are in vogue in the field of genetics to cal-
A
culate linkage intensities from F2 data. During the earlier years EMER-SON’S (1916) adcditive method was very popular but gradually gave way to other methods as it was less efficient statistically, although easier to use. At present FISHER’S ( 1928) product method, maximum likelihood method, and scoring method are in general use. Tables prepared by IMMER (1930) made the product method easier to use, but these were of limited use as they covered only a few common ratios. Maximum likelihood and scoring methods often in- volve heavy computations, and solution of high degree polynomial equations. Tables prepared by the author (in press) reduce computations in the scoring method to a considerable extent.
Thus it will be seen that all the methods in general use suffer from one disadvantage or other, and hence the necessity of a simpler yet statistically efficient method satisfying various criteria arises. In order to be most useful a formula for calculating intensities should be easy to use, account for differ- ential mortality of gametes or zygotes, and yet be statistically efficient. HALDANE’S (1953) method of minimum discrepancy satisfies all these re- quirements. It has not been utilised so far for calculating linkage intensities from genetic data.
The object of the present paper is to present application of the new method for the calculation of linkage intensities. Tables have been prepared which give formulae for calculating linkage intensity for various genetic ratios.
METHOD O F M I N I M U M DISCREPANCY
During the International Statistical Conference held in India (1951), J. B. S. HALDANE (1953a) discussed efficient methods of estimating a single param- eter from a sample. In particular he showed that if f r ( x ) be the expected fre- quency of the rth class and n, the number of individuals found in it, the mini- misation of [ f r(x )I2 /( n,
+
1 ) gave an efficient estimate, and was some times simpler than the method of maximum likelihood. H e called this the method of minimum discrepancy.* P a r t of the cost of the accompanying mathematical formulae and tables has been
paid by the GALTON and MENDEL MEMORIAL FUND.
582 V. N. MURTY
E X A M P L E S
1. Case involving covvzpleinentary factors
Consider the estimation of linkage for the data in table 1. The probabilities of the four classes are :
3 1
- 4 2
-
P ) - ( 1 + 3 P )3 3
16 16 16 16
-(2 + - P ) -(1- P )
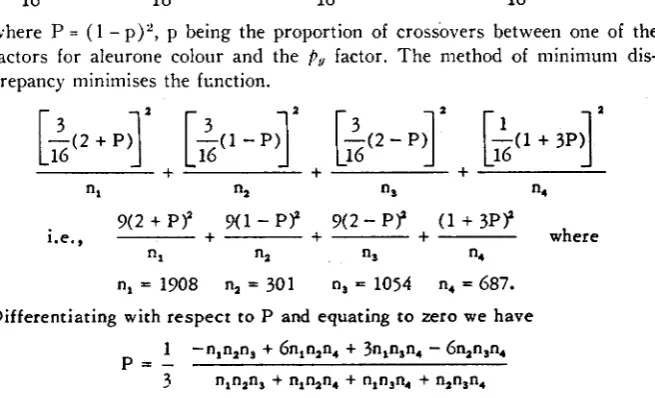
where P = ( 1 - p)', p being the proportion of crossovers between one of the factors for aleurone colour and the fig factor. The method of minimum dis- c repancy minimises the fcnction.
"1 n2 n3 n4
9(2 + PIa 9 ( 1
-
P? 9 0-
P? ( 1 + 3P)l"1 n2 n3 n4
nl = 1908 nz = 301 n5 = 1054 n4 = 687.
w h e r e
i.e.,
+
+
+
D i f f e r e n t i a t i n g with r e s p e c t t o P and e q u a t i n g t o zero w e have
1
p = -
3
-n,n,n,
+
6nlnan,+
3nln3n4-
6n1n3n4 nlnzn,+
nlnzn4+
n1n3n4+
nzn3n4Substitution of the values of nl, n2, 113, n4 gives P = 0.5897 ; 1 -
fl=
0.2321, i.e., 23.21 percent recombination.J. B. HUTCHINSON (1929) for the above data had to solve an equation of the third degree by HORNER'S process and obtained P = 0.5902; 1 -
dF=
0.2318, i.e., 23.18 percent recombination,
TABLE 1
Observed segregation /or aleurone color (9: 7) and pale green
seedlings (3 : 1 ) in m a i z e (Brunson's F, data).
CR (Cr + c R
+
cr) Seedling totalPgl 1907 1053
PS 1 300 686
Aleurone total . 2207 1739
2960 986
n = 3946
TABLE 2
Comparison of maximum likxlihood and minimum discrepancy methods.
CRPgl CRpg1 (CT
+
CR+
ct)Pg1 (CT+
CR+
cr)Pg,X 2
Observed 1907 300 1053 686
Expected M:D: M L 1916.42 303.20 1043.08 683.30 0.185
1043.45 682.93 0.186
E S T I M A T I O N OF L I N K A G E 583
2. Case involving duplicate factors
Consider the estimate of linkage for the data in table 3. The probabilities of the four classes a re:
V ( / D
+
Id+
i D ) u(lD+
Id+
i D ) Vi d u id11+P
16
P
16 16 16
-
- -
4 - P 1-P
Since the observed frequency in the double recessive class is zero, the method of minimum discrepancy requires a slight modification. Here we minimise the function,
( 1 1 + P Y ( 4 - P Y (1-PY P2
+
-
+
-
+ -
where nl, n2, n3, n4"1 "2 "3 n4
are the observed frequencies in the four c l a s s e s . Minimisation g i v e s
nln2n4
+
4n1n,n4-
lln2n3n4n1n2n3
+ nln2n4,+ n,n3n4
+ n2n3n4
P =
Since n4 = 0 ; P = 0, i.e., complete linkage with repulsion. The method of
maximum likelihood also gave the same value.
I t will be clearly seen from the above examples that the new method gives estimates which are very close to those of maximum likelihood and is simpler to use.
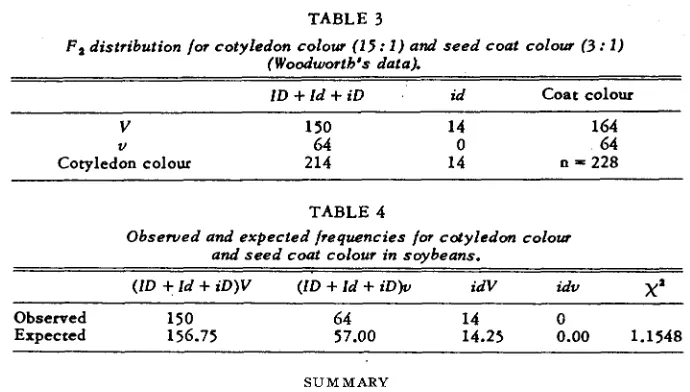
TABLE 3
F 2 distribution for cotyledon colour (15: 1 ) and s e e d coat colour ( 3 : I )
(Woodworth 's d a t a l
I D + I d + i D id Coat colour
V 150 14 164
V 64 0 64
Cotyledon colour 214 14 n = 228
TABLE 4
Obserued and e x p e c t e d frequencies for cotyledon colour and s e e d coat colour in soybeans.
(ID
+
Id+
iD)V (ID+
Id+
iD)v idV idvX
'
~
Observed 150 64 14 0
Expected 156.75 57.00 14.25 0.00 1.1548
S U M M A R Y
HALDANE'S method of minimum discrepancy has been shown to be a statis-
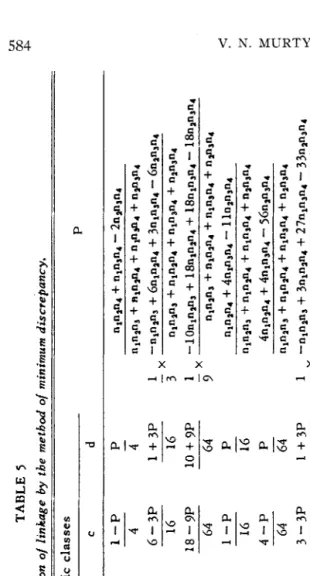
TABLE 5 Formulae for the estimation of linkage by the method of minimum discrepancy. Phenotypic classes No. Phenotypic ratios P a b C d
wl 00 P
1. 2. 3. 4. 5. 6. 7. 8. 9. 10. 11.
3:l 9:7 7:7 15:l 15:l
15:l 63
:
1
27
:
37
3:l 3:l 7:
7
3:l 3:l 9:7 3:l
15:l 9:7 3:l 3:l 81
: 175 243 : 781 27 : 37
2+P 4 6
+
3P 16 18
+
9P 64 11+P 16
56
+
P 64 33+
3P 6447+P 64 18
+
9P 64 54+
27P 256 162+
81P- 1024 54
+
27P
256
1-P 4 3
-
3p 16 18
-
9P 644-P 16 4-P 64 27
-
3P
64 64
7
-
7P 64 138-
27P 256 606-
81P 1024 70-
27P 2 56-
16-
P
1
-P 4
6-3P 16 18
-
9P
64
1-P 16 4-P 64 3-3P 64 1-P 64
30
-
7P 64 27-
27P 256 81-
81P- -
-
- 1024 54-
27P
256
P 4
1
+3P 16
10
+
9P
64 P 16 P 64
1
+3P 64 P 64
7
+
7P 64 37+
27P 256 175+
81P 1024 58+
27P 256-
-
- - npln4+
n,n,n4-
2np3n4 "ln1"3 + -npln3+
6nlnan4+
3n,n,n4-
6n,n,n4 nln2n3+
nln2n4+
n,n3n4+
nan3n4 -lOnln,n,+
18nln,n4+
18n,n3n4- 18np3n4 nlnan3+
npp4+
nln3n4+
np,n4 + npfl4+
np~41 -x 3 1 -x 7
nln,n4
+
4nln3n4-
1 ln,n,n4 nln,n,+
n1np4+
nln3n4+
nan3n4 4n,n,n4+
4n,n3n4-
56n,n3n4 n,n2n3+
n,n2n4+
n1n3n4+
nan3n4 -n,np,+
3nln,n4+
27n,n3n4-
33np3n4 nlnp3+
nlnp4+
nln3n4+
np3n41 -x 3
ninp4
+
16n,n,n4-
47n,n,n4 nlnp3+
n1np4+
nln3n4+
n,n3n4 -7n1np3+
30nln,n4+
9n1n3n4-
18n,n,n4 nlnp3+
nln2n4+
nln3n4+
n2n3n4 -37n1np,+
27n,n,n4+
138nln,n4-
54n,n3n4 nlnln3+
n1np4+
nln3n4+
n,n3n4 -175n,n,nn,+
81n,np4+
606n,n,n4-
162n,n3n4 nlnp3+
nln,n4+
n1n3n4+
n2n3n41 -x 7 1 -x 27 1 -x 81 - 1
-58n,n2n3
+
54n,n,n4+
70nln,n4-
54n,n3n4 27 n1np3+
nlnp4+
nln3n4+
n2n3n4Phenotypic classes No. Phenotypic ratios P a b C d
12. 13. 14. 15. 16. 17. 18. 19. 20. 21. 22.
A B,C 3:l x 3:13 If A is linked with B If A is linked with C A,B,C D 45:19 X 3:l If C is linked with D If A or B is linked with D 9: 7 15:l 9:7 63 :.l 27:37 15:l 27:37 63:l 81:175 3:l 27:37 27:37 81:175 9:7 2
+P 16
-
3-
3P 16 30
+
15P 64 33+
3P 64 33+
3P 64 141 +3P 256 99+
9P 256 423+
9P1024 54
+
27P 256 162
+
81P 1024 162+
81P 1024 10-P 16
9
+
3P 16 15-
15P 64 12-3P 64
3
-
3P
64
3-3P 2
56 141
-
9P 256 585-
9P 1024 138-
27P 256 270-
81P 1024 414-
81P 1-P 16
-
3p 16 I8-
15P 64
-
15-3P 64 27-
3P 64 111-
3P256 9-9P 256 9
-
9P 1024 27
-
27P 256 270-
81P 1024 162-
81P3+P
-
16 4-3P 16 1+
15P
64
4
+3P 64
1
+
3P 64 1+
3P 2 56 7-
9P 2 56 7+
9P 1024 37+
27P 2 56 322+
81P 1024 286+
81P 1024 1024 1024 -3nlnan3+
nlnan4+
10nln3n4-
2nan3n4 nlnan3+
nlnan4+
nln3n4+
n,n3n41 3
4nlnan3
-
9nln3n4+
3nan3n4 nlnp3+
n1np4+
nln3n4+
nan3n4-x 1
-nlnan3
+
18n1np4+
15n1n3n4-
30nan3n4 M-x 15
nlnan,
+
nlnan4+
nln3n4+
nan3n4v1
=3
-x
2
3 n1np3+
nlnan4+
nln3n4+
nan3n4 0 1 -4nlnan3+
1Snlnan4+
12nln3n4-
33np3n45
1 -x 3 1 -x 3 1 -x 9 1 -x 9 1 -x 27 1 -x 81 1 -x 81
586 V. N. M U R T Y
from Fz data the proportion of recombination between a pair of linked factors each interacting with other independent factors.
ACKNOWLEDGEMENTS
The author is deeply indebted to DR. B.
S.
KADAM, MSc., Ph.D. (Cornell), F.N.I., F.A.Sc., F.B.S., Director, Tobacco Research, for helpful suggestions and keen interest evinced during the preparation of this paper.LITERATURE CITED
EMERSON, R. A., 1916
FISHER, R. A., 1928 Statistical Methods for Research Workers, 2nd Ed. Edinburgh.
Oliver and Boyd.
FISHER, R. A., and BALMUKASD BHAI, 1928 The estimation of linkage from the off-
spring of selfed heterozygotes. J. Genet. 20: 79-92.
HALDANE, J. B. S., 1953a A class of efficient estimates of a parameter. Proc. Int. Stat. Cont. India, 1951.
1953b
HUTCHINSON, J. B., 1929
estimation of linkage. Genetics 14: 519-537.
IMMER, F. R., 1930
MURTY, V. N., 1953
The calculation of linkage intensities. Amer. Nat. 50: 411-420.
The estimation of two parameters from a sample, SankhyH. 12: 313-320.
The application of the method of maximum likelihood to the
Formulae and tables for calculating linkage intensities. Genetics
Calculation of linkage values by Fisher's scoring method. Ind.
15: 81-98.