Spatio-Temporal Analysis of Human Resource
Development in District Headquarters of
Rajasthan
Divya Shukla1, Rajesh Kr Dubey2
Assistant Professor, Home Nursing, St. John Ambulance Association, Ayodhya, U.P., India.1
Director, Prakriti Educational & Research Institute, Lucknow, UP, India.2
ABSTRACT: World’s each and every nation is fighting with the problem of regional imbalances and inequalities. With in the country a wide regional disparity has been experienced in the level of development. Human Resource Development is the process of increasing knowledge, the Skills and the capacities of the people in a society. Human Resources Development (HRD) is a framework for the expansion of human capital within an organization through the development of both the organization and the individual to achieve performance improvement. In 2011 India Ranks a low 134 among 187 countries in terms of HDI. In 2010 India’s ranking was 119 out of 169 countries. India HDI has registered impressive achievements in the last decade as the HDI increased by 21 percent to 0.467 in 2007-08 from 0.387 in 1999-2000. Rajasthan has been chosen as study area, it is the largest state of India accounting 10 percent of India’s geographical area. This state is widely isolated and has so many challenges like harsh climate, desertification, drinking water etc. District Headquarters (DHQs) of the state has been selected for analysis. The main aim of this analysis is to focus on spatio-temporal variation in the levels of Human Resource Development in the DHQ’s of Rajasthan. Eight demographic variables, related to census 2001 and 2011 are selected, to study the Human Resource Development of the DHQ’s. To determine the level of development, composite `Z’ score indices are taken.
KEYWORDS: Spatio-temporal analysis, Human Resource Development, HDI, GNP, BNA, PQLI, Demographic
Variables, ‘Z’ Score.
I. INTRODUCTION
World’s each and every nation is fighting with the problem of regional imbalances and inequalities. With in the country a wide regional disparity has been experienced in the level of development.“The basic objective of Development”,
wrote Mahbub ul Haq in the first Human Development Report in 1990 “is to create an enabling environment in which
people can enjoy long, healthy and creative lives". Human Resource Development is the process of increasing knowledge, the Skills and the capacities of the people in a society. Human Resources Development (HRD) is a framework for the expansion of human capital within an organization through the development of both the organization and the individual to achieve performance improvement. HRD deals with all aspects of human development whether they relate to poverty, gender discrimination, denial of human rights and liberty, impact of globalization and environmental concerns. Human resource development is a continuous process of promoting quality of life for all people of an area. According to Gupta (1998), human resource development is the complete physical and mental growth of individuals. Rao (1999) emphasizes the importance of human resource development and states that it involves getting the right kind of people, creating a culture that nurtures and retains talent, providing avenues for competence development at all levels, ensuring utilization of talent and aiding in the renewal of, various productive human processes. Nadler (1994) defined human resource development as a planned continuous effort by management to improve employee capacity levels and organizational performance through training, education and development programmes. A country needs trained political leaders, lawyers, engineers, doctors, scientists, managers, administrators, craftsmen, teachers, writers, and journalists to spur the general development activity. Elites of various
have studied Human Resource Development at various variables in our country and abroad. D. Kelly (2001) has defined Human Resource Development in his creation, Dual Perceptions of HRD: Issues for Policy: SME’s, Other Constituencies, and the Contested Definitions of Human Resource Development. Another work by same author (2006) makes focus on those steps taken for development of human resource in, Human Resource Development: For Enterprise and Human Development. as and Das (1976) have examined the various features of human resources of India. Kayasth and Singh (1980) have attempted the human resource pattern in Eastern Uttar Pradesh. Singh (1980) presented the levels of human resource in the north eastern regions of India. Mala Dutt (2010) has evaluated HRD in India. B.R.K. Sinha (2012) has presented spatio temporal analysis in his book Rural HRD in India. The first Human Resource Development report in 1990 has accepted Human Development Index (HDI) apart from GNP, BNA (Basic Needs Approach), PQLI (Physical Quality of Life). In 2011 India Ranks a low 134 among 187 countries in terms of HDI. In 2010 India’s ranking was 119 out of 169 countries. India HDI has registered impressive achievements in the last decade as the HDI increased by 21 percent to 0.467 in 2007-08 from 0.387 in 1999-2000. In our country Kerala, Goa and Delhi have highest HDI. The ranking of first three states having high HDI are Kerala rank 1 and HDI is 0.790; Goa has positioned at rank 2 with HDI 0.779 and Delhi is on third rank with 0.750 HDI. Rajasthan has recorded low HDI of 0.434 with Rank 17, which is much below the national average of 0.467. The states of very low HDI are Bihar rank 21 and HDI 0.367 followed by Odisha rank 22 and HDI 0.362, Chhattisgarh last rank 23 with HDI 0.358.
Database and Methodology:The present study is mainly based on secondary data. The data of census 2001 and 2011 are taken for analysis. To determine the level of development, composite `Z’ score indices are taken. Data of different variables have collected from the Census office Jaipur. The DHQs are categorized in four categories based on composite `Z’ score indices. The details of selected variables given below:
1. Family size (V1) 2. Density (V2) 3. Sex Ratio (V3)
4. Total Literacy rate (V4) 5. Male Literacy rate (V5) 6. Female Literacy (V6) 7. Secondary Workers (V7) 8. Tertiary Workers (V8)
Study area: The western most biggest and beautiful state Rajasthan has been chosen as study area. This state exhibits
unique feature in respect of its geology and geomorphology. This state is spread over 342,239kms located between 23°3’ to 30°12’ Northern latitude and 60°30’ to 78°17’ Eastern longitude. The world’s oldest mountain divides the state into two halves. Tropic of cancer passes through the southern tip of this state. The climatic condition of the state is arid and semi arid. This state has challenge of desert and desertification. Rajasthan is an agro centric state.
Aim:The main aim of this analysis is to focus on spatio-temporal variation in the levels of Human Resource Development in the DHQs of Rajasthan. Eight demographic variables, related to census 2001 and 2011 are selected, to study the Human Resource Development of the DHQs.
Levels of Human Resource Development in the DHQs, 2001:In 2001 there were 32 DHQs which are categorized under four groups on the basis of composite `Z’ score index (Table-1). About 45 percent DHQs are less developed and more than 50 percent DHQs are developed.
Least Developed DHQs: Out of 32 DHQ’s five (15.6 percent) DHQs are least developed having composite `Z’ score less than -4.0. These DHQs are Jaisalmer (-7.24), Karauli (-6.85), Dhaulpur (-5.85), Tonk (-4.99) and Jalor (-4.13). Less Developed DHQs: Ten (31.3 percent) DHQs are less developed. These DHQs are Nagaur (-3.15), Pali (-2.35), Bhilwara (-1.38), Sirohi (-0.56), Bharatpur (-0.55), Chittorgarh (-0.54), Sawai Madhopur (-0.39), Hanumangarh (-0.37), Jhunjhunun (-.16) and Barmer (-0.04).
Highly Developed DHQs: DHQs having Composite ‘Z’ score of above 4 has been marked as highly developed DHQs. These DHQs are Ajmer (4.58), Banswara (5.48) and Udaipur (6.63). The category of high magnitude of development is mainly prevails in DHQs of southern part of the state and moderate magnitude of development found in eastern regions , whereas low development has been observed in DHQs of eastern and western parts of the state(Fig.1a).
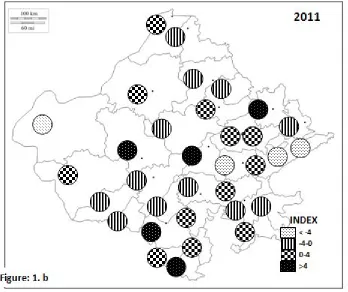
Levels of Human Resource Development in the DHQs, 2011: In 2011 there were 33 DHQs categorized under
four categories on the basis of composite `Z’ score (Table-8.2). In this census 48.5 percent DHQs are less developed and 51.5 percent DHQs are developed.
Table: 1. Levels of HRD in the DHQs, 2001
Category Range No. of
DHQs
Percentage Name of the DHQs
Least Developed Less than -4
05 15.6 Jaisalmer, karauli, Dhaulpur, Tonk, Jalor
Less Developed -4 to 0 10 31.3 Nagaur, Pali, Bhilwara, Sirohi, Bharatpur, Chittorgarh, Sawai Madhopur, Hanumangarh, Jhunjhunun, Barmer
Moderately Developed
0 to 4 14 43.8 Bundi, Churu, Jaipur, Rajsamand, Bikaner, Baran, Dausa, Kota, Dungerpur, Jodhpur, Jhalawar, Ganganagar, Alwar, Sikar
Highly Developed
More than 4
03 9.4 Ajmer, Banswara, Udaipur
Total 32 100
Source: Calculated from PCA 2001, 11. Directorate of census operations, Jaipur
Least Developed DHQs: Out of 33 DHQs four (12.1percent) DHQs are least developed having composite `Z’ score of less than -4.0.The least developed DHQs are Karaouli (-10.74), Jaisalmer (-5.38), Tonk (-4.64) and Dhaulpur (-4.54).
Less Developed DHQs: Table 2 reveals that out of 33 DHQs twelve (36.4 percent) DHQs are less developed. These DHQs are Nagaur (-3.71), Jhujhunun (-3.32), Jalor (-2.81), Sirohi (-2.01), Pali (-1.35), Baran (-1.02), Kota (-0.99), Bhilwara (-0.52), Rajsamand (-0.46), Hanumangarh (-0.37), Bharatpur (-0.27) and Churu (-0.01).
Moderately Developed DHQs: Twelve (36.4 percent) DHQs are categorized in this group. In this category maximum composite ‘Z’ score has been gained by DHQ Dungerpur of 3.85 and minimum of 0.01 in DHQ Jhalawar.
Highly Developed DHQs: Out of 33 DHQs five (15.2 percent) DHQs are highly developed. DHQ Udaipur has
recorded highest Composite ‘Z’ score of 7.44 followed by Alwar (4.03), Banswara (4.16), Ajmer (4.29) and Jodhpur (4.3). The category of high magnitude of development is mainly prevails in the DHQs of southern part of the state and moderate magnitude of development found in south-eastern part, whereas least development has been observed in eastern and western parts of the state. The DHQs displaying least development are actually thickly populated or situated in western part of the state, which suffers from harsh physiographic conditions (Fig.1b).
Table: 2. Levels of HRD in the DHQs, 2011
Category Range No. of
DHQs
Percentage Name of the DHQs
Least Developed Less
than -4
04 12.1 karauli, Jaisalmer, Dhaulpur, Tonk
Less Developed -4 to 0 12 36.4 Nagaur, Jhujhunun, Jalor, Sirohi, Pali,
Baran, Kota, Bhilwara, Rajsamand,
Moderately Developed
0 to 4 12 36.4 Jhalawar, Sawai Madhopur, Sikar, Bikaner,
Chittorgarh, Ganganagar, Barmer, Dausa, Pratapgarh, Bundi, Jaipur, Dungarpur
Highly Developed
More than 4
05 15.2 Alwar, Banswara, Ajmer, Jodhpur, Udaipur
Total 33 100
Source: Calculated from PCA 2001, 11. Directorate of census operations, Jaipur
The former analysis reveals that the HRD scenario remained almost same during the decade 2001-2011. In the state fifteen (46.9 percent) DHQs have obtained Composite `Z’ score of less than zero in the census 2001 and in 2011 the DHQs numbered sixteen (48.5 percent). DHQ Karauli, Jaisalmer, Dhaulpur and Tonk remained in the same group (least developed) in the both censuses; DHQ Jalor jumped to the next category (less developed). DHQ Barmer and Chittorgarh sprang to moderate category from the category of less developed. DHQ Jodhpur and Alwar hoped to category of highly developed. Decline in the development has been observed in some DHQs in the decade (2001-11). DHQ Kota, Baran and Churu have been skipped from moderate category to the category of less developed. While arranging the DHQs according to the composite `Z’ score DHQ Udaipur has gained first rank in the both censuses 2001 and 2011. In 2001 DHQ Banswara stands on second rank and DHQ Ajmer at third rank. In 2011 second rank has been achieved by DHQ Jodhpur and DHQ Ajmer positioned at third rank. In 2001 DHQ Jodhpur was on eighth rank, jumped
to second rank in 2011. The capital of the state Jaipur has acquired 15th position in the census 2001; it sprang to seventh
rank in 2011. DHQ Sikar has deteriorated to 15th rank in the census 2011. This DHQ was on fourth position in 2001.
DHQ Alwar has maintained on fifth rank in the both censuses. The newly introduced DHQ Pratapgarh has placed on ninth rank in 2011. DHQ Jaisalmer has positioned on rank 32 in the both censuses; whereas DHQ Karauli has slipped to rank 33 in 2011 from rank 31 in last census 2001.
REFERENCES
1. Dutt Mala, Development and HRD in India, Ideas 20th Anniversary, Tokyo, March 10, 2010. 2. Sinha B.R.K. (2012), Rural HRD in India: A Spatio Temporal Analysis, online publication, June 2012.
3. Verma, D.N., and Alamtar Ali (2009), Spatial perspective of Human Resource Development: A case study, Geography in the twenty – first Century; The Institute of Geographers, India, pp.121-130.
4. http://ro.uow.edu.au/artspapers/26 5. http://ro.uow.edu.au/artspapers/114.
6. Verma, D.N., and Alamtar Ali (2009), Spatial perspective of Human Resource Development: A case study, Geography in the twenty – first Century; The Institute of Geographers, India, pp.121-130.
7. Bhalla, L.R.,(2012). Geography of Rajasthan,Kuldeep publishing house, Jaipur.
8. Coale, A., and J. Trussell. (1996). “The development and use of demographic models.” Population Studies., Vol. 50, pp. 469-484. 9. Conclusions and Discussion: IIHMR Working Paper No. 1 Health Seeking Behaviour and Healthcare Services in Rajasthan, India: A
TribalCommunity's Perspective Lakhwinder P Singh Shiv D Gupta Institute of Health Management Research. (Net)
10. Dikshit, K. R., (2003). Metropolitan Cities: Issues of Development. Paper presented in Regional Seminar on Metropolitan Cities inIndia: Issues of Development, held at Department of GeographyUniversity of Mumbai, January 28-29, 2003.
11. Government of Rajasthan, “Various Plan Documents”, Planning Department,Jaipur. (Net)
12. Jhalani, Sitaram,(2003). Rajasthan: Nootan-Puratan., Rajasthan swarna jayantiprakashan samiti, Jaipur.
13. Kothari Devendra,(1990). Growing population in Rajasthan: Some emerging Issues IIHMR Occasional Paper No.1, Institute of Health Management Research, Jaipur.
14. Kelly D. (2001). Dual Perceptions of HRD: Issues for Policy: SME’s, Other Constituencies, and the Contested Definitions of Human Resource Development, http://ro.uow.edu.au/artspapers/26
15. Kelly D. (2006). Human Resource Development: For Enterprise and HumanDevelopment, http://ro.uow.edu.au/artspapers/114.Katzoff, M., and D. Malec. (1983). “Application of Some Common SpatialModels to Population Data.” pp. 522-524 in 1983 Proceedings ofthe Social Statistics Section. Alexandria, VA: American Association.
16. Livi-Bacci, Massimo (1991). Population and Nutrition: An Essay on EuropeanDemographic History. Cambridge: Cambridge University Press.
17. Mittal, Alka (2004), “Billion Plus Population: Challenges Ahead”, Papersubmitted to Academic Staff College, University of Rajasthan, Jaipur during 57th Orientation Course.
18. Mason, A. (1996). “Population and Housing.” Population Research and Policy Review., Vol. 15 (6), pp. 419-435.
20. NFHS-II. Rajasthan: National Family Health Survey, 1998-99. International Institute for Population Sciences, Mumbai, 2001.
21. Nasir Jamshed, (2010). An Inter-Zone Comparative Analysis of the Infrastructural Facilities in the Health Sector of Jaipur City, TheGeographer,Vol. 57(1),pp. 80-90.
22. Nadler L Ed. (1984). The Handbook of Human Resources Development, JohnWiley and Sons, New York. 23. Ogden, Philip E.(1998), “Population Geography.” Progress in HumanGeography, Vol. 22.1, pp. 105–114.
24. Society for International Development (1999), “Human Development Report: Rajasthan”, Rajasthan Chapter, Jaipur. 25. Swanson, Richard A., Elwood F. Holton III (2011). "Foundations of Human Resource Development". (Net)
26. Swanson, Richard A. (2008). "A Brief on the Foundations of Human Resource Development".University of Minnesota HRD Program.Siddiqui, S.H. and Nooruzzaman (2006). Levels of Regional Development in Jharkhand, National Geographical of India. Vol. 52, Part 3-4pp. 17 -176.
27. UNFPA. (1997).India: Towards Population and Development Goals. Oxford University Press, Delhi, 1997