ABSTRACT
LAGADAPATI, MAHESH. Benchmark Generation and Simulation at Extreme Scale. (Under the direction of Frank Mueller.)
The coming years are projected to usher in the era of exascale high performance computing (HPC) systems. The architecture of a HPC system at this scale is determined by many factors: performance, power consumption, fault tolerance, data transfer rate, etc. Characterizing and tuning the performance of existing parallel applications for a given architectural choice is an important facet in exploiting exascale capabilities and requires hardware/software co-design. Simulations using models of future HPC systems and communication traces from applications running on existing HPC systems can offer an insight into the performance of future architec-tures.
© Copyright 2014 by Mahesh Lagadapati
Benchmark Generation and Simulation at Extreme Scale
by
Mahesh Lagadapati
A thesis submitted to the Graduate Faculty of North Carolina State University
in partial fulfillment of the requirements for the Degree of
Master of Science
Computer Science
Raleigh, North Carolina
2014
APPROVED BY:
Vincent W Freeh Matthias Stallmann
Frank Mueller
DEDICATION
BIOGRAPHY
ACKNOWLEDGEMENTS
I would like to thank my advisor Dr. Frank Mueller for his professional guidance and invaluable advice throughout my Masters. His constant flow of ideas and out of box thinking inspired me to deal with many challenging and interesting problems in my research. I would also like to thank Dr. Vincent W Freeh and Dr. Matthias Stallmann for agreeing to serve on my thesis committee. I would like to give special thanks to Dr. Christian Engelmann for his constant help and guidance for my research.
TABLE OF CONTENTS
LIST OF TABLES . . . vi
LIST OF FIGURES . . . vii
Chapter 1 Introduction . . . 1
1.1 Simulation Scalability . . . 2
1.2 Our Approach . . . 2
1.3 Hypothesis . . . 4
1.4 Contributions . . . 4
1.5 Organization . . . 4
Chapter 2 Background. . . 5
2.1 ScalaTrace . . . 5
2.2 xSim . . . 6
Chapter 3 Framework Overview . . . 8
Chapter 4 ScalaBenchGen II . . . 9
4.1 Elastic Data Element Representation . . . 9
4.2 Generating Benchmark Code for Loops . . . 10
4.3 Generating Benchmark Code for Computation . . . 12
Chapter 5 Evaluation . . . 14
5.1 Evaluation Platform . . . 15
5.2 Simulated Platform . . . 15
5.3 Generated Benchmarks Accuracy and Conciseness . . . 16
5.4 Simulation Performance and Accuracy . . . 18
Chapter 6 Related Work . . . 25
Chapter 7 Conclusion and Future Work . . . 27
LIST OF TABLES
LIST OF FIGURES
Figure 3.1 Benchmark Generation and Simulation Process . . . 8
Figure 4.1 Rank specific behavior in loops . . . 11
Figure 4.2 Benchmark code for the loop with rank specific behavior . . . 12
Figure 5.1 Accuracy of ScalaBenchGen II Benchmarks . . . 17
Figure 5.2 MPI Data Exchanged for Different Oversubscription Scenarios . . . 19
Figure 5.3 MPI Messages Exchanged for Different Oversubscription Scenarios . . . 20
Figure 5.4 Simulation Time for Different Oversubscription Scenarios . . . 21
Chapter 1
Introduction
The termHigh Performance Computing(HPC) refers to the aggregation of computing capabili-ties of multiple computers to execute advanced tasks that require large amounts of computation on significant amounts of data. This paradigm is widely used in scientific computing applica-tions like weather/environmental forecasting, molecular dynamics, bioinformatics and complex systems modeling. In a HPC system, each individual computing entity has its own processor(s) as well as memory and is connected in a network with a topology such as a star, ring, tree or torus. As these systems operate over vast amounts of data, high speed network interconnects, such as Infiniband, 10-gigabit Ethernet and proprietary solutions, are used to transfer data.
On such systems, a HPC application implements a parallel algorithm such that multiple machines orchestrate execution in parallel. Such execution is supported through many pro-gramming paradigms, such as the Message Passing Interface (MPI) [9], OpenMP [27], and CUDA [3], by executing an application as several smaller execution units, i.e., processes or threads. MPI provides a language-independent application programming interface (API) that allows communication among processes of an application by exchanging messages between pro-cesses. It is widely used to program applications for HPC systems and has become the de facto standard for communication in a distributed memory environment.
order of exa flops will be built in this decade [21, 14, 22]. With computing power at exascale, these systems are capable of executing large and complex scientific applications projected to allow human brain modeling [11].
1.1
Simulation Scalability
This decade is projected to usher in the period of exascale computing with the advent of high-performance computing (HPC) systems of up to one billion tasks and possibly as many cores. To assess the requirements for future hardware platforms and to investigate the appli-cation/algorithm performance at extreme scale, hardware simulation plays an important role. Significant challenges exist even at the single node level, the network interconnect and at the sys-tem level when trying to orchestrate the execution of such extensive numbers of cores. Hardware simulators are vital in assessing the potential of different approaches under these challenges. Yet, these simulators need to be subjected to realistic application workloads that originate in the HPC realm.
The Extreme-scale Simulator (xSim) [5, 2, 6, 12], a performance investigation toolkit at extreme scale, can execute an application in a simulated HPC environment and thus facili-tates HPC hardware/software co-design. To simulate an application, xSim needs to perform all the computation and communication involved in it. This, coupled with overhead to simu-late network and processor models, makes simulation slow and necessitates that a significant amount of resources be allocated for simulation. The compounding effect of resources used by the application and the simulation, such as the additional network traffic to coordinate the simulation and memory accesses to facilitate the virtualization needed for the simulated envi-ronment, typically results in an overhead of several orders of magnitude. This overhead could be significantly reduced if computational overhead were only simulated as the time spent on com-putational resources, and not as the computation performed. This approach, however, would require the availability of skeleton benchmarks for communication at extreme scale derived from HPC application programs, which currently do not exist. This work tries to fill this gap by generating such communication benchmarks from scalable traces suitable for rapid replay within event-based simulators.
1.2
Our Approach
normal parallel C program that issues MPI calls corresponding to every event in the trace. Experimental results have shown that the generated benchmark closely resembles that of the actual application, both in terms of execution time and communication messages exchanged. ScalaBenchGen [23] is based on the initial version of ScalaTrace [16, 19] that generates scalable traces for applications with SPMD (Single Program Multiple Data) behavior. The new version of ScalaTrace [25] (from here on referred as ScalaTrace II) redesigned the trace format such that scalable traces can be generated even for applications that exhibit irregular SPMD behavior, which is essential for most large-scale HPC applications. To produce benchmarks from this trace format, we contribute novel algorithms for benchmark generation from elastic traces within ScalaBenchGen II.
To improve the simulation process, we co-design the benchmarks produced by ScalaBench-Gen II to mesh with discrete event simulation tools, such as xSim. Simulating a benchmark program instead of the actual application improves the simulator performance in many ways. First, the payload exchange of an MPI event across native ranks can be avoided. In the bench-mark program, a payload of an event is transmitted only to match with the communication behavior of the actual application, but is not utilized elsewhere in the program. xSim supports an application model mode in which the payload of an event is not transmitted. Instead, only metadata is exchanged. Still, this accurately captures the performance of events by updating the timing information within the simulated network model. Benchmarks can be simulated in this mode and, hence, huge data transfers can be avoided without loss of accuracy.
Second, computation can be completely virtualized in the simulator. The computation be-tween two MPI events in the application is reproduced in the benchmark through asleep()call with a duration equal to the time elapsed between them. xSim simulates a sleep() by simply advancing the simulated processor clock. Therefore, computation can be simulated with almost zero overhead, which otherwise adds significant overhead. xSim thus avoids excessive data ex-changes and tedious computation. This enables xSim to gaze benchmarks for simulation and requires fewer resources, thus facilitating simulation at extreme scale.
Third, utilizing a skeleton benchmark instead of the original application obfuscates the application’s implementation details to a degree that permits analyzing the performance char-acteristics of proprietary applications on future-generation HPC systems without revealing the implementation details.
1.3
Hypothesis
To determine the requirements of architectures for next generation HPC systems, performance analysis of existing parallel applications for different architectural choices is crucial and is generally realized through hardware simulators. But a substantial amount of resources are required to simulate an actual HPC application at extreme scale. We attempt to address this challenge in this research. Hence, the hypothesis of this thesis is:
Accurate and concise benchmark skeletons can be generated from traces of parallel appli-cations. By using benchmark skeletons instead of native applications for simulation, resources required to simulate a HPC system are significantly reduced, which improves the scalability of a simulator.
1.4
Contributions
The following are the main contributions of this work:
• We have designed and implemented ScalaBenchGen II, a tool to generate concise and accurate benchmark programs from the traces of ScalaTrace II by utilizing innovative algorithms to expand elastic traces.
• The ScalaBenchGen II and xSim capabilities have been combined in a software co-design approach to pave the way for HPC systems simulation at extreme scale.
1.5
Organization
Chapter 2
Background
2.1
ScalaTrace
ScalaTrace [16, 19] produces scalable and often even constant size communication traces from MPI programs. These traces preserve both structural information and temporal ordering of events, and can be replayed to reproduce the original application behavior. It uses the MPI profiling layer (PMPI) to trace MPI functions and to record their parameters (such as source, destination, etc.) without actually recording the message content. It performs compression in two stages:intra nodeandinter node. Intra node compression is performed locally on each node on-the-fly. Loops in the program are identified and represented in the trace using extended regular section descriptors (RSD) [10]. Power-RSDs (PRSD) [15] are used to describe RSDs nested in a loop. Inter node compression is performed during MPI Finalize() to produce a global trace file by combining the local trace records of each node. Another important feature of ScalaTrace is the preservation of the computation time of an application. It records the time elapsed between two communication events. Instead of exact values, statistical histogram bins are used to store delta times such that differences in execution time of an event across a loop or nodes is captured in the trace.
In a parallel program, an event can be executed in only some ranks or its parameters may vary with the rank. This information is captured in the trace by associating aranklist, a list of ranks expressed in a recursive manner, to the event. A ranklist is encoded as:
dimension, start,(iters, stride)+
wheredimension is the dimension of the list, start is the starting node rank, and a sequence of ( iters, stride ) pairs represent the iteration count and stride, one each per dimension.
MPI parameters and loop structures match. The new version of ScalaTrace [25] (ScalaTrace II) is designed to generate scalable traces for applications that have inconsistent task level and loop level behavior. Event parameters, including loop information, are represented through a novel format, theelastic data element representation.
2.2
xSim
The Extreme-scale Simulator (xSim) [5, 2, 6, 12] is a performance investigation toolkit that per-mits running native HPC applications or proxy/mini applications in a controlled environment with millions of concurrent execution threads, called simulated MPI processes, while observing application performance in a simulated extreme-scale system to facilitate hardware/software co-design. The processor and network model of a simulated HPC system is configured in xSim to extract the performance data of an application. xSim uses light weight parallel discrete event simulation (PDES) [7] and employs novel techniques to support high oversubscription,i.e., sub-scribing multiple simulated MPI processes to a physical MPI process. Thus, xSim can execute a parallel application in the simulated environment of an extreme scale system on a much smaller HPC system.
Like any other MPI applications’ performance investigation toolkit, xSim is implemented as an interposition library between the MPI program and the MPI layer using the MPI profiling layer (PMPI). All PDES related mechanisms are implemented in the PMPI layer. It has essential support for simulated MPI point-to-point communication and full support for simulated MPI data types, groups, communicators, and collective communication. In total, xSim supports 88 simulated MPI functions for each supported programming language, C and Fortran. An MPI application is run in the simulator using the following steps:
• Add #include xsim-c.h to the C source code, or #include xsim-f.h to the Fortran source code.
• Recompile the application and link it with the xSim library, i.e.,-lxsim, and the respective xSim programming language interface library, i.e, -lxsim-c forC or-lxsim-f forFortran.
• Run the application with: mpirun -np <physical process count> <application> -xsim-np <simulated process count>[other xSim arguments] [application arguments].
The simulation also accounts for the wait time incurred by communication for each simulated MPI process using a network model. Network latency and bandwidth values are configured for a network model and are used to estimate the total time taken for communication. xSim supports different network topologies, such as star, tree, ring, mesh, torus and twisted torus. Hierarchical combinations are simulated by specifying the topology for each level. It also offers the support to configure rendezvous thresholds and to simulate sender/receiver process contention. For scalability reasons, the network model does not provide full contention modeling for shared network interfaces or routers at this point.
xSim presents a special mode, application model mode, to support the simulation of appli-cation models such that the scalability of simulation is improved. Appliappli-cation models, or the generated benchmarks in this work, exhibit the same timing and communication behavior as that of the original application. But simulation of these models requires only a small amount of resources, such as processor capacity and network bandwidth. The time taken for computation is simulated by simply advancing the simulated process clock according to the time the appli-cation would have spent between MPI calls on actual execution using the simulatedsleep() and usleep() calls. Simulated MPI calls are executed without actually sending MPI message pay-loads, as the MPI message envelope containing the metadata is enough to accurately simulate communication behavior.
Chapter 3
Framework Overview
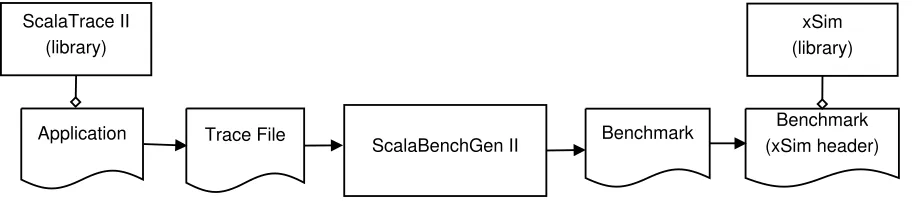
Figure 3.1 outlines the process of generating a benchmark skeleton, and simulating it using xSim. First, the application is linked with the ScalaTrace library and executed to produce a trace file. The trace file is fed into the benchmark generator, which outputs a corresponding benchmark program. The benchmark generator can be run on a standalone machine. The generated benchmark is a normal C program that can be executed like any other parallel MPI program, reproducing the timing and communication behavior of the original application.
Application Trace File Benchmark
ScalaBenchGen II ScalaTrace II
(library)
Benchmark (xSim header)
xSim (library)
Figure 3.1: Benchmark Generation and Simulation Process
Chapter 4
ScalaBenchGen II
ScalaBenchGen [23] generates communication benchmarks from the traces of ScalaTrace [16, 19]. Each event in the trace maintains MPI call parameters along with the time elapsed from the previous event. The benchmark program is a C program that issues MPI calls for each event in the trace. Computation between two events is abstracted by sleeping for a duration equal to the elapsed delta time since the previous event. This makes the wall clock time of both application and generated benchmark program closely resemble each other. Wrapper functions are designed for MPI events to hide the details of parsing the parameters and to invoke the actual MPI function with appropriate values. Retrieving communicators and generating request handles are also implemented in the wrapper functions. Thus, the generated benchmarks are both accurate and readable. A detailed description of the benchmark generator is presented in [23].
In ScalaTrace II, the trace format is completely redesigned to be able to capture more complex application patters. Hence, ScalaBenchGen also requires a redesign including novel al-gorithms for expanding elastic representations to generate benchmark programs from the traces of ScalaTrace II. In this work, we describe ScalaBenchGen II, a tool to generate benchmarks from the traces of ScalaTrace II. The following sections contribute novel algorithms required for benchmark generation specifically for elastic traces.
4.1
Elastic Data Element Representation
consider the scenario when an MPI Send communicates 5 and 10 elements in two successive iterations of a loop for ranklist R1, but sends 15 and 20 elements for ranklist R2. Then, the count parameter of the event is represented as:
5,10 :R1; 15,20 :R2
The benchmark generator passes elastic data elements of a parameter as a character string to the MPI event wrapper function. Inside the wrapper function, this string is parsed for the first time and an integer value vector is constructed. To avoid parsing the string every time, a value vector and the last accessed index are maintained in the benchmark code. Thus, ScalaBenchGen II can generate scalable benchmarks without much overhead by using the elastic data element representation.
4.2
Generating Benchmark Code for Loops
ScalaTrace identifies the loops in a program and represents them using the PRSD format [15]. Whenever a loop is encountered in the trace, ScalaBenchGen generates a for loop and places all members of the loop in it. ScalaTrace compresses repetitive events into a loop only when all events match across iterations. Loops across ranks are merged if and only if all its loop mem-bers are identical. ScalaTrace II redesigns the compression algorithms, such that a sequence of events is compressed as a loop even if the loop members differ across ranks or iterations. Loop information is also encoded using the elastic data element representation to achieve good com-pression. Hence, to generate benchmark code for loops, new techniques need to be introduced in the benchmark generator.
Inter-node compression in ScalaTrace II is loop structure agnostic in nature. The loop head maintains the information about a loop,i.e.,the number of members (events) and iterations, as elastic data elements. While merging two loop heads, loop information is compressed as elastic data elements such that the difference in loop structure across tasks is captured through the elastic data element representation. But this compression mechanism provides the following unusual properties to loop members, which makes the code generation process difficult:
• The number of events in a loop can be different per rank and iteration of an outer loop.
Rank 0:
1: for(i=0;i<10;i++){
2: E1;
3: E2;
4: E3;
5: }
Rank 1:
1: for(i=0;i<20;i++){
2: E1;
3: E2;
4: } 5: E3;
Figure 4.1: Rank specific behavior in loops
loop structure information with the loop head event,i.e.,E1. The trace for Figure 4.1 is
E1(3,10)[0],(2,20)[1] E2E3
where the subscript of E1 indicates that rank 0 has a loop with 3 events and 10 iterations, whereas the loop in rank 1 has 2 events and 20 iterations.
ScalaBenchGen II uses the elastic data element representation to reflect any task specific behavior in loops. Whenever a loop is encountered in the trace, a for loop is placed in the benchmark code. Like other MPI data parameters, elastic data element strings are constructed for both iteration and member counts of a loop. They are parsed before executing the loop to determine the current iteration and member counts of the loop. The loop tail, i.e.,the last event in the trace that can be part of the loop across all ranks, will also be identified. All the events from loop head to loop tail are placed in the generated for loop. This may result in a placement of events in the loop such that certain events are executed in the loop only for a subset of ranks. For the example in Figure 4.1, eventsE1, E2,and E3 are placed in a loop, but E3 is not part of the loop for rank 1 and, hence, should only execute once. Thus, to guarantee the correctness of a program, a conditional check is placed before every loop member:
is loop member(rank, event ranklist, nesting depth)
iter_cnt = get_param(‘‘10,0;20,1’’); mem_cnt = get_param(‘‘3,0;2,1’’); for(iter=0; iter<iter_cnt; iter++){
if(is_loop_member(...)) E1;
if(is_loop_member(...)) E2;
if(is_loop_member(...)) E3;
}
Figure 4.2: Benchmark code for the loop with rank specific behavior
4.3
Generating Benchmark Code for Computation
Each event in the trace records the time taken for computation, i.e., the time elapsed in ex-ecution since the last event. The benchmark generator simulates this computation time by introducing a sleep() call before the event for the recorded time. An event can have multiple time records as its previous event can be different based on the rank and iteration of the loop. The initial version of ScalaBenchGen [23] places conditional checks such that the correct value is chosen for computation based on the entry path. This approach does not hold for the traces of ScalaTrace II. As described in sections 4.1 and 4.2, ScalaTrace II aggressively compresses events even though their parameters and loop membership vary with the rank and iteration. This could lead to many entry paths for an event. For example, in the program shown in Fig-ure 4.1, eventE1 has an entry fromE3 for rank 0, but it also has an another entry fromE2 for rank 1. Compressing nested loops might increase entry paths even more. Placing conditional checks for every entry path increases the size of the generated benchmark program and reduces its readability.
times={{t(E2),E2},{t(E3),E3},{t(P),P}};
do_compute(times,...);
Chapter 5
Evaluation
The developed framework is evaluated on ARC (A Root Cluster) at North Carolina State Uni-versity using a subset of the NAS parallel benchmarks [1] (version 3.3.1). These benchmarks are chosen as they perform both point-to-point and collective communication, which are prevalent in HPC applications. All experiments are conducted with 256, 512 and 1024 MPI ranks, except for SP and BT. As the number of MPI ranks needs to be a perfect square for these bench-marks, those two are executed with 64, 256 and 1024 MPI ranks. All benchmarks are executed with class D input problem sizes to produce sufficient computation and communication at this scale. Execution time metrics are reported as averages over three runs with a relative standard deviation of no more than 4.88% across all benchmarks. For the wall clock time taken for sim-ulation, we observed relative standard deviations as high as 64% for outliers as simulation time can be more erratic for extremely short runs (less than 20 seconds), which is not significant due to system overheads that can easily skew results for these short runs. The average relative standard deviation across all benchmarks is only 8.36%, which is more meaningful and, most significantly, applies to longer runs. We also observed stability issues for simulation at 1024 MPI ranks with an oversubscription factor of 1 for certain benchmarks (MG, SP and BT), which result in lost heartbeats within Open MPI’s runtime layer (ORTE). We reported the results of a single run in this case (just for simulation under xSim). The current framework needs to be stabilized to address these problems.
5.1
Evaluation Platform
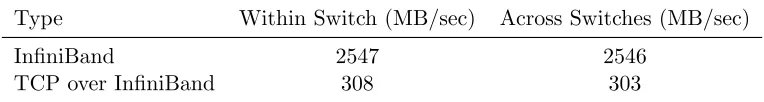
ARC consists of 108 compute nodes, each with 2 AMD Opteron 6128 (Magny Core) processors. Each processor has 8 compute cores,i.e.,each node has 16 cores and 32 GB DRAM. The nodes are connected via InfiniBand with a fat tree network topology as follows: The 108 compute nodes are connected through 6 layer 1 (L1) switches and 3 layer 2 (L2) switches. Each L1 switch has 36 ports, where the lower 18 ports are connected to the compute nodes and the upper 18 ports are connected to L2 switches (6 per switch). For MPI communication, the raw InfiniBand (IB) or TCP over IB may be used. Table 5.1 shows a significant difference in effective bandwidth between both. The NAS parallel benchmarks and the generated skeleton benchmarks are executed over IB with Open MPI 1.5.4.
The simulator is configured to match the IB configuration. However, due to the requirement for multithreading in xSim, xSim itself is executed using the 8-times slower IB-over-TCP with Open MPI 1.5.4 and MPI multithreading support (since native IB does not support MPI mul-tithreading). As xSim supports oversubscription, its performance is evaluated by increasing the oversubscription from a 1:1 ratio of physical-to-simulated MPI processes to a 1:16 ratio, i.e., reducing the number of physical processes by half in each step.
Table 5.1: IB vs. TCP-over-IB Effective Bandwidth on ARC
Type Within Switch (MB/sec) Across Switches (MB/sec)
InfiniBand 2547 2546
TCP over InfiniBand 308 303
5.2
Simulated Platform
Table 5.2: ARC Network Parameters
Level Latency Bandwidth Rendezvous Threshold
On-node 12µs 1834 MB/sec 4 kB
Off-node (same switch) 13µs 2547 MB/sec 64 kB Off-node (different switch) 14µs 2546 MB/sec 64 kB
MPI process,i.e.,a simulated MPI process cannot send and/or receive multiple MPI messages without incurring the required cost to send and/or receive them. However, xSim neither sim-ulates network contention at the node interface nor at router level at this point. Furthermore, xSim’s collective MPI calls are implemented in a linear fashion at the moment. There is no simulation support for tree-based collectives.
5.3
Generated Benchmarks Accuracy and Conciseness
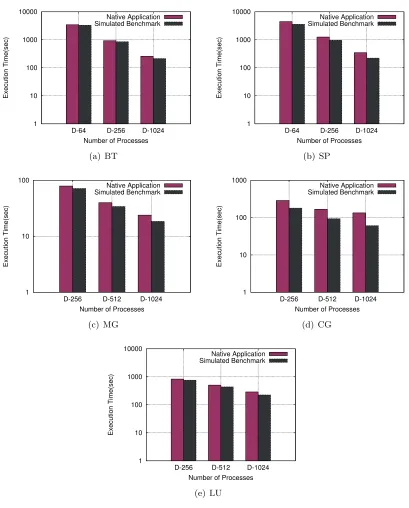
Figure 5.1 compares the wall clock execution times (on a logarithmic scale on the y-axis) of the benchmark programs (x-axis) generated by ScalaBenchGen II with the corresponding original applications. Both are executed on the same evaluation platform, ARC. From the graphs in Figure 5.1, we observe that the execution times of the generated benchmark and the corresponding application are close to each other. Quantitatively, the mean percentage error across the benchmarks is 5.5%, indicating a high accuracy. The maximum percentage error observed is 13.29%. We have calculated the percentage error using the formula:
|(Tbm−Tapp)|/Tapp×100
whereTbmandTapprepresent the execution time of benchmark program and the corresponding
application, respectively.
Table 5.3: Comparison of Number of Lines of Code
Program Application Benchmark Reduction (%) Scalability
BT 9383 1076 88.53 constant
SP 5067 1022 79.83 constant
CG 1918 954 50.26 constant
LU 6024 1298 78.45 constant
1 10 100 1000 10000
D-64 D-256 D-1024
Execution Time(sec)
Number of Processes Native Application Generated Benchmark (a) BT 1 10 100 1000 10000
D-64 D-256 D-1024
Execution Time(sec)
Number of Processes Native Application Generated Benchmark (b) SP 1 10 100
D-256 D-512 D-1024
Execution Time(sec)
Number of Processes Native Application Generated Benchmark (c) MG 1 10 100 1000
D-256 D-512 D-1024
Execution Time(sec)
Number of Processes Native Application Generated Benchmark (d) CG 1 10 100 1000 10000
D-256 D-512 D-1024
Execution Time(sec)
Number of Processes Native Application Generated Benchmark
(e) LU
Table 5.3 demonstrates the conciseness of the benchmarks produced by ScalaBenchGen II. The generated programs are smaller than the corresponding applications, less than half the size in most of the cases, even though these were benchmark programs to begin with. (More significant reductions in size would be obtained when automatically generating benchmarks from full-sized HPC applications.) The scalability column in Table 5.3 indicates how the number of lines of code changes with number of MPI ranks. The numbers of lines of code remain constant for all the benchmarks, irrespective of the number of MPI ranks, except for MG. MG performs a complex 7-point stencil communication that results in imperfect trace compression. However, the increase is only sub-linear with number of MPI ranks. Here, we reported the change in number of lines for 256 to 1024 ranks. Most significantly, BT and CG show a constant size irrespective of the number of ranks, which could only be obtained by benchmark generation with ScalaBenchGen II from the elastic trace format (cf. prior sub-linear results for these benchmarks in [16]).
5.4
Simulation Performance and Accuracy
We evaluated the effectiveness of our approach using two metrics: the amount of MPI data communicated during simulation and the time taken to complete the simulation. Figure 5.2 presents the amount of MPI data communicated (on a log scale on the y-axis) under the simu-lation for the different generated skeleton benchmarks (x-axis). Note that the generated skeleton benchmarks communicate the same amount of MPI data as the corresponding NAS benchmarks when not using xSim for simulation. We observe that MPI data transmitted during simulation is 2-4 orders of magnitude smaller than the amount of data communicated in the actual appli-cation. This is due to the fact that the MPI payload is not transmitted during simulation. In all benchmarks, a total of only a few giga bytes are communicated during simulation, even though the MPI data exchanged in native application execution is in the order of tera bytes. Also, the amount of transmitted MPI data decreases with increasing oversubscription, because xSim does not need to send MPI messages with corresponding metadata for simulated MPI processes that reside within the same physical MPI process (using user-space threading). Figure 5.3 shows the effect of decreasing MPI message counts (on a log scale) over increasing oversubscription. We observe a reduction of MPI messages in the order of millions as we increase the oversubscription factor.
(a) legend 1 100 10000 1e+06 1e+08 1e+10 1e+12
D-64 D-256 D-1024
MPI Data Exchanged (bytes)
Number of Processes
(b) BT 1 100 10000 1e+06 1e+08 1e+10 1e+12
D-64 D-256 D-1024
MPI Data Exchanged (bytes)
Number of Processes
(c) SP 1 100 10000 1e+06 1e+08 1e+10 1e+12
D-256 D-512 D-1024
MPI Data Exchanged (bytes)
Number of Processes
(d) MG 1 100 10000 1e+06 1e+08 1e+10 1e+12
D-256 D-512 D-1024
MPI Data Exchanged (bytes)
Number of Processes
(e) CG 1 100 10000 1e+06 1e+08 1e+10 1e+12
D-256 D-512 D-1024
MPI Data Exchanged (bytes)
Number of Processes
(f) LU
(a) legend 1 10 100 1000 10000 100000 1e+06 1e+07 1e+08
D-64 D-256 D-1024
MPI Messages Exchanged
Number of Processes
(b) BT 1 10 100 1000 10000 100000 1e+06 1e+07 1e+08 1e+09
D-64 D-256 D-1024
MPI Messages Exchanged
Number of Processes
(c) SP 1 10 100 1000 10000 100000 1e+06 1e+07
D-256 D-512 D-1024
MPI Messages Exchanged
Number of Processes
(d) MG 1 10 100 1000 10000 100000 1e+06 1e+07 1e+08
D-256 D-512 D-1024
MPI Messages Exchanged
Number of Processes
(e) CG 1 10 100 1000 10000 100000 1e+06 1e+07 1e+08 1e+09 1e+10
D-256 D-512 D-1024
MPI Messages Exchanged
Number of Processes
(f) LU
(a) legend 0.1 1 10 100 1000 10000
D-64 D-256 D-1024
Simulation Time(sec)
Number of Processes
(b) BT 1 10 100 1000 10000
D-64 D-256 D-1024
Simulation Time(sec)
Number of Processes
(c) SP
1 10 100
D-256 D-512 D-1024
Simulation Time(sec)
Number of Processes
(d) MG
1 10 100 1000
D-256 D-512 D-1024
Simulation Time(sec)
Number of Processes
(e) CG 1 10 100 1000 10000
D-256 D-512 D-1024
Simulation Time(sec)
Number of Processes
(f) LU
observe an initial decrease of simulation time with increasing oversubscription and an eventual increase again in most of the scenarios. We have shown in Figures 5.2 and 5.3 that an increase of oversubscription will lower the number of MPI messages and the amount of MPI data that is communicated. However, more simulated MPI processes reside on the same physical MPI process with higher oversubscription, resulting in additional overheads for context switching between them. Each individual simulated MPI message that is received by a simulated MPI process requires the simulator to switch to the context of the receiving simulated MPI process. While the context switch itself consists of a jump in the user-space stack and a copy-out/in of the data segments, it is not necessarily by itself a huge performance issue. The context switch, however, may trigger cache pollution. In addition, the network model is applied for each simu-lated MPI message whether it is sent to a locally residing simusimu-lated MPI process or to a remote one, incurring a small computational overhead. Programs with high message volumes, such as LU with over 100 million messages, create a noticeable overhead by forcing context switches and network model computations. Figure 5.4 further shows an outlier. The simulation of MG at 1024 MPI ranks takes longer than the application independent of oversubscription, while it is shorter for 256 and 512 MPI ranks. It appears that its 7-point stencil communication pattern is causing performance degradation in xSim’s MPI message processing that is compounded at larger scales.
Figure 5.5 presents the comparison of the simulated benchmark skeleton execution time with the corresponding application execution time. The mean percentage error across the simulated benchmark skeletons is 22.41%. We have calculated the error using the formula:
|(Tapp−Tsim)|/Tapp×100
whereTappandTsimrepresent the execution time of application and the corresponding simulated
benchmark skeleton, respectively. Both times are decreasing with an increase in the number of MPI ranks. Hence, even though the simulated benchmark skeleton’s time is not highly accu-rate, it follows the same scaling pattern as the original application. This demonstrates that the presented approach permits assessing the performance characteristics of applications using generated benchmark skeletons in a simulated HPC system.
1 10 100 1000 10000
D-64 D-256 D-1024
Execution Time(sec)
Number of Processes Native Application Simulated Benchmark (a) BT 1 10 100 1000 10000
D-64 D-256 D-1024
Execution Time(sec)
Number of Processes Native Application Simulated Benchmark (b) SP 1 10 100
D-256 D-512 D-1024
Execution Time(sec)
Number of Processes Native Application Simulated Benchmark (c) MG 1 10 100 1000
D-256 D-512 D-1024
Execution Time(sec)
Number of Processes Native Application Simulated Benchmark (d) CG 1 10 100 1000 10000
D-256 D-512 D-1024
Execution Time(sec)
Number of Processes Native Application Simulated Benchmark
(e) LU
Chapter 6
Related Work
In the context of the presented work, related work focuses on MPI performance tools that extract and analyze MPI traces and simulation tools that execute applications or corresponding traces in a simulated HPC system.
Our benchmark generator framework, ScalaBenchGen II, utilizes traces produced by Sca-laTrace II that are constant in size irrespective of number of MPI ranks. In contrast to our approach, the size of the traces produced by traditional tracing tools, such as PARAVER [18] and Vampir [13], increases linearly with number of MPI ranks.
Xu et al. [28, 29] proposed a framework to construct performance skeletons to evaluate the performance of corresponding application on a future HPC system. But MPI events that are not part of a globally dominant communication pattern are not included in performance skeletons. Hence, communication behavior of these skeletons may differ from the original application, unlike benchmarks produced by ScalaBenchGen II.
Wu et al. [26] used traces of ScalaTrace to generate benchmarks in Conceptual [17], a domain specific language designed to express communication patterns. A program in Conceptual can be converted into an MPI program inC. But the Conceptual language does not support all features of MPI like communicators and certain collective operations. Thus, a generated benchmark program might not reflect the true behavior of the original application. Since our benchmark framework issues MPI calls inC, it produces lossless and accurate benchmarks.
scale and extrapolating performance at extreme scale. The solution presented in this work of-fers a more practical, versatile and efficient approach as skeleton benchmarks are generated and executed in a simulation environment. The data-intensive trace replay is not necessary and, in contrast to running real applications, there is no need for computation or communication workload within the simulation. Furthermore, application code itself is obfuscated, permitting analysis of the performance characteristics for proprietary applications.
Chapter 7
Conclusion and Future Work
This work has demonstrated the capability to utilize benchmarks generated from ScalaBench-Gen II to drive HPC architectural simulations. The ScalaTrace II framework is used to produce near lossless scalable and elastic communication traces. The resulting traces are transformed by ScalaBenchGen II into a benchmark code, which is of constant size for most benchmarks irrespective of the number of nodes and sub-linear for one benchmark, benefiting from novel benchmark generation algorithms from elastic traces. This code is subsequently fed into xSim to run the benchmark within a simulated environment. Simulating generated benchmarks instead of the original application enables xSim to avoid the payload exchange of an MPI event and virtualizes computation completely. Experimental results showed that with benchmark skele-tons, the total amount of MPI data communicated in simulation is reduced by several orders of magnitude, and the time taken for simulation is close to the application’s native execution time even with higher oversubscription. Therefore, our approach reduces the resources utilized by a simulator, such as processor capacity and network bandwidth. This makes simulation more scalable, which confirms the hypothesis.
This work can be extended to handle more benchmarks during the generation process, and novel simulation techniques can be incorporated to handle extreme scale sized workloads. More specifically, ScalaExtrap [24] presents novel algorithms to extrapolate a trace of a large number of processes from traces of an application that are collected over small numbers of processes. Thus, application traces for next generation extreme scale systems can be derived from existing small HPC systems. Benchmark skeletons can be produced from these traces and analyzed in the simulated environment. But ScalaExtrap is based on the initial version of ScalaTrace and, hence, needs to be redesigned to support new version, ScalaTrace II, an area of future work.
REFERENCES
[1] D. H. Bailey, E. Barszcz, J. T. Barton, D. S. Browning, R. L. Carter, D. Dagum, R. A. Fatoohi, P. O. Frederickson, T. A. Lasinski, R. S. Schreiber, H. D. Simon, V. Venkatakr-ishnan, and S. K. Weeratunga. The NAS Parallel Benchmarks. The International Journal of Supercomputer Applications, 5(3):63–73, Fall 1991.
[2] Swen B¨ohm and Christian Engelmann. xSim: The extreme-scale simulator. InProceedings of the International Conference on High Performance Computing and Simulation (HPCS) 2011, pages 280–286, Istanbul, Turkey, July 4-8, 2011. IEEE Computer Society, Los Alami-tos, CA, USA. Acceptance rate 28.1% (48/171).
[3] CUDA. http://www.nvidia.com/object/cuda_home.html.
[4] Jack J Dongarra, Hans W Meuer, Erich Strohmaier, et al. Top500 supercomputer sites. Supercomputer, 13:89–111, 1997.
[5] Christian Engelmann. Scaling to a million cores and beyond: Using light-weight simulation to understand the challenges ahead on the road to exascale. Future Generation Computer Systems (FGCS), 30(0):59–65, January 2014.
[6] Christian Engelmann and Frank Lauer. Facilitating co-design for extreme-scale systems through lightweight simulation. InProceedings of the 12th IEEE International Conference on Cluster Computing (Cluster) 2010:1stWorkshop on Application/Architecture Co-design for Extreme-scale Computing (AACEC), pages 1–8, Hersonissos, Crete, Greece, Septem-ber 20-24, 2010. IEEE Computer Society, Los Alamitos, CA, USA.
[7] Richard M Fujimoto. Parallel discrete event simulation. Communications of the ACM, 33(10):30–53, 1990.
the 7th European PVM/MPI Users‘ Group Meeting (EuroPVM/MPI) 2000, volume 1908, pages 39–46, Balatonf¨ured, Hungary, September 10-13 2000.
[9] W. Gropp, E. Lusk, N. Doss, and A. Skjellum. A high-performance, portable implemen-tation of the MPI message passing interface standard. Parallel Computing, 22(6):789–828, September 1996.
[10] Paul Havlak and Ken Kennedy. An implementation of interprocedural bounded regular section analysis. IEEE Transactions on Parallel and Distributed Systems, 2(3):350–360, July 1991.
[11] Human Brain Project - High Performance Computing Platform. https://www.
humanbrainproject.eu/high-performance-computing-platform.
[12] Ian S. Jones and Christian Engelmann. Simulation of large-scale HPC architectures. In Proceedings of the40th International Conference on Parallel Processing (ICPP) 2011:2nd International Workshop on Parallel Software Tools and Tool Infrastructures (PSTI), pages 447–456, Taipei, Taiwan, September 13-19, 2011. IEEE Computer Society, Los Alamitos, CA, USA.
[13] Andreas Kn¨upfer, Holger Brunst, Jens Doleschal, Matthias Jurenz, Matthias Lieber, Holger Mickler, Matthias S. M¨uller, and Wolfgang E. Nagel. The vampir performance analysis tool-set. In Michael Resch, Rainer Keller, Valentin Himmler, Bettina Krammer, and Alexander Schulz, editors, Tools for High Performance Computing, pages 139–155. Springer Berlin Heidelberg, 2008.
Techni-cal report, Defense Advanced Research Project Agency (DARPA) Information Processing Techniques Office (IPTO), 2008.
[15] J. Marathe and F. Mueller. Detecting memory performance bottlenecks via binary rewrit-ing. InWorkshop on Binary Translation, September 2002.
[16] M. Noeth, F. Mueller, M. Schulz, and B. R. de Supinski. Scalatrace: Scalable compression and replay of communication traces in high performance computing. Journal of Parallel Distributed Computing, 69(8):969–710, August 2009.
[17] Scott Pakin. The design and implementation of a domain-specific language for network performance testing.IEEE Transactions on Parallel and Distributed Systems, 18(10):1436– 1449, October 2007.
[18] V. Pillet, J. Labarta, T. Cortes, and S. Girona. PARAVER: A Tool to Visualize and An-alyze Parallel Code. In Proceedings of WoTUG-18: Transputer and occam Developments, pages 17–31, mar 1995.
[19] P. Ratn, F. Mueller, Bronis R. de Supinski, and M. Schulz. Preserving time in large-scale communication traces. InInternational Conference on Supercomputing, pages 46–55, June 2008.
[20] A. F. Rodrigues, K. S. Hemmert, B. W. Barrett, C. Kersey, R. Oldfield, M. Weston, R. Risen, J. Cook, P. Rosenfeld, E. CooperBalls, and B. Jacob. The structural simulation toolkit. SIGMETRICS Perform. Eval. Rev., 38(4):37–42, March 2011.
[21] Vivek Sarkar, William Harrod, and Allan E Snavely. Software challenges in extreme scale systems. In Journal of Physics: Conference Series, volume 180, page 012045. IOP Pub-lishing, 2009.
[22] Strategic Research Agenda of the European Technology Platform for High Perfor-mance Computing. http://www.etp4hpc.eu/wp-content/uploads/2013/06/ETP4HPC_
[23] X. Wu, V. Deshpande, and F. Mueller. Scalabenchgen: Auto-generation of communication benchmark traces. InInternational Parallel and Distributed Processing Symposium, April 2012.
[24] X. Wu and F. Mueller. Scalaextrap: Trace-based communication extrapolation for spmd programs. InACM SIGPLAN Symposium on Principles and Practice of Parallel Program-ming, pages 113–122, February 2011.
[25] X. Wu and F. Mueller. Elastic and scalable tracing and accurate replay of non-deterministic events. InInternational Conference on Supercomputing, pages 59–68, June 2013.
[26] Xing Wu, Frank Mueller, and Scott Pakin. Automatic generation of executable communi-cation specificommuni-cations from parallel applicommuni-cations. InICS, pages 12–21, 2011.
[27] www.openmp.org. Official OpenMP Specification, May 2005.
[28] Qiang Xu, Ravi Prithivathi, Jaspal Subhlok, and Rong Zheng. Logicalization of mpi com-munication traces. Technical Report UH-CS-08-07, Dept. of Computer Science, University of Houston, 2008.