Division V, Paper 408
AUTOMATIC COMPUTATION OF THE STRAIN-DEPENDENT
CONCRETE CRACKING PATTERN FOR NUCLEAR STRUCTURES
FOR SITE-SPECIFIC APPLICATIONS
Dan M. Ghiocel1, Mike Saremi2
1 Chief of Engineering and President, Ghiocel Predictive Technologies, Inc., New York, USA 2 Principal Consultant and Seismic Technical Lead, AMEC Foster Wheeler, Knutsford, UK
INTRODUCTION
The paper presents an efficient nonlinear SSI approach for evaluating the concrete cracking pattern in the nuclear concrete structures. The nonlinear SSI approach is based on a hybrid approach that uses iterative equivalent-linearization models for the concrete wall partitions (panels) that correspond to the local stress/strain levels in different parts of the structure. The local linearized hysteretic wall panel models are calibrated at each SSI iteration based on the “true” nonlinear wall behaviour in the time domain. Refined shear deformation hysteretic models were implemented for low-rise shearwall building applications. Comparative results of the hybrid approach and the true nonlinear time-integration approach exhibited very good correlation (Ghiocel, 2015). The hybrid approach is both accurate and extremely fast since convergence is achieved in only few iterations.
This hybrid approach was implemented in the ACS SASSI Option NON software (2016). The nonlinear SSI analysis is applicable to:
i) Site-specificdesign level for accurate evaluation of the concrete cracking pattern in structures as a function of stress/strain levels in accordance with the new ASCE 04-16 standard (Section C3.3.2) and the USNRC SRP requirements for the site-specific license applications, and
ii) Beyond design level for structural fragility analyses in accordance with the ASCE 4-16 standard recommendations for using probabilistic nonlinear SSI analysis (Sections 3 and 5.5).
This paper focuses on the evaluation of the concrete cracking pattern in the structure at the design-level for site-specific applications.
EFFICIENT GENERATION OF NONLINEAR STRUCTURAL MODEL
2
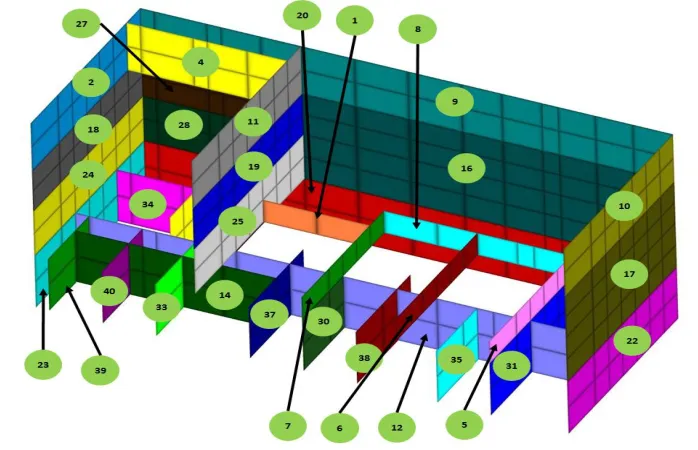
Figure 1 Nonlinear Structure Model Split in Wall Panels
After splitting the nonlinear model into wall panels, the nonlinear behaviour of each panel has to be defined by its back-bone curve (BBC) and hysteretic type model. Three types of nonlinear hysteretic models are available in ACS SASSI Option NON:
i) Cheng-Mertz shear (CMS) model, ii) Cheng-Mertz bending (CMB) model, and iii) Takeda model (TAK).
The Cheng-Mertz hysteretic model (Cheng and Mertz, 1989) was used over many years in a number of studies for the DOE and ASCE standards.
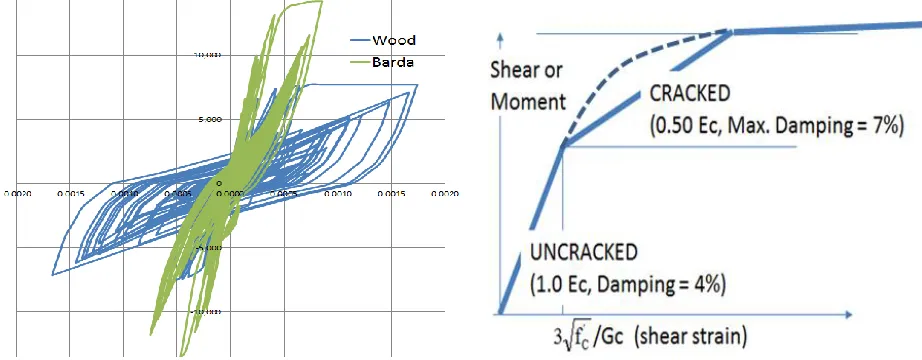
It should be noted that the CMS hysteretic model in contrast to TAK model has the capability to better capture the significant shear stiffness degradation for the loading cycle paths for larger seismic loads (similar to an origin-oriented hysteretic model), but also to include the reduced stiffness degradation for the unloading cycle paths and the pinching effects for low amplitude levels as shown in Figure 3. Figure 3 shows the CMS hysteretic loops for a fully converged SSI solution for two random strain histories with the maximum amplitudes of 0.065% that corresponds to the design-basis level DBE input (green line) and, respectively, 0.37% that corresponds to the beyond design-basis level BDBE input that is twice DBE input (red line).
3
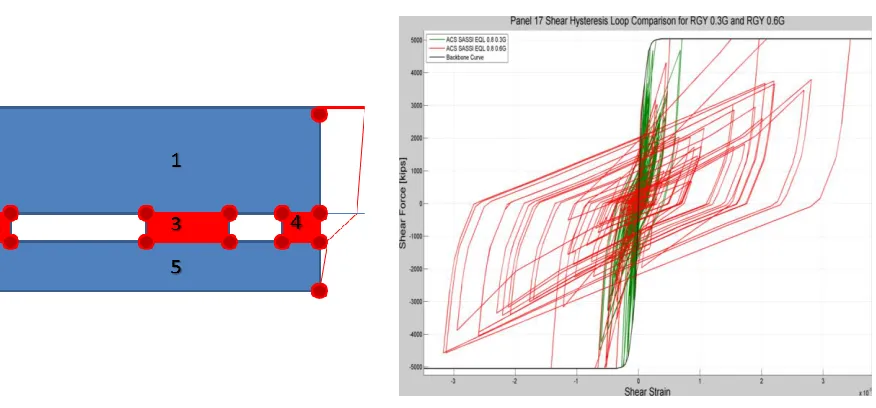
Figure 2 Panel Split Due to Openings Figure 3 Hysteretic Loops for Two Strain Levels
The BBC for each panel depends on the panel geometry, thickness, concrete and reinforcement strengths and ratios. For each panel, analysts need to define the BBC curve. The BBC should be built based on the concrete cracking and ultimate wall capacities under either shear or bending deformation. The shear and bending strains in wall are determined based on the panel corner relative displacements after the rigid body transformation is subtracted. It should be noted that the horizontal and vertical displacements computed at the panel corners of each wall must include the combined effects of the three seismic component inputs.
The BBC curves should have a smooth shape and variation that describes the nonlinear behaviour of the wall panels under the lateral seismic loading. The BBC could be built based on the existing experimentally-based technical recommendations, or computed using static nonlinear pushover FE analysis. However, the BBC computed using pushover analysis could be quite different than experimentally-based BBC based on technical recommendations from different pertinent sources. This is an important aspect to be paid attention by the analyst. For estimating the low-rise shearwall panel capacities there are a significant number of pertinent sources in the literature that provide different empirical equations for computing the wall panel shear capacities (Gulec and Whittaker, 2009). Using the SHEAR command the user can check the computed shear capacity values based on different shear capacity equations. Using the BBCGEN command, smooth BBC curves can be automatically generated for many wall panels.
4
same wall panel using the CMS hysteretic model. Recently, the Barda equation was taken out of the new ASCE 43-16 standard draft. Also, the Gulec-Whittaker equation is highly sensitive to the wall panel height/length ratios, so that for lower ratios, the shear capacities computed with this equation become unrealistically large.
Figure 4 Barda, 1977 vs. Wood, 1990 Equation Figure 5 BBC Generation Using BBCGEN
The SHEAR command includes the following options for computing the wall panel shear capacities which are described by the equations shown below. In these equations, the
F
VWforce is the verticalreinforcement strength
F
VW= VAWfy(kips or kN), ' c 'f is the compressive strength (ksi or kN/m2), fy is
the reinforcement yield strength (ksi or kN/m2), V
or
H, the web reinforcement ratio for the vertical direction or horizontal direction, Nu is axial force (kips or kN). The ABE and FBEparameters are used only in the Gulec-Whittaker equation. The Abe parameter defines the boundary element vertical reinforcement area (ft2 or m2) that is used to compute the boundary forceBE , y BE
BE
A
f
F
. Thef
y,BEparameter defines the boundary element vertical reinforcement yield stress (ksi or kN/m2) that is used to
compute the boundary force
F
BE
A
BEf
y,BE.Barda et al., 1977: The Barda equation (equation 2-7 or 4-7 in Gulec and Whittaker, 2009) is applicable to squat walls with heavily reinforced flanges (barbells). For typical shearwalls in nuclear facilities Barda equation could provide overly estimated shear strength values. Axial force effect is included.
)
l
6
.
0
(
t
f
t
l
4
N
l
h
f
5
.
2
f
8
V
V y W WW W U W W ' c ' c '
(1)Wood, 1990: The Wood equation appears (equation 2-8 in Gulec and Whittaker, 2009) close to be quite close to the median estimates for ultimate shear strength for various squat wall tests. Axial force is not included. W ' c y W V W '
c 10 f A
4 f A V A f
5
ACI 318-08, 2008: The ACI 318-08 Chapter 11 equation appears (equation 4-1 in Gulec and Whittaker, 2009) could provide overly estimated ultimate shear strengths. Axial force is not included.
H y
W' c '
c
f
f
A
V
10
f
c'A
W (3)Gulec-Whittaker, 2009: The Gulec-Whittaker equation appears (equation 6-9 in Gulec and Whittaker, 2009) to be also close close to the median estimates for the ultimate shear strength for various squat wall tests. However, this Gulec-Whittaker equation is sensitive to the panel height/length aspect ratio. If this equation is applied to long panels the ultimate shear force goes up much closer to Barda, 1977 or ACI 318-08 shear force results, and even higher. Axial force is included.
W VW BE U
W W' c
'
A
0
.
25
F
0
.
20
F
0
.
40
N
/
h
/
l
f
5
.
1
V
(4)The BBCGEN command automatically generates BBC for a single panel, or for all panels using an ultimate wall shear capacity equation that is identical with one of the equations used by the SHEAR command, i.e. the equations 1-4 shown above.
Before using the BBCGEN command, the user needs to decide which of the four shear ultimate capacity models of the SHEAR command he would like to consider for the nonlinear SSI analysis. The shear capacity model can be also different for different wall panels. The smoothed BBC are automatically generated based on the input data on the cracking and ultimate shear force values and assuming that the secant cracked stiffness between the cracking and yielding points is half of the uncracked stiffness as recommended in the ASCE 4-16 and ASCE 43-5 standards, and USNRC SRP 3.7.2. The BBCGEN command also include to option for defining the cracking force: i) It defines the ratio between the cracking shear force and ultimate shear force to determine the cracking point of the BBC curve, i.e. this ratio varies between 0.10 and 0.50, and ii) It uses the ASCE 4-16 standard recommendation in Section
C.3.3.2 for defining the cracking shear stress by3 f''c
.
The BBC computed slopes at the ends of theinterval between cracking and yielding points provide always smooth transitions independently of the user-selected option for defining cracking force as shown in Figure 5. The BBCGEN command always generates a 22 point BBC curves, the first point being the cracking point of the BBC curve. The next 20 points will be equidistantly spaced along the strain axis beyond the cracking point until the yield point is reached. The final shear failure point for all BBC curves will be defined by default at (shear strain = 2% and shear force = 1.02 x ultimate shear force value).
The ASCE 4-16 Section C3.3.2 recommends for the evaluation of the concrete cracking pattern for the site-specific applications, to use at the least a two-step procedure as described here. First, the linear SSI analysis is performed for the uncracked structure, to compute the stresses in structure walls. If the wall
shear stress is larger than 3 f'c'
(or shear strain larger than
c ' c ' /G f3
), or the wall bending stress is
larger than
7.5 f'c'(or bending strain larger than
c ' c ' /E f 5 .7
), then, the concrete wall is
considered fully cracked, so that its stiffness goes down to 50% of elastic stiffness, and its
damping goes up to 7%. After, the concrete wall properties are changed accordingly in the
structure model, the second SSI analysis is performed using the linearized partially cracked
model to obtain the final SSI results. The ASCE 4-16 standard Section C3.3.2 states that
“After
running the second analysis that includes cracked properties for some or all walls, rechecking
the wall stress state is not necessary.
” In other words, the ASCE 4-16 standard considers that
6
To be in full compliance with the ASCE 4-16 standard recommendations for the design-level analyses while running the ACS SASSI Option NON software, the analyst is required to define a cut-off damping value of 7%, so that computed material damping values for the concrete walls are not allowed to go higher than 7%. However, from a theoretical point of view, the nonlinear SSI analysis should be performed without any artificial damping cut and run SSI analysis iteratively until the convergence is fully reached. The convergence is achieved typically in about 2-4 SSI iterations for the design-level and about 4-8 SSI iterations for beyond design-level. The SSI iteration runtimes are typically 40-50% of the initial elastic SSI analysis runtime.
A comparison between the nonlinear SSI analysis results obtained using 7% cut-off damping value for concrete walls per the ASCE 4-16 recommendations and the nonlinear SSI solution with no damping cut-off is illustrated in next section.
EVALUATION OF CONCRETE CRACKING EFFECTS FOR A SHEARWALL BUILDING
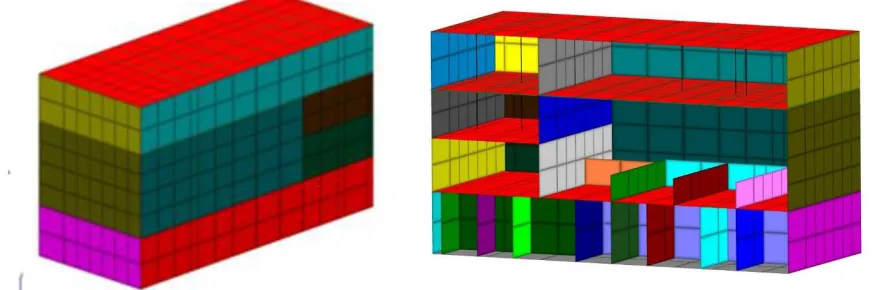
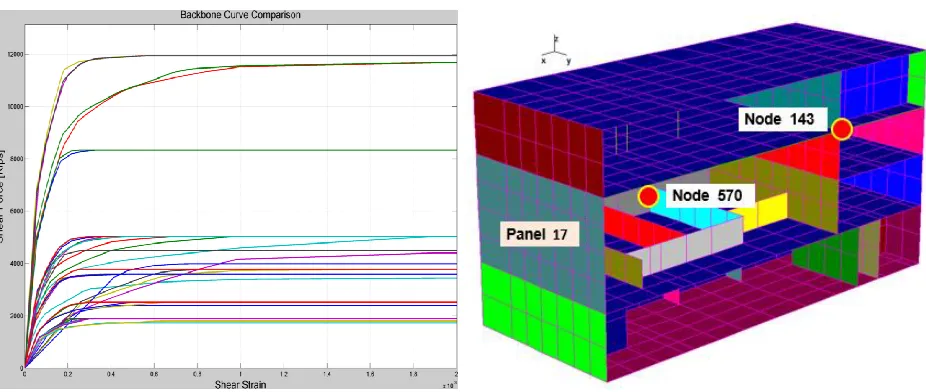
A typical low-rise concrete shearwall nuclear building was considered (Figure 6). The seismic input at design-level was defined by a RG1.60 spectrum compatible acceleration history with 0.30g maximum amplitude. The soil deposit was idealized by a uniform rock formation with a shear wave velocity of 5,000 fps. The nonlinear structure model includes a total of 40 wall panels. The BBC for all walls are shown in Figure 7. The reinforced concrete wall nonlinear behaviour was idealized by the Cheng-Mertz (CMS) hysteretic model.
Figure 6 External and Internal Views of Shearwall Building Model Including 40 Nonlinear Wall Panels
Figure 8 indicates the selected SSI response locations of interest. These are two node locations, node 143 on the 4th floor (higher elevation) and node 570 on the 2nd floor (lower elevation), and the shear wall
panel, Panel 17, that shows largest shear strains during earthquake duration.
Selected seismic SSI responses computed for the 0.30g RG1.60 design-level input are shown in Figures 9 thru 12. Figure 9 compares the linear elastic and the nonlinear SSI response normalized story drifts or shear strains for Panel 17. The computed maximum shear strain is about 0.02% for linear structure and about 0.5% for nonlinear structure. Thus, the nonlinear story drift is about 2.5 times larger for nonlinear structure than linear structure.
7
Figure 7 Computed BBC for Shearwall Panels Figure 8 CMS Hysteretic Loops for 0.30g and 0.60g
Figure 9 Panel 17 Linear and Nonlinear Strains Figure 10 Hysteretic Effects of 7% Damping Cut-off
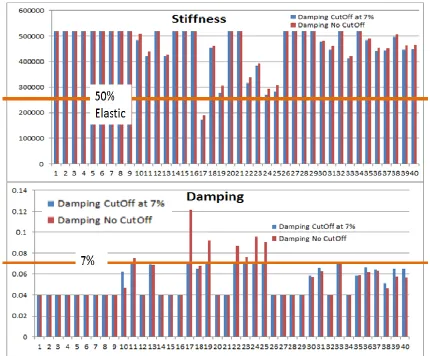
A comparison of the effective or iterated wall panel stiffness and damping values in all walls, with and without 7% damping cut-off is shown in Figure 11. The nonlinear SSI solution was fully converged. It should be again noted that the effect of introducing the conventional 7% damping cut-off as recommended by seismic design regulations has a very small impact on effective wall stiffness values, and more significant effect on the damping values. The main transverse walls are the Panels # 17, 19, 22-25 between 2nd and 4th floors (see Figure 1) which exhibit a significant concrete cracking, as their
effective stiffness values drop to about 40%-65% of the initial uncracked concrete stiffness. These transverse walls have also larger hysteretic damping values greater than the 7%, up to 12% for the Panel 17 which is the most seismically loaded wall. It can be also observed that for the transverse walls between the 1st and 2nd floors the stiffness reduction is considerably less, not more than 15%-20%, since at this
level there a large number of transverse walls.
8
about 20% for the lower elevation ISRS. It should be also remarked that the nonlinear response ISRS computed without and with the 7% damping cut have very close values with differences of about 5% only. This shows again that the effect of introducing the artificial damping cut-off at 7% as required by the ASCE design codes is minimal.
Figure 11 Effective Wall Stiffness and Damping Values for 0.30g Seismic Input
Figure 13 provides an additional insight related to the new ASCE 4-16 recommendations for considering concrete cracking for site-specific applications. This figure shows a comparison between the computed effective stiffness and damping values for the 7% damping cut-off SSI analysis based on a 1 iteration SSI analysis (It1) versus a fully converged 5 iteration SSI analysis (It5).
9
Figure 12 Effects of Damping Cut on the ISRS at Higher (Node 143) and Lower (Node 570) Elevations
Figure 13 Effects of the Number of SSI Iterations for the 7% Cut-off Damping Case
10
Figure 14 Effect of Large Opening on Wall Hysteretic Behaviour for 0.30g Design-Level Input
CONCLUSION
The paper shows the application of an efficient hybrid approach based on the iterative equivalent-linearization for performing a fast nonlinear SSI analysis to include the concrete wall cracking effects in accordance to the US practice requirements for the site-specific license applications. The paper compares the nonlinear SSI analysis results for a low-rise shearwall building with the results obtained using the same hybrid approach but limiting the equivalent-linear damping value in the concrete walls to 7%, as required by ASCE and USNRC regulatory documents. It is shown that the ASCE 4-16 Section C.3.3.2 requirements for performing SSI analysis for the partially cracked concrete models using the simple two-step procedure provides practical results for engineering practice purposes.
REFERENCES
American Society of Civil Engineers (2005) “Seismic Design Criteria for Structures, Systems, and Components in Nuclear Facilities”, ASCE 43-05 Standard.
American Society of Civil Engineers (2017), “Seismic Analysis for Safety-related Nuclear Structures and Commentary” ASCE 4-16 Standard
Barda, F., J.M. Hanson, and G.W. Corley (1977) “Shear Strength of Low-Rise Walls with Boundary Elements”, ACI Special Publication SP 53-8.
Cheng, Y.F. and Mertz, G. (1989).”Inelastic Seismic Response of Reinforced Concrete Low-Rise Shear Walls of Building Structures”, Univ. of Missouri-Rolla, Dept. of Civil Engineering, CE 89-30 Gergely, P.(1984) ”Seismic Fragility of Reinforced Concrete Structures and Components for Application
in Nuclear Facilities”, Cornell University, Published as NUREG/CR-4123
Ghiocel D.,M. (2015) “Fast Nonlinear Seismic SSI Analysis Using A Hybrid Time-Complex Frequency Approach For Low-Rise Nuclear Concrete Shearwall Buildings”, SMiRT22 Conference
Proceedings, Division V, Manchester, UK, August 10-14
Ghiocel Predictive Technologies, Inc. (2016). “ACS SASSI - An Advanced Computational Software for 3D Dynamic Analyses Including SSI Effects”, ACS SASSI Version 3.0 Manuals, December 31,