American Journal of Applied Sciences 8 (4): 368-373, 2011 ISSN 1546-9239
© 2010 Science Publications
Corresponding Author: Ali Ahmed,Faculty of Computer Science and Information Systems, University Technology Malaysia, 81310, Skudai Malaysia, Malaysia
An Enhancement of Bayesian Inference Network for
Ligand-Based Virtual Screening using Features Selection
1,2Ali Ahmed, 1Ammar Abdo and 1Naomie Salim 1Faculty of Computer Science and Information Systems, University Technology Malaysia, 81310, Skudai Malaysia, Malaysia 2Faculty of Engineering, University of Karary, 12304, Khartoum Sudan, Malaysia
Abstract:Problem statement: Similarity based Virtual Screening (VS) deals with a large amount of
data containing irrelevant and/or redundant fragments or features. Recent use of Bayesian network as an alternative for existing tools for similarity based VS has received noticeable attention of the researchers in the field of chemoinformatics. Approach: To this end, different models of Bayesian
network have been developed. In this study, we enhance the Bayesian Inference Network (BIN) using a subset of selected molecule’s features. Results: In this approach, a few features were filtered from
the molecular fingerprint features based on a features selection approach. Conclusion: Simulated
virtual screening experiments with MDL Drug Data Report (MDDR) data sets showed that the proposed method provides simple ways of enhancing the cost effectiveness of ligand-based virtual screening searches, especially for higher diversity data set.
Key words: Features selection, fingerprint features, similarity search, virtual screening, Drug Data,
Bayesian Inference Network (BIN), proposed method, High-Throughput Screening (HTS), Quantitative Structure-Activity Relationships (QSAR)
INTRODUCTION
Over the past few decades, drug discovery companies use combinatorial chemistry approaches to create large and diverse libraries of structures, therefore large array of compounds are formed by combining sets of different types of reagents, called building blocks, in a systematic and repetitive way (Willett et al., 1998;
Walters et al., 1998). These libraries can be used as a
source of new potential drugs, since compounds in the libraries can be randomly tested or screened to find a good drug compound.
By increasing the capabilities of testing compounds using chemoinformatics technologies such, as High-Throughput Screening (HTS), it is possible to test hundreds of thousands of these compounds in a short time (Waszkowycz et al., 2001; Miller, 2002).
Computers can be used to aid this process in a number of ways, for example, in the creation of virtual combinatorial libraries, which can be much larger than their real counterparts. These virtual libraries can be virtually screened either by docking into the active site of interest or by virtue of their similarity to a known active. Recently, searching chemical databases using
computer instead of experiment has been called virtual screening technique (Eckert and Bajorath, 2007; Sheridan, 2007; Geppert et al., 2010).
Many virtual screening approaches have been implemented for searching chemical databases, such as, substructure search, similarity, docking and Quantitative Structure-Activity Relationships (QSAR). Similarity searching is the simplest and one of the most widely used techniques for ligand-based virtual screening in drug discovery programme.
There are many studies in the literature associated with the measurement of molecular similarity (Sheridan and Kearsley, 2002; Maldonado et al., 2006). However,
the most common approaches are based on the 2D fingerprints, with the similarity between a reference structure and a database structure computed using association coefficients such as the Tanimoto coefficient (Walters et al., 1998; Leach and Gillet, 2003).
The effectiveness of ligand-based virtual screening approaches can be enhanced by using data fusion (Willett, 2006; Feher, 2006). Data fusion can be implemented using two different approaches (Kearsley
et al., 1996; Sheridan et al., 1996). The first, similarity
similarity scores or ranking for each descriptor are combined to obtain the final ranking of the compounds in the database. The second approach is a group fusion in which multiple reference structures with a single similarity measure were used to search the database. The group fusion has been found to be generally more effective than the similarity fusion.
In more recent studies, Bayesian inference network (BIN) was introduced as a promising similarity search approach (Abdo and Salim, 2009; Chen et al., 2009;
Abdo et al., 2010). The retrieval performance of
Bayesian inference network was observed to be improved significantly when multiple reference structures were used or more weights were assigned to some fragments in the molecule structure. Unfortunately, such information is unlikely to be available in the early stages of a drug discovery programme, when just a single weak lead is available (Abdo and Salim, 2011; 2009).
Features Selection (FS) is a process of selecting a subset of features available from the data for application of a learning algorithm. The best feature subset contains the least number of features that most contribute to accuracy and efficiency. This is an important stage of preprocessing and is one of the two ways of avoiding high dimensional space of features (the other is feature extraction).The current molecule’s fingerprint consists of many features, not all of it have the sme importance and remove some features can enhance the recall of similarity measure (Vogt et al., 2010).
In this study, we enhance the screening effectiveness of Bayesian inference network using feature selection approach. In this proposed method, a few relevant features were filtered from molecular 2D fingerprint features. A set of active known references and random unknown molecules were used as a test data for each class of the data set. Only the subsets of selected features were used in calculating similarity score.
MATERIAL AND METHODS
This study has compared the retrieval results obtained using three different similarity based screening models. The first screening system was based on the tanimoto (TAN) coefficient which has been used for ligand-based virtual screening for many years and has been considered as a reference standard. The second model was based on the basic BIN (Abdo and Salim, 2011), that uses the Okapi (OKA) weight which found to perform the best in their experiments, which we shall refer to as conventional BIN model. The third model, our proposed model, is BIN based on feature selection model which we shall refer to as BINFS model. In what follows, we give a brief description of each one of these three models.
Tanimoto-based similarity model: Tanimoto used the
continuous form of the tanimoto coefficient, which is applicable to non-binary data of fingerprint. SK,L is the similarity between objects or molecules K and L using Tanimoto is given by Eq. 1:
M jk jl j 1
kL M M M
2 2
jk jl k jl
j 1 j 1 j 1
w w S
(w ) (w ) (w w ) =
= = =
=
+ −
∑
∑
∑
∑
(1)For molecules described by continuous variables, the molecular space is defined by an M×N matrix, where entry wji is the value of the jth feature (1 ≤ j ≤ M) in the ith molecule (1 ≤ i ≤ N). The origins of this coefficient can be found in a review paper.
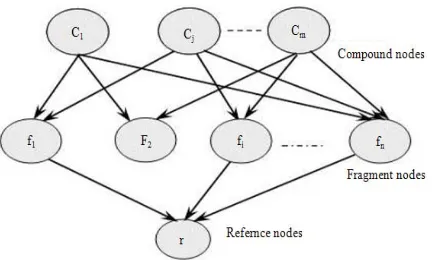
Conventional BIN model: The conventional Bayesian
inference network model, shown in Fig. 1 is used in molecular similarity searching. It consists of three types of nodes: compound nodes as roots, fragment nodes and a reference structure node as leaf. The roots of the network are the nodes without parent nodes and the leaves are the nodes without child nodes. Each compound node represents an actual compound in the collection and has one or more fragment nodes as children. Each fragment node has one or more compound nodes as parents and one reference structure node as child (or more in case of multiple references are used). Each network node is a binary value, taking one of the two values from the set {true, false}. The probability that the reference structure is satisfied given a particular compound is obtained by computing the probabilities associated with each fragment node connected to the reference structure node. This process is repeated for the whole compounds in the database.
The resulting probability scores are used to rank the database in response to a bioactive reference structure in the order of decreasing probability of similar bioactivity to the reference structure.
To estimate the probability associating each compound to the reference structure, we need to compute the probability in the fragment and reference nodes. One particular belief function called OKA has the most effective recall (Abdo and Salim, 2011). This function was used to compute the probability in the fragment nodes and is given by Eq. 2:
ij OKA i
j ij
avg
i
ff bel (f ) (1 )
c ff 0.5 1.5
C m 0.5
log cf log(m 1.0)
= α + − α ×
+ + ×
⎡ + ⎤
⎢ ⎥
⎣ ⎦
× +
(2)
Where:
α = Constant and experiments using the Bayesian network show that the best value is 0.4 (Abdo and Salim, 2009; Chen et al., 2009)
ffij = Frequency of the ith fragment within jth compound reference structure
cfi = Number of compounds containing ith fragment
|cj| = The size (in terms of number of fragments) of the jth compound
|Cavg| = The average size of all the compounds in the database and m is the total number of compounds
To produce a ranking of the compounds in the collection with respect to a given reference structure, a belief function from In Query, specifically the SUM operator, was used. If p1, p2,..., pn represent the belief at the fragment nodes (parent nodes of r) then the belief at r is given by Eq. 3:
n i i 1 sum
p bel (r)
n =
=
∑
(3)Where:
n = The number of the unique fragments assigned to r reference structure
pi = Value of the belief function bel(fi) in ith fragment node
BIN model based on feature selection: This model of
BIN is based on using subset of molecule’s features. To achieve this objective, two steps were used. First, we prepare training data that consists of known active molecules queries and unknown molecules. For each activity class (for 1, 2 and DS3) 10 different sets of 10 active compounds were randomly selected as reference set (Query) and it was appended by 307548 unknown molecules as train data, so the size of training data is 307548 molecules and test data is 102516 molecules which represents either DS1, DS2 or DS3. This step was done for all activity classes for each data set separately. In each class we used different reference sets of 10 active compounds that belong to that class.
The second step is responsible for generating subset of molecule’s features. To achieve this goal, a classifier column (that required by features selection algorithms) is added, the value of this column is 1 for all first 10 rows (represent the reference queries) and 0 for the rest of rows (that represent the unknown compounds). This column represents the label or classifier that is used by feature selection algorithm. The train data is used as input to SPSS Celemtine software that implements Principle Component Analysis (PCA) features selection algorithm. The result of this step is a vector or row of selected feature numbers that we used as input to the main data set to rearrange the entire data based on it.
Experimental design: The searches were carried out
on the MDL Drug Data Report (MDDR) database. The 102516 molecules in the MDDR database were converted to Pipeline Pilot ECFC_4 fingerprints and folded to give 1024-element.
For the screening experiments, three datasets (DS1-DS3) were chosen (Hert et al., 2006) from the
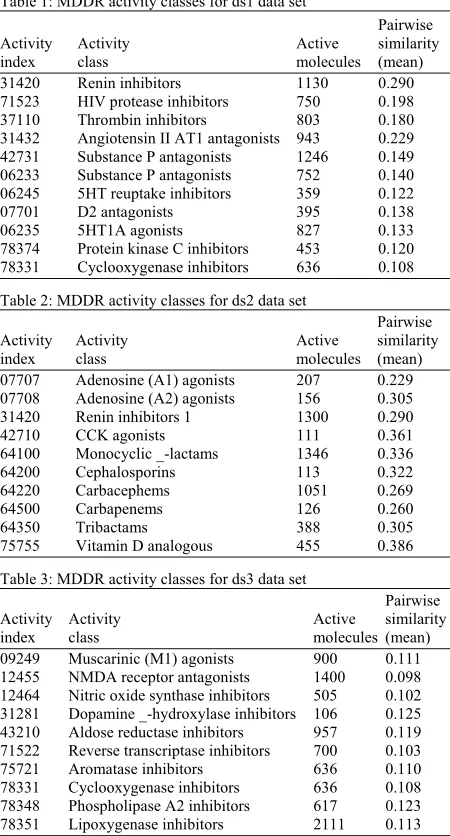
Table 1: MDDR activity classes for ds1 data set
Pairwise
Activity Activity Active similarity index class molecules (mean) 31420 Renin inhibitors 1130 0.290 71523 HIV protease inhibitors 750 0.198 37110 Thrombin inhibitors 803 0.180 31432 Angiotensin II AT1 antagonists 943 0.229 42731 Substance P antagonists 1246 0.149 06233 Substance P antagonists 752 0.140 06245 5HT reuptake inhibitors 359 0.122 07701 D2 antagonists 395 0.138 06235 5HT1A agonists 827 0.133 78374 Protein kinase C inhibitors 453 0.120 78331 Cyclooxygenase inhibitors 636 0.108 Table 2: MDDR activity classes for ds2 data set
Pairwise
Activity Activity Active similarity index class molecules (mean) 07707 Adenosine (A1) agonists 207 0.229 07708 Adenosine (A2) agonists 156 0.305 31420 Renin inhibitors 1 1300 0.290 42710 CCK agonists 111 0.361 64100 Monocyclic _-lactams 1346 0.336 64200 Cephalosporins 113 0.322 64220 Carbacephems 1051 0.269 64500 Carbapenems 126 0.260 64350 Tribactams 388 0.305 75755 Vitamin D analogous 455 0.386 Table 3: MDDR activity classes for ds3 data set
Pairwise
Activity Activity Active similarity index class molecules (mean) 09249 Muscarinic (M1) agonists 900 0.111 12455 NMDA receptor antagonists 1400 0.098 12464 Nitric oxide synthase inhibitors 505 0.102 31281 Dopamine _-hydroxylase inhibitors 106 0.125 43210 Aldose reductase inhibitors 957 0.119 71522 Reverse transcriptase inhibitors 700 0.103 75721 Aromatase inhibitors 636 0.110 78331 Cyclooxygenase inhibitors 636 0.108 78348 Phospholipase A2 inhibitors 617 0.123 78351 Lipoxygenase inhibitors 2111 0.113
For each data set (DS1-DS3), the screening experiments were performed with 10 references structures selected randomly from each activity class and the similarity measure obtains activity score for all of its compounds. Then we sort these activity scores in a descending order and the recall of the active compounds provides a measure of the performance of our similarity method. By recall of active compound, we mean the percentage of the desired activity class compounds that are retrieved in the top 1 and 5% of the resultant sorted activity scores.
RESULTS
Our purpose is to identify different retrieval effectiveness of using different search approaches. In this study, we tested TAN, BIN and BINFS models on
Table 4: The recall is calculated using the top 1% and top 5% of the DS1 data sets when ranked using the TAN, BIN and BINFS
1% 5%
Activity --- --- Index TAN BIN BINFS TAN BIN BINFS 31420 55.84 74.08 75.83 85.49 87.61 88.38 71523 22.26 28.26 32.72 42.70 52.72 58.18 37110 12.54 26.05 29.44 24.11 48.20 54.09 31432 33.36 39.23 42.97 68.20 77.57 85.56 42731 16.24 21.68 21.63 32.81 26.63 30.38 06233 14.23 14.06 13.34 27.01 23.49 22.62 06245 10.06 6.31 5.73 22.90 14.86 15.50 07701 8.91 11.45 14.24 23.10 27.79 33.25 06235 11.87 10.84 12.76 24.54 23.78 27.66 78374 16.75 14.25 16.22 24.26 20.20 21.31 78331 8.05 6.03 5.7 16.83 11.80 10.71 avg 19.10 22.93 24.60 35.63 37.70 40.69 Shaded 4.00 1.00 6.00 5.00 0.00 6.00 cells
Table 5: The recall is calculated using the top 1% and top 5% of the DS2 data sets when ranked using the TAN, BIN and BINFS
1% 5%
Activity --- --- Index TAN BIN BINFS TAN BIN BINFS 07707 78.300 72.180 70.070 91.080 74.810 73.200 07708 74.010 96.000 95.680 88.520 99.610 99.740 31420 46.440 79.820 78.800 77.600 95.460 89.360 42710 57.220 76.270 66.250 67.590 92.550 93.650 64100 93.220 88.430 87.650 97.890 99.220 98.580 64200 63.390 70.180 74.210 89.820 99.200 88.480 64220 73.560 68.320 71.120 92.050 91.320 79.520 64500 60.750 81.200 80.020 74.980 94.960 93.840 64350 76.690 81.890 80.240 90.340 91.470 92.660 75755 95.990 98.060 97.650 98.780 98.330 95.150 avg 71.957 81.235 80.169 86.865 93.693 90.418 Shaded
cells 3.000 6.000 1.000 3.000 4.000 3.000 Table 6: The recall is calculated using the top 1% and top 5% of the
DS3 data sets when ranked using the TAN, BIN and BINFS 1% 5%
Activity --- --- Index TAN BIN BINFS TAN BIN BINFS 07707 25.090 15.330 22.600 40.210 25.720 25.070 07708 7.700 9.370 7.550 19.080 14.650 18.040 31420 9.020 8.450 10.420 14.560 16.550 25.730 42710 27.530 18.290 19.620 44.000 28.290 34.570 64100 11.100 7.340 11.450 26.370 14.410 13.460 64200 2.350 4.080 6.150 6.280 8.440 19.360 64220 24.020 20.410 22.350 28.970 30.020 34.050 64500 6.270 7.510 6.160 15.790 12.030 13.830 64350 4.690 9.790 10.600 13.160 20.760 23.280 75755 4.310 13.680 13.330 10.550 12.940 13.960 avg 12.208 11.425 13.023 21.897 18.381 22.135 Shaded cells 3.00 3.000 4.000 5.000 0.000 5.000
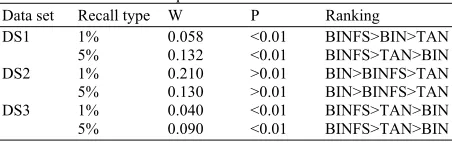
Table 7: Ranking of search model based on kendall W test results for DS1-DS3 Top 1 and 5%
Data set Recall type W P Ranking
DS1 1% 0.058 <0.01 BINFS>BIN>TAN 5% 0.132 <0.01 BINFS>TAN>BIN DS2 1% 0.210 >0.01 BIN>BINFS>TAN 5% 0.130 >0.01 BIN>BINFS>TAN DS3 1% 0.040 <0.01 BINFS>TAN>BIN 5% 0.090 <0.01 BINFS>TAN>BIN Table 8: Number of shaded cells for mean recall of actives using
different search models for 1-DS3 Top 1 and 5% Data set TAN BIN BINFS
Top 1%
DS1 4 1 6
DS2 3 6 1
DS3 3 3 4
Top 5%
DS1 5 0 6
DS2 3 4 3
DS3 5 0 5
The similarity method with the best recall rate in each row is strongly shaded and the recall value is boldfaced and the shaded cell results are listed in Table 7 (e.g., the results shown in the bottom rows of Tables 4-6 form the lower part of results in Table 8). The results of the Kendall analyses for (DS1-DS3) are reported in Table 7 and describe the top1% and top 5% ranking for the various search models.
DISCUSSION
Visual inspection of the recall values in Table 4-6 enables one to make comparisons between the effectiveness of the various search models. However, a more quantitative approach is possible using the Kendall W test of concordance (Siegel and Castellan, 1988). This test shows whether a set of judges make comparable judgments about the ranking of a set of objects; here, the activity classes were considered as judges and the recall rates of the various search models as objects. The output of such a test is the value of the Kendall coefficient and the associated significance level, which indicates whether this value of the coefficient could have occurred by chance. If the value is significant (for which we used cut-off values of 0.01 or 0.05) then it is possible to give an overall ranking of the objects that have been ranked.
In Table 7, the columns show the data set type, the recall percentage, the value of the coefficient, the associated probability and the ranking of the methods. Some of the activity classes may contribute disproportionally to the overall value of mean recall (e.g., low diversity activity classes). Therefore, using
the mean recall value as evaluation criterion could be impartial to some methods but not others. To avoid this bias, the effectiveness performance of different methods have been further investigated based on the total number of shaded cells for each method across the full set of activity classes, as shown in the bottom row of Table 4-6.
Inspection of DS1 search in Table 4 shows that BINFS produced the highest mean value compared to the TAN and BIN. In addition, according to the total number of shaded cells in Table 4, BINFS is the best performing search across the 11 activity classes in terms of mean recall.
Table 7 shows that the values of the Kendall coefficient, for DS1 (top1% and 5%) are 0.058 and 0.132 respectively and for DS3 (top1% and 5%) are 0.04 and 0.09 respectively, are significant at the 0.01 level of statistical significance. Given that the result is significant, we can hence conclude that the overall ranking of the different procedures is BINFS>BIN>TAN and BINFS>TAN>BIN for DS1 and BINFS>TAN>BIN for DS3. The good performance for BINFS method is not restricted to DS1 since it also gives the best results for the top 1 and 5% for DS3.
The DS3 searches are of particular interest since they involve the most heterogeneous activity classes in the three data sets used and thus provide a tough test of the effectiveness of a screening method, Table 6-7 show that BINFS gives the best performance of all the methods for this data set at both cutoffs.
CONCLUSION
This study has further investigated the enhancement of BIN using feature selection for ligand-based virtual screening. Simulated virtual screening experiments with MDDR data sets showed that the proposed techniques described here provide simple ways of enhancing the cost effectiveness of ligand-based virtual screening in chemical databases. Our experiments also showed that the increases in performances are particularly marked when the sought active are structurally diverse.
REFERENCES
Abdo, A. and N. Salim, 2009. Similarity-based virtual screening with a bayesian inference network. Chem. Med. Chem., 4: 210-218. PMID: 19072820 Abdo, A. and N. Salim, 2011. New fragment weighting
Abdo, A., B. Chen, C. Mueller, N. Salim and P. Willett, 2010. Ligand-based virtual screening using bayesian networks. J. Chem. Inf. Model., 50: 1012-1020. DOI:10.1021/ci100090p
Chen, B., C. Mueller and P. Willett, 2009. Evaluation of a Bayesian inference network for ligand-based virtual screening. J. Cheminf. DOI: 10.1186/1758-2946-1-5
Eckert, H. and J. Bajorath, 2007. Molecular similarity analysis in virtual screening: Foundations, limitations and novel approaches. Drug Discovery Today, 12: 225-233. DOI: 10.1016/j.drudis.2007.01.011
Feher, M., 2006. Consensus scoring for protein-ligand interactions. Drug Discovery Today, 11: 421-428. DOI: 10.1016/j.drudis.2006.03.009
Geppert, H., M. Vogt and J. Bajorath, 2010. Current trends in ligand-based virtual screening: molecular representations, data mining methods, new application areas, and performance evaluation. J. Chem. Inf. Model., 50: 205-216. DOI: 10.1021/ci900419k
Hert, J., P. Willett, D.J. Wilton, 2006. New methods for ligand-based virtual screening: Use of data fusion and machine learning to enhance the effectiveness of similarity searching. J. Chem. Inf. Model., 46: 462-470. DOI:10.1021/ci050348j Kearsley, S.K., S. Sallamack, E.M. Fluder, J.D. Andose
and R.T. Mosley et al., 1996. Chemical similarity
using physiochemical property descriptors. J. Chem. Inf. Comput. Sci., 36: 118-127. DOI: 10.1021/ci950274j
Leach, A.R. and V.J. Gillet, 2003. An Introduction to Chemoinformatics. 1st Edn., Springer, USA., ISBN-10: 1402062907, pp: 255.
Maldonado, A.G., J.P. Doucet, M. Petitjean and B.T. Fan, 2006. Molecular similarity and diversity in chemoinformatics: From theory to applications. Molecular Divers., 10: 39-79. DOI: 10.1007/s11030-006-8697-1
Miller, M.A., 2002. Chemical database techniques in drug discovery. Nat. Rev. Drug. Discov., 1: 220-227. DOI: 10.1038/nrd745
Sheridan, R.P. and S.K. Kearsley, 2002. Why do we need so many chemical similarity search methods? Drug Discovery Today, 7: 903-911. DOI: 10.1016/S1359-6446(02)02411-X
Sheridan, R.P., 2007. Chemical similarity searches: When is complexity justified. Expert. Opin. Drug Discovery, 2: 423-430. DOI: 10.1517/17460441.2.4.423
Sheridan, R.P., M.D. Miller, D.J. Underwood and S.K. Kearsley, 1996. Chemical similarity using geometric atom pair descriptors. J. Chem. Inf. Comput. Sci., 36: 128-136. DOI: 10.1021/ci950275b
Siegel, S. and N.J. Castellan, 1988. Nonparametric Statistics for the Behavioral Sciences. 2nd Edn., McGraw-Hill, USA., ISBN-10: 0070573573, pp: 399. Vogt, M., A.M. Wassermann and J. Bajorath, 2010.
Application of information-theoretic concepts in chemoinformatics. Information, 1: 60-73. DOI: 10.3390/info1020060
Walters, W.P., M.T. Stahl and M.A. Murcko, 1998. Virtual screening-an overview. Drug Discovery Today, 3: 160-178. DOI: 10.1016/S1359-6446(97)01163-X
Waszkowycz, B., T.D.J. Perkins, R.A. Sykes and J. Li, 2001. Large-scale virtual screening for discovering leads in the postgenomic era. IBM Syst. J., 40: 360-376. DOI: 10.1147/sj.402.0360
Willett, P., 2006. Enhancing the effectiveness of ligand-based virtual screening using data fusion. QSAR Comb. Sci., 25: 1143-1152. DOI: 10.1002/qsar.200610084