R E S E A R C H A R T I C L E
Open Access
Improving structural similarity based virtual
screening using background knowledge
Tobias Girschick
1, Lucia Puchbauer
1and Stefan Kramer
2*Abstract
Background: Virtual screening in the form of similarity rankings is often applied in the early drug discovery process to rank and prioritize compounds from a database. This similarity ranking can be achieved with structural similarity measures. However, their general nature can lead to insufficient performance in some application cases. In this paper, we provide a link between ranking-based virtual screening and fragment-based data mining methods. The inclusion of binding-relevant background knowledge into a structural similarity measure improves the quality of the similarity rankings. This background knowledge in the form of binding relevant substructures can either be derived by hand selection or by automated fragment-based data mining methods.
Results: In virtual screening experiments we show that our approach clearly improves enrichment factors with both applied variants of our approach: the extension of the structural similarity measure with background knowledge in the form of a hand-selected relevant substructure or the extension of the similarity measure with background knowledge derived with data mining methods.
Conclusion: Our study shows that adding binding relevant background knowledge can lead to significantly improved similarity rankings in virtual screening and that even basic data mining approaches can lead to competitive results making hand-selection of the background knowledge less crucial. This is especially important in drug discovery and development projects where no receptor structure is available or more frequently no verified binding mode is known and mostly ligand based approaches can be applied to generate hit compounds.
Keywords: Virtual screening, Structural similarity, Background knowledge, Data mining, Enrichment
Background
Medical needs are the starting point for every drug discov-ery and development project. Apart from the classicalin vitroandin vivostudies used in this process, pharmaceuti-cal research relies more and more onin silicomethods like (high throughput) virtual screening or molecular dock-ing simulations [1,2]. Computational methods promise to shorten the typically time-consuming efforts that come with the development of new market-approved drug compounds. In the early drug discovery process, vir-tual screening is used to rank or select compounds from huge databases of potential drug candidates that are later assessed in wet-lab and animal studies. In case one or more ligand structures of the target protein are known and
*Correspondence: [email protected] 2Johannes Gutenberg-Universität Mainz, Institut für Informatik, Staudingerweg 9, 55128 Mainz, Germany
Full list of author information is available at the end of the article
available, virtual screening based on ligand similarities can be used to calculate a ranking of candidate compounds in a database. This approach is applied if no binding mode of the reported ligands, as well as no X-ray or NMR structure of the protein target is available and receptor based approaches are not easily accessible. Yet even in these cases the virtual screening approach is certainly a valid orthogonal approach to derive interesting and promising structures and scaffolds for the drug discovery pipeline.
In this paper, we present a concept of how struc-tural similarity based methods used in virtual screening can be improved by integrating chemical background knowledge in the form of binding relevant or informa-tive structural elements. Improvement in this case means higher enrichment of chemical compounds related to the query compound in the similarity ranking of a com-pound database. Consequently, more potentially biolog-ically active and less potentially inactive compounds are
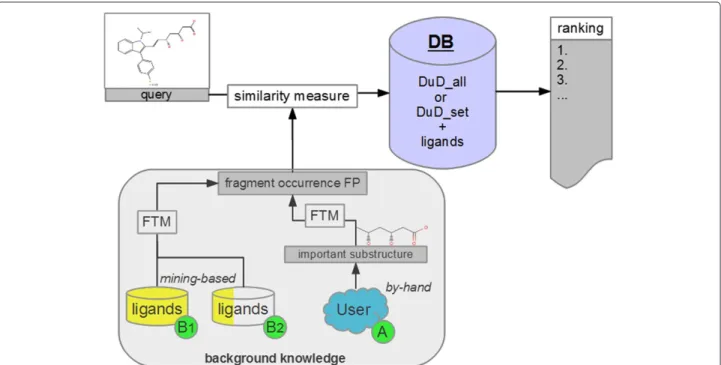
selected in virtual screening for further processing in the drug discovery pipeline (e.g. in vitro, in vivo). To achieve an improved enrichment we extract binding rel-evant substructures from known ligands and transform them into a fingerprint. This fingerprint is then used to extend a structural similarity measure. We present two approaches to extract the binding relevant informa-tion: first we use visual inspection of a known ligand as well as literature review to identify binding relevant sub-structures, second we test a relatively basic data mining approach. We apply the Free Tree Miner (FTM) soft-ware [3] that takes a set of two-dimensional chemical structures as input. FTM mines for and returns all sub-structures that occur frequently (more often than a user defined minimum support threshold) in the given set. These relevant substructures are then fragmented and the fragments’ occurrences in a chemical structure are used as bits in a binary occurrence fingerprint. A limitation of the data mining based approach is the need for more than one known ligand (active compound). An advantage of the approach is that it can still be applied if no liter-ature information on the binding relevant substructures or structural patterns is available and that it saves human effort.
In our experiments we extend two structural similar-ity measures with background knowledge and apply them to rank compounds in a database according to their sim-ilarity to a known active structure. The first simsim-ilarity measure is based on the size of the maximum com-mon substructure (MCS – e.g., Raycom-mond et al. [4]) of two molecules, the second is based on Extended Con-nectivity Fingerprints (ECFP) [5]. No other factors like drug-likeness, Cytochrome P450 interaction or physico-chemical properties are used. This enables an isolated view on the effects of the similarity methods used for the rankings. The extended similarity measures are compared to their non-extended versions to assess their perfor-mance by calculating enrichment factors for 1%, 5% and 10% of the database.
We show that adding background knowledge on important binding components of ligands to both, the MCS similarity and the ECFP similarity, changes the virtual screening ranking in such a way that the top structures have improved docking scores, related struc-tures are ranked at better positions and clearly improved enrichment factor values are obtained. We also show that replacing the visual inspection and literature search by a data mining approach improves the similarity rankings for most assessed data sets. The data mining approach performs slightly weaker than the by-hand approach, but gives competitive results.
The remainder of the paper is organized as follows: In the next section we give detailed information on the data and methods we use for the similarity calculations and
our experimental setup. This is followed by a presenta-tion and discussion of our results before we conclude. Additional result tables can be found in the Additional file 1.
Materials and methods
In this section we give detailed information on our experi-mental setting, on how we extend a similarity measure and on the data sources and evaluation measures used in our virtual screening experiments.
Experimental setup
When virtual screening by means of similarity ranking is performed in a drug discovery project, the similarities of all compounds in the screening database are calcu-lated with respect to one or more known ligands of the protein target (used as reference compounds). The com-pounds in the database are subsequently sorted according to their similarity scores in descending order so that the compounds most similar to the reference appear first in the ranking. A good similarity measure will find struc-tures that are related to the reference – or that potentially interact with the target protein – in the first few per-cent of the list. To assess the performance of different similarity measures we mix a set of known ligands into a set of decoys to form a screening database. As ref-erence compound for the similarity rankings we use a randomly selected representative of the known ligands. After applying the standard similarity ranking proce-dure individually with each similarity measure, we can evaluate the performance of the similarity measures by examining the results for the known ligands in the screen-ing database. The better a similarity measure is, the more known ligands will be in the top section of the ranking.
The experiments on extending a structural similarity measure can be divided into two lines of experiments: line “A” considers the by-hand selection of the binding relevant information that is used to extend the similarity measure
Table 1 Overview of the steps necessary to apply the two presented approaches to extend similarities
Step A: by-hand approach B: mining-based approach
1 Review literature/examine structure Calculate frequently occurring
to determine BI substructures (BI) in known
ligands with FTM
2 Fragment relevant substructure Build fingerprint from
and build binary occurrence frequently occurring
fingerprint from all fragments substructures
3 Rank DB withsimext Rank DB withsimext
Table 2 Overview of the used DuD data sets
Protein PDB code Ligands Decoys Protein class minsup fp_length
HMGR [PDB:1HW8] 35 1242 other enzyme 0.9 66
ER [PDB:3ERT] 39 1399 nuclear hormone receptor 0.7 62
PPARγ [PDB:1FM9] 81 2910 nuclear hormone receptor 0.96 90
P38 MAP [PDB:1KV2] 234 8399 kinase 0.83 57
TK [PDB:1KIM] 22 785 kinase 0.9 74
FXa [PDB:1F0R] 142 5102 serine protease 0.8 81
ADA [PDB:1STW] 23 822 metalloenzyme 0.8 70
DHFR [PDB:3DFR] 201 7150 folate enzyme 0.8 70
AChE [PDB:1EVE] 105 3732 other enzyme 0.77 93
COX-2 [PDB:1CX2] 349 12491 other enzyme 0.6 65
Overview of the used DuD data sets.minsupgives the minimum support parameter used in the FTM calculations andfp_lengththe length of the resulting fingerprint.
and line “B” considers the data mining based selection of this information.
Table 1 shows a comparison of the steps necessary to apply the two presented approaches to extend similarity measures and rank a screening database.
Extended similarity
The extended similarity measures proposed in this work are constructed from two building blocks: a structural similarity measure used as base simililarity (simbase) and
a fingerprint-based similarity that is based on the bind-ing relevant substructures (simbind_fp). After defining the
extended similarity measure we will first explain the
base similarities and second explain the two variants used to derivesimbind_fp. Theextended similarityof two moleculesaandbis defined as:
simext(a,b)=1−αsimbase(a,b)+αsimbind_fp(a,b),
(1)
wheresimbind_fp(a,b)gives the Tanimoto similarity
coef-ficient (for a mathematical definition see the Additional file 1) of two binary sub-structural occurrence finger-prints of moleculesaandb.
For most experiments we choose α = 13 as weight coefficient for the fingerprint-based part arbitrarily and
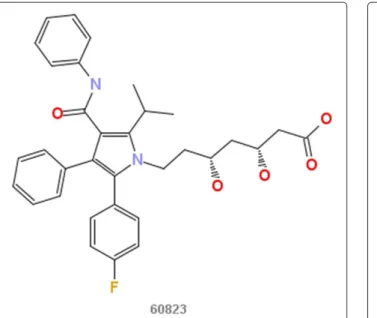
Figure 2Atorvastatin.2D structure depiction of Atorvastatin (PubChem CID 60823).
motivated by the wish to weight the base similarity higher than its extension. No optimization regarding this parameter has been attempted, however we show a short evaluation of α in the Results and discussion section. In our experiments the substructures constitut-ing the fconstitut-ingerprint for simbind_fp are selected by visual inspection and literature review or by a data mining approach.
The first structural similarity measure (simbase) that we
extend is based on the notion of maximum common sub-structures (MCS). For computation of the size of the MCS
Figure 3Fluvastatin.2D structure depiction of Fluvastatin (PubChem CID 446155), the binding relevant substructure is marked.
Figure 4Lovastatin.2D structure depiction of Lovastatin (PubChem CID 53232).
of two molecular structures, the JChem Java classes were used (JChem 5.4.0.0, ChemAxon (http://www.chemaxon. com)). The similarity between two structures was then calculated with the similarity measure proposed by Wallis et al.[6]:
simMCS(a,b)= |
mcs(a,b)|
|a| + |b| − |mcs(a,b)|, (2) where |·| gives the number of vertices in a graph, and mcs(a,b)calculates the MCS of moleculesaandb. Con-sequently,|mcs(a,b)|is the number of atoms of the MCS of molecules a and b. The second structural similarity measure is based on Extended-Connectivity Fingerprints (ECFP) [5], a standard method in pharmaceutical research and industry. ECFP fingerprints are circular, structural feature fingerprints that use as input information not only the atom and bond type, but the six atom number-ing independent Daylight atomic invariants [7] to encode atoms: the number of immediate heavy atom neighbors, the valence minus the number of hydrogens, the atomic number, the atomic mass, the atomic charge, the number of attached hydrogens, plus a seventh invariant added by Rogerset al.[5]: whether the atom is contained in at least one ring. These fingerprints are available via the RDKit functionality of the open source cheminformatics soft-ware AZOrange [8]. The radius parameter for the ECFP fingerprint calculation was used at the default value of r=2. The fingerprint similarity of two ECFP fingerprints is calculated with the Dice coefficient (for a mathematical definition see the Additional file 1).
Our first approach (approach A) to extendsimbaserelies
on literature review or visual inspection of a set of known ligands to retrieve a binding relevant substructure (or fragment). Once such a substructure is known we apply the Free Tree Miner [3] software without minimum fre-quency constraint to produce all possible fragments of the substructure. From these fragments we build a binary
Figure 6Pitavastatin.2D structure depiction of Pitavastatin (PubChem CID 24848419).
occurrence fingerprint that is used to encode the reference molecules and all database molecules. The fingerprints are then used to calculatesimbind_fp. In our experimen-tal evaluation of approach A on the HMGR data set, we derive the binding relevant substructure not only by lit-erature review (which would be the standard approach and sufficient in most cases), but we support the pro-cess by additional calculations. First, we use the MCS similarity measure to rank the screening database. Subse-quently, the top 25 compounds of the similarity ranking are docked to the HMGR receptor. The examination of the results in combination with the literature review is used to derive the binding relevant structural parts that are used as background knowledge. For the second data set used to evaluate approach A (PPARγ) we derive the bind-ing relevant stubstructure from reviewbind-ing known ligands from the DrugBank [9] database. We expect the PPARγ hand-selection experiments to show less improvement than those on HMGR as the binding relevant information is selected with less effort.
In our second approach to extend simbase, the data
mining based approach - denoted approach B, we try to substitute the by-hand selection of the additional knowl-edge that is integrated into the similarity measure by applying data mining techniques. To retrieve the substruc-ture fingerprint used for the similarity measure extension we calculate the set of frequently occurring substructures
Figure 8Selected HMGR ligand binding poses.Only the active site of the receptor is shown.A: Fluvastatin receptor binding. Original position of fluvastatin in the HMGR ([PDB:1HWI]) receptor. The hand-selected important fragment is marked in yellow.B: Best docking of best MCS similarity search hit in the HMGR ([PDB:1HWI]) receptor.C: Best docking of best MCSextsimilarity search hit in the HMGR ([PDB:1HWI]) receptor.
from a set of known ligands with the FTM algorithm. From those frequent substructures we build the binary occurrence fingerprint used to encode our molecules and used to calculatesimbind_fp. Two variant of input ligand
sets are tested: (B1) We use all available ligands for the generation of the fingerprint fragments. The minimum support parameter (minsup) for the FTM software was chosen in such a way for each data set that it resulted in approximately the same number of substructural features as the fingerprint of approach A did (57 features). The parameters are given in Table 2. This ensures that we can exclude the lenght of the fingerprint (feature number) as driving force of improvement or degradation. (B2) We use only 10% (20% in case of the DuD HMGR, ADA and TK data sets) of the ligand compounds randomly chosen from the respective DuD ligand sets to work with a more real-istic setting, where only few compounds interacting with the protein are known in advance. The minimum sup-port parameter of FTM was set to 0.9 for all data sets. This second, reduced variant provides less information on the ligands to be found in the ranking and consequently poses a more realistic but harder problem. The result-ing enrichment factor values of the extended similarity measures should show less improvement over the non-enxtended versions compared to the first variant that uses all ligands.
For a graphical overview of the two extension ap-proaches as well as how they interact with the base-line similarity ranking please see Figure 1.
Data
In the first line of experiments (by-hand selection) we use only two data sets for our analysis, in line two of the exper-iments (data mining based extension) we use ten data sets from the Directory of useful Decoys (DuD) [10] as well as 25 ChEMBL activity class data sets [11]. We use dif-ferent database setups in our evaluation: For experiments with the DuD data sets we use either all 95,000 decoy structures of the DuD (DuDall) or only those DuD decoys
as database that were designed especially for the target
ligand system considered (DuDset). For the experiments
with the ChEMBL activity classes we use a subset of the ZINC [12] database.
HMGR and statins
In our approach A experiments we first consider the prob-lem of inhibition of the enzyme HMG-CoA reductase (HMGR). Well-known inhibitors of HMGR are chemi-cals from the drug class of statins (HMG-CoA reduc-tase inhibitors). Most of them are marketed drugs or drugs under development. Inhibition of HMGR lowers the cholesterol levels and prevents cardiovascular diseases [13], which are a major problem in developed countries as coronary artery disease affects 13 to 14 million adults in the United States alone [14]. The statins are struc-turally quite similar as can be seen in Figures 2, 3, 4, 5, 6 and 7. All of them are competitive inhibitors of HMGR with respect to binding of the substrate HMG-CoA, but not with respect to binding of NADPH [15]. The protein receptor used in the docking procedure is the structure of HMGR co-crystallized with fluvas-tatin (Figure 8, CID 446155), which is available in the PDB [16] with identifier [PDB:1HWI] [17]. We use two sets of known ligands that are mixed with the decoys and provide the reference compound in this first set of experiments: first the set of statins and second
Table 3 PPARγmarket approved drugs
DrugBank ID Drug name
DB01393 Bezafibrate
DB01067 Glipizide
DB01050 Ibuprofen
DB00244 Mesalazine
DB00795 Sulfasalazine
DB01014 Balsalazide
DB00412 Rosiglitazone
DB01132 Pioglitazone
Figure 9PPARγapproved active drugs.Eight DrugBank listed PPARγactive drugs that have “approved” status. The DrugBank ID is shown with the molecule.
the HMGR ligands provided by the DuD HMGR data set. In case the statins are used as ligand set, we repeat the experiment with each statin as query com-pound, otherwise we randomly select ten DuD HMGR ligands and use each one of those as query com-pound.
PPARγ
In addition to HMGR we test the by-hand selection approach on the PPARγ data set. The PPARγ recep-tor binds peroxisome proliferarecep-tors such as hypolipi-demic drugs and fatty acids. Once activated by a ligand, the receptor binds to a promoter element in the gene for acyl-CoA oxidase and activates its transcription. It therefore controls the peroxisomal beta-oxidation path-way of fatty acids and is a key regulator of adipocyte
Table 4 Results of the docking run (MCS top 25)
Rank CID Score RankMCS RankMCS
1 60823 -10.564 2 -1
2 ZINC02336737 -5.808526 13 -11
3 ZINC00026851 -5.699634 19 -16
4 ZINC00588719 -5.568737 11 -7
5 ZINC00599752 -5.46502 5 0
6 ZINC00588053 -5.463745 16 -10
7 ZINC00864379 -5.291673 15 -8
8 ZINC01253780 -5.211104 14 -6
9 ZINC00714466 -5.149133 9 0
10 ZINC00588723 -5.14689 4 6
Results of the docking run (MCS top 25).Rank=Rankdocking−RankMCS. A negativeRankvalue means, in the MCS similarity the compound is ranked lower, a positiveRankthat it is ranked higher than by the docking procedure. For the complete table, refer to Additional file 1: Table S1.
Figure 10ZINC26851.2D structure depiction of ZINC26851 from the MCS similarity ranking. Rank difference:Rank= −16.
Figure 12ZINC714466.2D structure depiction of ZINC714466 from the MCS similarity ranking. Rank difference:Rank=0.
Figure 13ZINC4628438.2D structure depiction of ZINC4628438 from the MCS similarity ranking. Rank difference:Rank=11.
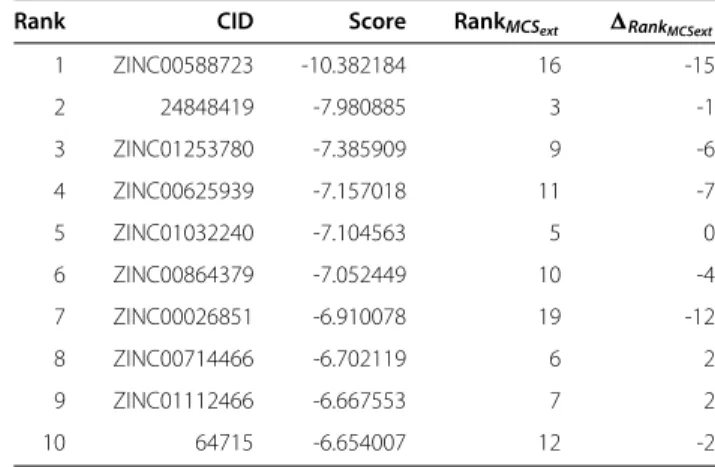
Table 5 Results of the docking run (MCSexttop 25)
Rank CID Score RankMCSext RankMCSext
1 ZINC00588723 -10.382184 16 -15
2 24848419 -7.980885 3 -1
3 ZINC01253780 -7.385909 9 -6
4 ZINC00625939 -7.157018 11 -7
5 ZINC01032240 -7.104563 5 0
6 ZINC00864379 -7.052449 10 -4
7 ZINC00026851 -6.910078 19 -12
8 ZINC00714466 -6.702119 6 2
9 ZINC01112466 -6.667553 7 2
10 64715 -6.654007 12 -2
Results of the docking run (MCSexttop 25).Rank=Rankdocking−RankMCS or ECFP. A negativeRankvalue means, in the extended similarity the compound is ranked lower, a positiveRankthat it is ranked higher than by the docking procedure. For the complete table, refer to Additional file 1: Table S1.
differentiation and glucose homeostasis [18]. The Drug-Bank [9] database lists - amongst others - these eight drugs that are market approved and known PPARγ interactors: Bezafibrate, Glipizide, Ibuprofen, Mesalazine, Sulfasalazine, Balsalazide, Rosiglitazone and Pioglitazone. An overview of the drugs, their DrugBank IDs and struc-tures are given in Table 3 and Figure 9.
We use the same query and database set-up as with the HMGR experiments.
Directory of useful decoys
As database for the approach B experiments, we use the Directory of useful Decoys that is designed to avoid bias in docking and screening studies. The DuD database consists of more than 95,000 decoy structures and 2,950 ligand structures (more than 30 decoy structures per ligand) for 40 protein targets including HMGR. We chose eight target structures from the DuD database in addition to HMGR and PPARγ. The original forty DuD target sets are grouped into six classes: nuclear hormone receptors, kinases, serine proteases, metalloenzymes, folate enzymes and other enzymes. We selected the additional protein targets to cover all six classes: estrogen receptor (ER; antagonists) from the class of nuclear hormone recep-tors, p38 mitogen-activated protein kinase (P38 MAP) and thymidine kinase (TK) for the class of kinases, fac-tor Xa (FXa) for the class of serine proteases, adenosine deaminase (ADA) for the class of metalloenzymes, dihy-drofolate reductase (DHFR) for the class of folate enzymes and the acetylcholine esterase (AChE) as well as cyclooxy-genase 2 (COX-2) for the remaining “other enzyme” class. An overview of the DuD data sets used in this study is given in Table 2. For DHFR three and for FXa two ECFP similarities could not be calculated due to software problems (the applied RDKit software was not able to pro-cess those molecules). The respective compounds were removed from the experimental setting. For this second set of experiments we randomly select ten of the ligands as reference compounds and mix the remaining ligands with the decoys. This procedure is repeated ten times.
Figure 15ZINC1112466.2D structure depiction of ZINC1112466 from the extended MCS similarity ranking (MCSext). Rank difference: Rank=2.
ChEMBL activity classes
To strengthen the findings on the mining-based exper-iments with the DuD data sets we add another set of compound data sets compiled by Li and Bajorath [11]. They selected compounds by activity class from the ChEMBL database (ChEMBL level 9) with restrictions to the reported potency values (at least 10μM) and the con-tained number of distinct Bemis and Murcko scaffolds [19] (at least 3). After evaluation they report 50 activity classes as test cases for benchmark calculations. We use 25 (random selection) of those 50 activity classes (actu-ally 49 – activity class 168 only provides one ligand and is therefore removed) as ligand sets. We randomly select ten ligands per activity class (or all available if the number of compounds in the activity class is smaller than ten). As background database we randomly select a set of 100,000 compounds from the ZINC [12] “All Purchasable” data set. For this set of experiments we randomly select one of the ligands as reference compound and mix the remaining ligands with the decoys. This procedure is repeated ten times.
Evaluation measures
To evaluate the performance of the similarity measures, we consider the enrichment factor (EF) [20] that is achieved by a virtual screening. The enrichment factor
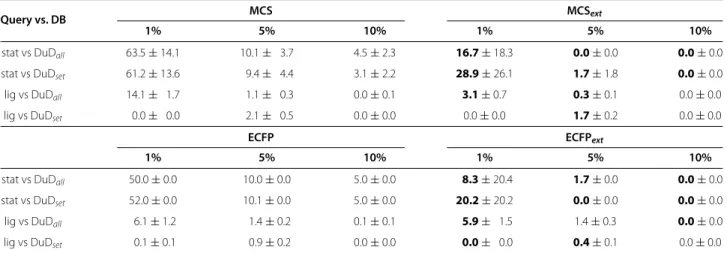
Table 6EFvalues for HMGR
Query vs. DB MCS MCSext
1% 5% 10% 1% 5% 10%
stat vs DuDall 63.5±14.1 10.1± 3.7 4.5±2.3 16.7±18.3 0.0±0.0 0.0±0.0
stat vs DuDset 61.2±13.6 9.4± 4.4 3.1±2.2 28.9±26.1 1.7±1.8 0.0±0.0
lig vs DuDall 14.1± 1.7 1.1± 0.3 0.0±0.1 3.1±0.7 0.3±0.1 0.0±0.0
lig vs DuDset 0.0± 0.0 2.1± 0.5 0.0±0.0 0.0±0.0 1.7±0.2 0.0±0.0
ECFP ECFPext
1% 5% 10% 1% 5% 10%
stat vs DuDall 50.0±0.0 10.0±0.0 5.0±0.0 8.3±20.4 1.7±0.0 0.0±0.0
stat vs DuDset 52.0±0.0 10.1±0.0 5.0±0.0 20.2±20.2 0.0±0.0 0.0±0.0
lig vs DuDall 6.1±1.2 1.4±0.2 0.1±0.1 5.9± 1.5 1.4±0.3 0.0±0.0
lig vs DuDset 0.1±0.1 0.9±0.2 0.0±0.0 0.0± 0.0 0.4±0.1 0.0±0.0
EFvalue for all four similarity methods for the hand-selection experiments with HMGR at 1%, 5% and 10% of the database. Improvements compared to the non-extended variant are marked in bold print. stat = statines.
reflects the amount of known related structures in the first x% of the ranked database. In practice, often only the highest ranked compounds are of interest and con-sidered further in the drug discovery pipeline. The enrichment factor is defined for certain fractions of the database:
EF(%)= (Nactive(%)/N(%)) (Nactive/Nall)
, (3)
whereEF(%)is given for the specified percentage of the ranked database,Nactive(%) is the number of active com-pounds in the selected subset of the ranked database,N(%) is the number of compounds in the subset,Nactive is the
number of active molecules in the data set andNallis the
number of compounds in the database. For an easier inter-pretation of the EF values, it is helpful to compare them to the maximum possible enrichment at the specified fraction of the database:
For easier comparison we do not use the EF(%) directly, but the difference of maximum possible enrichment and achieved enrichment:
EF =EFmax−EF(%). (4)
Keep in mind that forEF smaller values are better and
the optimalEF is zero. In our study, we use the top 1%,
5% and 10% fractions of the ranked database to calculate the EF values. In the results section of this work we restrict ourselves to showing theEF values.
Docking procedure
Molecular docking was applied in order to assess if the extensions to the structural similarity measures are suit-able for virtual screening. For the HMGR experiments we did the docking ourselves, for the second experiment we used the docking scores as provided in the DuD database.
We now describe the docking procedure applied in the by-hand HMGR experiment.
Figure 18PPARγbinding relevant substructures.Binding relevant substructures used for calculating the bind_fp fingerprint for the PPARγ
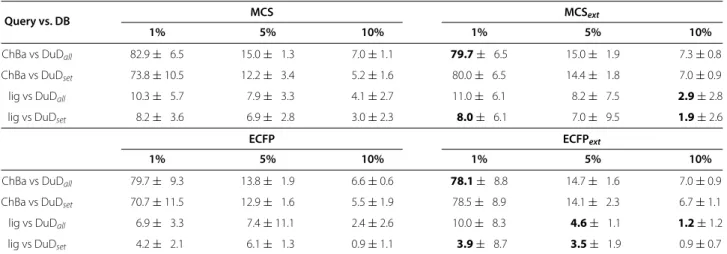
Table 7EFvalues for PPARγ
Query vs. DB MCS MCSext
1% 5% 10% 1% 5% 10%
ChBa vs DuDall 82.9± 6.5 15.0± 1.3 7.0±1.1 79.7± 6.5 15.0± 1.9 7.3±0.8
ChBa vs DuDset 73.8±10.5 12.2± 3.4 5.2±1.6 80.0± 6.5 14.4± 1.8 7.0±0.9
lig vs DuDall 10.3± 5.7 7.9± 3.3 4.1±2.7 11.0± 6.1 8.2± 7.5 2.9±2.8
lig vs DuDset 8.2± 3.6 6.9± 2.8 3.0±2.3 8.0± 6.1 7.0± 9.5 1.9±2.6
ECFP ECFPext
1% 5% 10% 1% 5% 10%
ChBa vs DuDall 79.7± 9.3 13.8± 1.9 6.6±0.6 78.1± 8.8 14.7± 1.6 7.0±0.9
ChBa vs DuDset 70.7±11.5 12.9± 1.6 5.5±1.9 78.5± 8.9 14.1± 2.3 6.7±1.1
lig vs DuDall 6.9± 3.3 7.4±11.1 2.4±2.6 10.0± 8.3 4.6± 1.1 1.2±1.2
lig vs DuDset 4.2± 2.1 6.1± 1.3 0.9±1.1 3.9± 8.7 3.5± 1.9 0.9±0.7
EFvalue for all four similarity methods for the hand-selection experiments with PPARγat 1%, 5% and 10% of the database. Improvements compared to the non-extended variant are marked in bold print. ChBa = ChemBank ligands.
Table 8 MeanEFand standard deviation for the MCS and MCSextsimilarity methods (approach B1)
DuD set MCS MCSext
1% 5% 10% 1% 5% 10%
HMGR 8.5± 4.5 7.0± 6.8 2.8±3.6 4.6± 9.8 2.0± 1.0 0.5±0.3
ER 13.6± 7.6 12.6± 4.1 5.3±1.7 13.1± 7.0 11.4± 2.8 3.7±0.9
PPARγ 4.6±10.6 1.2± 5.4 1.7±2.8 4.6±11.0 3.8± 5.5 1.5±2.9
P38 MAP 9.6± 7.9 8.6± 3.7 3.3±1.8 3.8± 5.4 4.8± 4.2 2.4±2.1
TK 20.1± 4.4 12.6± 2.1 5.1±1.6 18.3± 5.3 12.3± 2.7 4.0±1.3
FXa 4.6±11.2 7.6± 3.8 3.3±1.8 3.5±11.0 6.4± 4.6 2.5±2.5
ADA 10.1± 6.4 8.2± 3.0 4.3±3.6 9.2± 4.8 7.7±2.0 2.3±0.8
DHFR 10.9±10.6 11.7± 2.9 4.7±1.1 3.1± 5.0 0.3±0.3 0.0±0.0
AChE 10.3±12.5 11.3± 4.7 4.8±2.5 10.0±11.8 9.5±5.8 4.4±3.0
COX-2 12.3± 9.2 11.7± 2.2 5.3±1.1 10.7±10.3 10.1± 3.8 2.2±2.6
w/d/l 10/ 0 / 0 9/ 0 / 1 10/ 0 / 0
MeanEFand standard deviation for the MCS and MCSextsimilarity methods at 1%, 5% and 10% of the database (receptor specific decoy set DuDset). The extension
fingerprint is calculated from all ligands (approach B1). Improvements of MCSextcompared to MCS are marked with bold print. w/d/l = wins/draws/losses.
Table 9 MeanEFand standard deviation for the ECFP and ECFPextsimilarity methods (approach B1)
DuD set ECFP ECFPext
1% 5% 10% 1% 5% 10%
HMGR 8.7± 9.4 6.8± 8.5 4.2± 5.6 0.0± 0.0 2.8± 2.2 0.9±0.5
ER 8.0± 4.0 7.4± 3.9 6.7± 4.6 6.3± 4.8 9.2± 1.6 3.3±1.2
PPARγ 1.3± 0.7 7.1±11.2 1.0± 0.7 4.2±11.1 3.6± 5.7 1.8±2.8
P38 MAP 7.0± 5.9 5.9± 3.0 3.4± 2.0 2.8± 5.7 5.0± 4.1 2.4±2.1
TK 9.8± 6.0 12.1± 8.9 10.9± 6.4 16.5± 8.4 11.4± 3.6 4.3±2.0
FXa 7.4±11.3 2.4± 2.0 1.7± 1.5 3.5±11.0 4.3± 5.3 2.0±2.7
ADA 6.3± 3.3 6.4± 4.5 8.9± 6.0 8.3± 7.1 7.7± 2.0 2.4±1.0
DHFR 2.5± 2.0 1.8± 1.5 1.8± 1.5 1.9± 0.9 0.1± 0.1 0.0±0.0
AChE 15.0±11.2 5.2± 2.3 6.8± 3.8 11.0±12.0 9.4± 5.6 4.0±2.8
COX-2 8.7±10.6 3.4± 1.9 3.4± 2.5 6.7±10.0 5.5± 5.0 2.1±2.6
w/d/l 7/ 0 / 3 5/ 0 / 5 8/ 0 / 2
MeanEFand standard deviation for the ECFP and ECFPextsimilarity methods at 1%, 5% and 10% of the database (receptor specific decoy set DuDset). The extension
Table 10 MeanEFand standard deviation for the bind_fp
similarity method (approach B1)
DuD set Bind_fp
1% 5% 10%
HMGA 6.7±1.5•◦ 1.1±0.0•◦ 0.6±0.0•◦
ER 62.3±15.2 8.7±4.1◦ 2.7±1.6•◦
PPARγ 13.2±30.1 2.4± 6.1 1.2±3.0◦
P38 MAP 24.2±22.2 4.8±4.3◦ 2.4±2.1•◦
TK 42.8±24.3 0.9±1.5•◦ 0.0±0.0•◦
Fxa 21.2±26.9 3.8±5.5◦ 1.8±2.7◦
ADA 26.1± 0.0 1.7±0.0•◦ 0.5±0.1•◦
DHFR 0.0±0.0•◦ 0.0±0.0•◦ 0.0±0.0•◦
AchE 47.4±34.8 7.7±6.0◦ 3.8±3.0•◦
COX-2 71.6±22.6 10.2±6.3◦ 2.2±2.6•◦
MeanEFand standard deviation for the bind_fp similarity method at 1%, 5% and 10% of the database (receptor specific decoy set DuDset). The extension
fingerprint is calculated from all ligands (approach B1). Cases where bind_fp is better than ECFP or MCS are marked with a•or◦, respectively.
which lacks ADP. In order to speed up the docking pro-cedure, the multi-mer was simplified by removing the redundant chains A and B. The receptor preparation was completed by the manual removal of all waters, the ligand molecule and the ADPs of the other binding site formed by chain C and D. The selected drug candidates were pre-pared using Ligprep 2.5. In a preprocessing step of the docking procedure the receptor grid for the chosen bind-ing site was pre-calculated usbind-ing the Glide 5.7 Receptor Grid Generation. The co-crystallized fluvastatin in the chosen binding site was used as reference ligand. Subse-quently the rigid receptor docking was performed with
the extra precision mode of the Glide 5.7 Ligand Docking application.
Results and discussion By-hand experiments
In the first set of experiments we extract the binding-relevant knowledge used to extend the structural sim-ilarity measures by literature review and support the process by MCS similarity ranking and docking calcula-tions. We therefore rank the screening database (including decoys and statin ligands) with respect to fluvastatin using simMCS. Subsequently, we docked the top 25 compounds
of the similarity ranking to the HMGR receptor. Looking at the docking results in Table 4 (and the long version in the Additional file 1: Table S1), it can be seen that only one compound (CID 60823) has a good docking score. This is atorvastatin, one of the two statins found in the top 25 of the MCS similarity ranking. All other compounds have rather weak docking scores. Four structures from this ranking are shown in Figures 10, 11, 12, 13 and the docking of the best non-statin is shown in Figure 8B. It can clearly be seen that the highlighted part of the struc-ture of fluvastatin (Figure 3 and Figure 8A) or something structurally similar, is not present in any of the structures (non-statins). According to Istvan et al. [17], this part mimics the original binding ligand and consequently is essential for binding. The hydrophobic part of the statins is responsible for the nano-molar affinity of the statins but not sufficient for inhibitory binding on its own. Tak-ing those facts into consideration, we decided to use the highlighted hydrophilic part of fluvastatin as background knowledge in our study. As described in the Materials and methods Section, the substructure was fragmented and
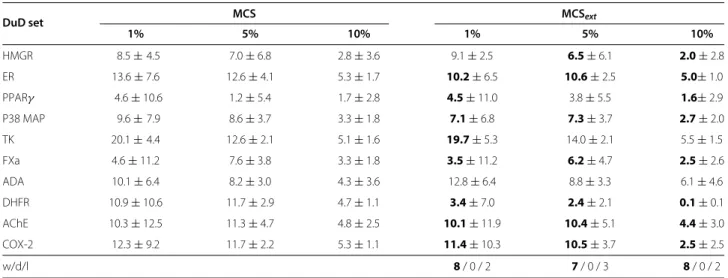
Table 11 MeanEFvalues and standard deviations for the MCS and MCSextsimilarity methods (approach B2)
DuD set MCS MCSext
1% 5% 10% 1% 5% 10%
HMGR 8.5±4.5 7.0±6.8 2.8±3.6 9.1±2.5 6.5±6.1 2.0±2.8
ER 13.6±7.6 12.6±4.1 5.3±1.7 10.2±6.5 10.6±2.5 5.0±1.0
PPARγ 4.6±10.6 1.2±5.4 1.7±2.8 4.5±11.0 3.8±5.5 1.6±2.9
P38 MAP 9.6±7.9 8.6±3.7 3.3±1.8 7.1±6.8 7.3±3.7 2.7±2.0
TK 20.1±4.4 12.6±2.1 5.1±1.6 19.7±5.3 14.0±2.1 5.5±1.5
FXa 4.6±11.2 7.6±3.8 3.3±1.8 3.5±11.2 6.2±4.7 2.5±2.6
ADA 10.1±6.4 8.2±3.0 4.3±3.6 12.8±6.4 8.8±3.3 6.1±4.6
DHFR 10.9±10.6 11.7±2.9 4.7±1.1 3.4±7.0 2.4±2.1 0.1±0.1
AChE 10.3±12.5 11.3±4.7 4.8±2.5 10.1±11.9 10.4±5.1 4.4±3.0
COX-2 12.3±9.2 11.7±2.2 5.3±1.1 11.4±10.3 10.5±3.7 2.5±2.5
w/d/l 8/ 0 / 2 7/ 0 / 3 8/ 0 / 2
MeanEFand standard deviations for the MCS and MCSextsimilarity methods at 1%, 5% and 10% of the database (receptor specific decoy set DuDset). The extension
fingerprint is calculated from 10% (20% for HMGR, TK and ADA) of the ligands (approach B2). Improvements of MCSextcompared to MCS are marked with bold print.
Table 12 MeanEFvalues and standard deviations for the ECFP and ECFPextsimilarity methods (approach B2)
ECFP ECFPext
DuD set 1% 5% 10% 1% 5% 10%
HMGR 8.7±9.4 6.8±8.5 4.2±5.6 4.3±9.5 6.5±4.8 2.9±2.6
ER 8.0±4.0 7.4±3.9 6.7±4.6 6.8±7.8 9.6±2.5 4.4±1.4
PPARγ 1.3±0.7 7.1±11.2 1.0±0.7 4.2±11.0 3.6±5.6 1.8±2.8
P38 MAP 7.0±5.9 5.9±3.0 3.4±2.0 4.0±6.0 7.0±3.6 3.0±1.9
TK 9.8±6.0 12.1±8.9 10.9±6.4 18.8±7.3 11.8±3.8 4.9±2.0
FXa 7.4±11.3 2.4±2.0 1.7±1.5 3.5±11.2 4.5±5.3 2.0±2.7
ADA 6.3±3.3 6.4±4.5 8.9±6.0 8.3±7.1 9.3±2.0 4.4±1.1
DHFR 2.5±2.0 1.8±1.5 1.8±1.5 5.7±5.5 0.5±0.8 0.0±0.0
AChE 15.0±11.2 5.2±2.3 6.8±3.8 12.2±12.7 10.0±5.4 4.6±2.9
COX-2 8.7±10.6 3.4±1.9 3.4±2.5 6.8±10.2 5.4±4.9 2.0±2.7
w/d/l 6/ 0 / 4 4/ 0 / 6 8/ 0 / 2
MeanEFand standard deviations for the ECFP and ECFPextsimilarity methods at 1%, 5% and 10% of the database (receptor specific decoy set DuDset). The extension
fingerprint is calculated from 10% (20% for HMGR, TK and ADA) of the ligands (approach B2). Improvements of ECFPextcompared to ECFP are marked with bold print.
w/d/l = wins/draws/losses.
used to derive a binary occurrence fingerprint of length 57 for the extended similarity measure (1).
We then calculated a similarity ranking with the extended MCS similarity measure and again docked the top 25 compounds. The results of docking the top 25 compounds of the extended MCS similarity ranking are shown in Table 5 (see Additional file 1: Table S2 of the supplement). Four structures from the ranking are shown in Figures 14, 15, 16 and 17. The docking scores are clearly improved in comparison to those of the structures found by the MCS similarity ranking given in Table 4 (see Additional file 1: Table S1). This means that the
com-Table 13 MeanEFand standard deviation for the bind_fp similarity method (approach B2)
Bind_fp
DuD set 1% 5% 10%
HMGR 36.5±2.0 20.2±3.2 10.0±2.2
ER 36.8±11.2 20.2±6.0 10.0±3.9
PPARγ 34.3±5.4 19.6±4.1 6.8±2.3
P38 MAP 20.0±0.0 17.3±6.8 8.6±1.4
TK 36.6±13.7 20.2±12.0 10.1±4.2•
FXa 9.9±7.6 8.5±0.0 4.2±0.8
ADA 36.7±8.5 20.1±0.0 10.0±0.9
DHFR 36.5±16.8 20.0±7.9 10.0±1.0
AChE 36.4±6.9 20.1±9.2 10.0±3.2
COX-2 35.7±7.5 19.8±6.2 9.9±1.0
MeanEFand standard deviation for the bind_fp similarity method at 1%, 5% and 10% of the database (receptor specific decoy set DuDset). The extension
fingerprint is calculated from 10% (20% for HMGR, TK and ADA) of the ligands (approach B2). Cases where bind_fp is better than ECFP or MCS are marked with a•or◦, respectively.
pounds found will very likely have a higher binding affinity to the receptor. Figures 8, 9 and 10 show the original posi-tion of fluvastatin and dockings of the two non-statins with the best docking score from the two similarity rank-ings. It can be seen that the ligand of the extended MCS similarity (in Figure 10) enters the active site much better than the one of the MCS similarity (in Figure 9).
As last experiment for the by-hand approach, we cal-culated similarity rankings with the ECFP similarity and also with an extended version of the ECFP similarity. We use the same binding-relevant substructure as for the MCS similarity. Comparing the differences in enrichment factors of the ligand structures in the ranked databases
Table 14 Bestαcoefficients for the MCSextand ECFPext
similarity methods (approach B2)
DuD set ECFPext MCSext
1% 5% 10% 1% 5% 10%
HMGR 0.2 0.5 0.9 0.3 0.7 0.8
ER 0.1 0.3 0.2 0.6 0.6 0.5
PPARγ 0.1 0.4 0.0 0.0 0.4 0.0
P38 MAP 0.3 0.5 1.0 0.7 0.8 1.0
TK 0.0 0.1 0.3 0.3 1.0 0.2
Fxa 0.0 0.3 0.2 0.2 0.7 0.6
ADA 0.3 1.0 1.0 0.3 1.0 1.0
DHFR 0.1 0.3 0.5 0.4 1.0 0.6
AchE 0.2 0.3 0.1 0.2 0.3 0.4
COX-2 0.1 0.2 0.2 0.1 1.0 0.6
The bestαcoefficients for the MCSextand ECFPextsimilarity methods.αhas
Table 15 MeanEFand standard deviation using the bestαcoefficients (approach B1)
MCSext ECFPext
DuD set 1% 5% 10% 1% 5% 10%
HMGR 5.8±10.0 1.7±0.7 0.6±0.3 0.6±1.9 2.6±3.2 0.6±0.1
ER 12.1±6.0 9.3±3.5 3.2±1.1 6.0±5.3 8.5±2.1 3.1±1.2
PPARγ 4.5±10.6 3.8±5.5 1.5±2.9 4.1±10.7 3.6±5.6 1.7±2.5
P38 MAP 2.8±6.9 4.8±4.2 2.4±2.1 2.7±6.0 4.8±4.2 2.4±2.1
TK 18.3±5.3 11.1±3.8 3.7±1.7 16.5±8.4 11.1±3.8 4.2±1.9
FXa 3.5±11.0 4.3±5.4 2.0±2.7 3.5±11.0 4.2±5.4 2.0±2.7
ADA 9.2±4.6 5.2±0.0 2.2±0.8 7.8±7.5 5.2±0.0 2.2±0.7
DHFR 2.7±5.1 0.0±0.0 0.0±0.0 1.9±0.9 0.0±0.0 0.0±0.0
ACHE 10.0±11.8 9.0±6.0 4.3±2.8 11.0±12.0 9.0±6.1 4.0±2.8
COX-2 9.9±9.8 9.8±3.7 2.1±2.6 6.7±10.2 5.3±5.0 2.1±2.6
w/d/l 10/ 0 / 0 9/ 0 / 1 10/ 0 / 0 8/ 0 / 2 6/ 0 / 4 8/ 0 / 2
MeanEFand standard deviation using the bestαcoefficients for extended similarites MCSextand ECFPextfor the receptor specific decoy sets DuDsetat 1%, 5% and
10% of the database. The extension fingerprint is calculated from all ligands (approach B1). Improvements of MCSextcompared to MCS as well as ECFPextcompared to
ECFP are marked in bold print. w/d/l = wins/draws/losses.
(MCS and ECFP similarity rankings) with the respec-tive extended variants (see Table 6), it is clear that the extension is beneficial in all cases. Especially the MCS similarity, that shows a slightly weaker performance than the ECFP similarity, benefits from the similarity exten-sion. Here an improvement of EF can be seen in all
except one cases (if further improvement is possible). For ECFP a decrease in EF can be seen in all except four cases.
For the second data set we use for testing the by-hand approach, PPARγ, we shorten the selection procedure. By visual inspection of the eight approved drugs shown in Table 3 and Figure 9 as well as binding information on Rosiglitazone given in by Liberato et al. [21] we select
two binding relevant substructures as shown in Figure 18. As described in the Materials and methods Section, the substructures were fragmented and used to derive a binary occurrence fingerprint for the extended similarity measure (1). The results for the similarity rankings that are calculated in analogy to the HMGR by-hand experi-ments are given in Table 7. The results clearly show that the reduced effort to extract the binding-relevant infor-mation has direct impact on the ranking performance. Only in half of the settings (MCS lig vs. DUDset, ECFP
lig vs. DUDall and ECFP lig vs. DUDset) we see
improve-ments of the extended similarity measures in comparison the base similarity measures. From that we conclude that it is of high importance to be very careful on selecting the
Table 16 MeanEFand standard deviation using the bestαcoefficients (approach B2)
MCSext ECFPext
DuD set 1% 5% 10% 1% 5% 10%
HMGR 6.1±10.5 2.1±0.9 0.8±0.4 2.7±6.8 4.3±5.6 1.5±2.5
ER 8.1±6.1 10.4±2.9 4.6±1.5 6.3±5.4 10.0±2.0 4.2±1.3
PPARγ 4.6±10.6 3.9±5.5 1.7±2.8 4.1±10.7 3.5±5.6 1.7±2.5
P38 MAP 5.4±6.4 5.4±3.4 1.4±0.1 3.9±5.7 6.7±3.8 1.4±0.1
TK 17.4±5.2 11.4±4.8 4.7±1.6 16.5±8.4 11.4±3.5 4.6±2.1
FXa 3.5±11.2 5.7±5.1 2.5±2.6 3.5±11.0 5.0±5.2 2.2±2.6
ADA 9.7±5.4 7.2±2.6 2.4±1.1 7.3±7.2 6.9±2.7 2.4±1.0
DHFR 3.0±6.0 0.8±1.6 0.0±0.0 2.4±1.2 0.4±0.9 0.0±0.0
ACHE 10.1±12.0 9.6±5.8 4.5±2.9 11.2±12.2 9.4±5.9 4.4±2.8
COX-2 12.0±10.3 10.8±6.3 2.8±2.8 6.7±10.3 5.5±4.9 2.2±2.6
w/d/l 9/ 1 / 0 9/ 0 / 1 9/ 1 / 0 8/ 0 / 2 4/ 0 / 6 8/ 0 / 2
MeanEFand standard deviation using the bestαcoefficients for extended similarites MCSextand ECFPextfor the receptor specific decoy sets DuDsetat 1%, 5% and
10% of the database. The extension fingerprint is calculated from 10% (20% for HMGR, TK and ADA) of the ligands (approach B2). Improvements of MCSextcompared
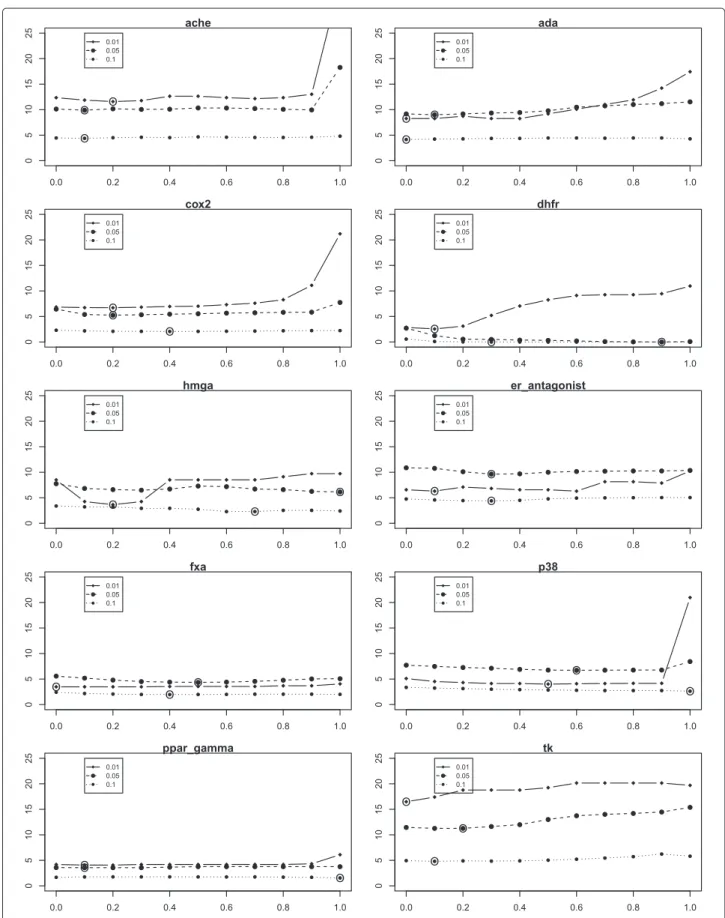
Figure 19Plot ofαvs. MeanEFfor MCSext.On the x-axis the values of the combining factorαis plottet versus the meanEFfor MCSexton the
y-axis. (approach B2).
Figure 20Plot ofαvs. MeanEFfor ECFPext.On the x-axis the
values of the combining factorαis plottet versus the meanEFfor
MCSexton the y-axis. (approach B2).
binding-relevant structural information when using the presented approach A (by-hand selection).
Mining-based experiments
Table 17 Win/loss counts for ten random folds for extended similarites on DuD set (α =0.3; approach B1)
ECFPext MCSext
1% 5% 10% 1% 5% 10%
Win Loss Win Loss Win Loss Win Loss Win Loss Win Loss
HMGR 10 0 10 0 10 0 5 0 5 0 5 0
ER 8 2 10 0 9 1 10 0 10 0 10 0
PPARγ 9 1 9 1 9 1 9 1 10 0 9 1
P38 MAP 9 1 10 0 10 0 10 0 10 0 9 1
TK 10 0 9 1 8 2 9 1 9 1 9 1
FXa 10 0 9 1 9 1 10 0 9 1 9 1
ADA 10 0 6 4 10 0 8 1 8 1 8 1
DHFR 8 2 10 0 10 0 10 0 10 0 10 0
ACHE 9 1 9 1 9 1 10 0 10 0 9 1
COX-2 6 4 7 3 8 2 7 3 9 1 9 1
Sum 89 11 89 11 92 8 88 6 90 4 87 7
Win/loss counts for all ten random folds for extended similarites MCSextand ECFPextversus their base similarities MCS and ECFP for the receptor specific decoy sets
DuDsetat 1%, 5% and 10% of the database. The extension fingerprint is calculated from all ligands (approach B1).
HMGR, ADA and TK data sets) to extract background knowledge. The results using variant B2 are given in Tables 11, 12 and 13.
Testing for the improvement of the extended similarity compared to the baseline similarity, on average, for a given data set, we find the following numbers of wins and losses for a fixedαcoefficient of 0.3 weighting the contribution of the extension of the similarity measure in Table 11 (MCS vs MCSext, approach B2): 8:2 (at 1%), 7:3 (at 5%), 8:2
(at 10%). Similar or even stronger results can be found for other settings, in particular for retrieving 10% of the com-pounds: 8:2 on Table 12 (ECFP vs. ECFPext, approach B2),
10:0 on Table 8 (MCS vs. MCSext, approach B1) and 8:2 on
Table 9 (ECFP vs. ECFPext, approach B1).
Checking whether these results are statistically signifi-cant, we chose one of the weakest significance tests, the sign test [22], which is based on only one weak assump-tion, namely the independence of the measurements. The sign test has a p-value ≤ 0.109 for a result of 8 wins vs. 2 losses, a p-value ≤ 0.0215 for 9 wins vs. 1 loss, and even smaller for 10 wins vs. 0 losses. We apply the sign test to determine whetherEF is on average greater
for one method compared to another for a given data set.
Table 18 Win/loss counts for ten random folds for extended similarites on DuD set (α =0.3; approach B2)
ECFPext MCSext
1% 5% 10% 1% 5% 10%
Win Loss Win Loss Win Loss Win Loss Win Loss Win Loss
HMGR 10 0 9 1 9 1 5 0 5 0 5 0
ER 8 2 9 1 7 3 10 0 9 1 7 3
PPARγ 10 0 9 1 9 1 6 4 10 0 8 2
P38 MAP 9 1 10 0 9 1 9 1 9 1 10 0
TK 7 3 9 1 9 1 9 1 6 4 7 3
FXa 10 0 7 3 8 2 9 1 8 2 8 2
ADA 10 0 6 4 9 1 6 3 8 1 6 3
DHFR 7 3 10 0 10 0 10 0 10 0 10 0
ACHE 8 2 9 1 9 1 8 2 10 0 9 1
COX-2 8 2 9 1 7 3 7 3 8 2 8 2
Sum 87 13 87 13 86 14 79 15 83 11 78 16
Win/loss counts for all ten random folds for extended similarites MCSextand ECFPextversus their base similarities MCS and ECFP for the receptor specific decoy sets
Table 19 Win/loss counts for all random folds for extended similarites on DuD set (α∈(0.0, 0.1); approach B1)
ECFPext MCSext
1% 5% 10% 1% 5% 10%
Win Loss Win Loss Win Loss Win Loss Win Loss Win Loss
HMGR 102 8 110 0 110 0 48 7 51 4 55 0
ER 70 40 98 12 99 11 97 13 109 1 103 7
PPARγ 93 17 78 32 86 24 94 16 90 20 77 33
P38 MAP 102 8 104 6 104 6 103 7 105 5 100 10
TK 96 14 99 11 92 18 96 14 97 13 99 11
FXa 101 9 100 10 94 16 104 6 100 10 100 10
ADA 91 19 89 21 109 1 81 18 96 3 84 15
DHFR 74 36 110 0 110 0 104 6 110 0 110 0
ACHE 93 17 100 10 101 9 96 14 105 5 101 9
COX-2 57 53 60 50 90 20 78 32 86 24 100 10
Sum 879 221 948 152 995 105 901 133 949 85 929 105
Win/loss counts for all 110 random folds (10 repetitions * 11αs) for extended similarites MCSextand ECFPextversus their base similarities MCS and ECFP for the
receptor specific decoy sets DuDsetat 1%, 5% and 10% of the database. The extension fingerprint is calculated from all ligands (approach B1).
While the results already show improvements of the score for a fixedα of 0.3, one might be interested in the results for an optimalα, which we do not know before-hand. Also, it is interesting to know into which range optimalαs fall and whether 0.3 is a suitable default value. Results are shown in Tables 14, 15 and 16 as well as in Figures 19 and 20. As it turns out, the statistics of the number of wins and losses can still be improved, e.g., from 8:2, 7:3, 8:2 to 10:0, 9:0, 9:1, respectively, and so forth. On the other hand, the optimal αs seem to vary some-what, with a value of 0.3 not being too large for most
data sets and most percentages of retrieved compounds (see Table 14).
To account for the variation ofEFacross different sets
within a cross-validation (see the standard deviations in Tables 8, 9, 10, 11, 12 and 13), we wanted to check whether the scores of two compared methods go up or down in a concerted fashion, or whether this is not the case. For this purpose, we present the win/loss statistics for a fixedαof 0.3 in Tables 17 and 18. As can be seen in these tables, the proportion of 8:2 or 9:1 still holds when zooming in on the individual data sets from Tables 8, 9, 11 and 12.
Table 20 Win/loss counts for all random folds for extended similarites on DuD set (α∈(0.0, 0.1); approach B2)
ECFPext MCSext
1% 5% 10% 1% 5% 10%
Win Loss Win Loss Win Loss Win Loss Win Loss Win Loss
HMGR 102 8 88 22 98 12 48 7 49 6 55 0
ER 70 40 74 36 74 36 87 23 89 21 67 43
PPARγ 93 17 86 24 88 22 69 41 95 15 72 38
P38 MAP 93 17 96 14 103 7 93 17 100 10 110 0
TK 75 35 95 15 94 16 96 14 85 25 82 28
FXa 101 9 67 43 80 30 99 11 84 26 83 27
ADA 86 24 79 31 98 12 60 39 88 11 76 23
DHFR 75 35 107 3 110 0 100 10 110 0 110 0
ACHE 86 24 95 15 96 14 87 23 98 12 94 16
COX-2 69 41 76 34 78 32 65 45 86 24 90 20
Sum 850 250 863 237 919 181 804 230 884 150 839 195
Win/loss counts for all 110 random folds (10 repetitions * 11αs) for extended similarites MCSextand ECFPextversus their base similarities MCS and ECFP for the
receptor specific decoy sets DuDsetat 1%, 5% and 10% of the database. The extension fingerprint is calculated from 10% (20% for HMGR, TK and ADA) of the ligands
Unfortunately, the results are not independent anymore, thus, the sign test can no longer be applied.
To investigate if the extension similarity simbind_fpon its own is better than the base similarity measures MCS and ECFP we provide Tables 10 and 13. The results show that the bind_fp similarity in general is not better on its own in comparison to the base similarities. Only for 10% of the database in approach B1 the bind_fp similarity performs better in the ranking than MCS or ECFP.
Our final results on the DuD data sets concern the ques-tion whether the method is really sensitive against the choice of a suitable α. For this purpose, we present the win/loss statistics for a wide range ofα values (from 0.0 to 1.0 with a step size of 0.1), across all the data sets from cross-validation in Tables 19 and 20. Quite surprisingly, the choice of a value ofαdoes not appear to have a strong influence on the win/loss statistics. The proportion of
roughly 8:2 or 9:1 still holds in this experiment. Therefore, we may conclude that the method is reasonably robust regarding the choice of a suitable value forα.
Comparing the data mining based extension results for the HMGR data set (first rows denoted HMGR in Tables 8 and 9) with the by-hand results on HMGR in Table 6 (rows denoted “lig vs DuDset”), we see that theEF values are
slightly better for the by-hand extension, but both variants of the data mining based approach are quite competitive. The ECFPextresults of variant B1 are even better than the
by-hand results.
As final experiments to test our data-mining based approaches B1 and B2 we added 25 ChEMBL activity class data sets. The results for approach B1 and B2 are given in Tables 21 and 22 respectively. For those data sets the win counts over all data sets are 19, 21, 21 and 18, 22, 22 (of 25 maximum possible) for 1%, 5% and 10% of the
Table 21 MeanEFand standard deviation for the experiments on the ChEMBL activity classes (approach B2)
MCS MCSext
CAC 1% 5% 10% 1% 5% 10%
4 50.0±23.1 5.8±5.5 2.2±2.6 40.0±11.1 4.0±3.2 0.0±1.5
9 66.7±14.3 13.3±2.9 6.5±1.4 59.3±17.2 11.1±5.0 5.6±2.8
10 66.0±16.5 13.2±3.3 6.2±1.6 53.3±9.8 6.7±1.5 2.7±0.9
21 80.0±8.2 15.4±2.3 7.4±1.4 80.0±15.8 16.0±2.6 8.0±0.0
35 75.0±9.6 14.2±1.7 7.1±0.8 72.2±11.7 12.2±4.8 1.1±3.2
44 66.4±25.8 9.3±6.3 3.3±3.2 30.1±21.1 6.0±3.5 3.0±1.7
52 71.4±9.8 13.0±2.1 5.6±0.9 70.0±9.7 4.0±0.8 0.0±1.0
54 81.4±10.7 15.4±2.5 7.4±1.5 70.0±16.6 12.1±0.0 0.0±0.0
57 54.0±23.2 9.2±5.7 4.4±2.8 60.0±13.5 3.9±6.9 4.9±1.1
81 82.0±7.9 15.4±1.6 6.7±0.9 80.0±6.7 9.8±1.5 2.0±2.6
86 67.0±18.3 10.2±5.4 4.0±3.0 50.0±17.9 4.0±0.7 5.1±1.4
98 80.0±10.0 14.7±2.4 6.7±1.5 70.0±14.6 6.1±4.9 3.0±1.8
105 72.5±14.9 13.3±4.3 6.6±2.1 88.7±10.1 10.0±2.5 2.9±2.6
113 71.1±7.8 12.9±1.1 5.9±0.6 70.1±6.9 8.4±3.1 1.0±1.4
121 74.0±5.2 14.8±1.0 7.2±0.6 69.9±4.9 13.9±1.2 6.9±1.4
129 65.0±10.0 10.5±1.0 4.8±1.3 50.0±9.9 2.0±0.4 0.9±1.6
152 80.0±12.2 16.0±2.4 8.0±1.2 76.5±17.6 16.0±0.6 8.0±2.6
181 66.0±5.5 9.6±2.6 2.8±0.8 60.0±7.6 4.0±4.7 0.8±1.6
186 80.0±7.1 14.0±2.8 6.0±1.6 20.0±15.6 2.0±3.9 0.0±1.8
195 77.8±11.1 14.7±2.5 5.8±0.9 62.9±4.5 9.6±3.6 4.8±2.6
211 50.0±0.0 10.0±0.0 5.0±0.0 50.0±18.0 0.0±3.7 0.0±1.6
213 77.8±13.6 15.1±2.4 7.1±1.5 74.1±6.3 13.3±0.8 6.7±2.6
230 64.0±19.5 8.4±6.1 3.4±2.9 90.0±20.1 14.0±1.6 0.9±1.4
234 52.0±16.4 10.4±3.3 5.2±1.6 40.0±15.5 6.2±2.7 1.0s±1.6
238 66.0±15.2 10.4±4.3 4.8±2.0 70.0±12.0 14.0±4.9 3.1±1.8
w/d/l 19/ 2 / 4 21/ 1 / 3 21/ 1 / 3
MeanEFand standard deviation for the MCS and MCSextsimilarity methods at 1%, 5% and 10% of the database (ZINC subset). The extension fingerprint is calculated
Table 22 MeanEFand standard deviation for the experiments on the ChEMBL activity classes (approach B2)
ECFP ECFPext
CAC 1% 5% 10% 1% 5% 10%
4 46.0±17.1 6.2±3.7 1.6±1.3 30.0±9.9 4.0±4.9 0.0±0.0
9 65.4±13.0 12.1±2.5 5.3±1.6 59.3±9.7 11.1±4.7 5.2±3.2
10 66.0±11.7 11.0±3.3 4.9±1.5 46.7±10.3 6.1±3.9 1.9±1.3
21 66.0±17.8 12.2±3.7 5.8±1.8 49.9±17.8 8.0±2.5 3.0±0.0
35 44.4±25.1 6.7±6.3 2.8±2.7 66.7±11.6 5.6±2.3 0.0±1.3
44 70.0±12.5 12.8±3.3 5.7±1.7 39.4±14.3 8.0±2.5 4.1±1.8
52 71.0±11.0 11.0±2.4 4.4±1.1 39.6±16.5 0.0±3.3 0.0±0.8
54 74.0±11.7 12.4±4.1 5.3±1.9 60.0±10.5 7.6±1.6 1.9±1.5
57 59.0±17.3 10.0±3.9 3.9±2.1 50.0±12.5 2.0±0.9 0.8±2.2
81 77.0±6.7 14.2±1.5 6.5±1.0 80.0±11.0 12.0±2.6 3.6±1.5
86 55.0±17.2 7.4±4.4 2.6±2.0 70.0±11.7 6.0±4.8 1.0±1.8
98 60.0±22.1 11.2±4.3 5.5±2.3 40.0±25.8 6.0±3.3 3.0±1.0
105 58.0±24.9 10.8±4.6 5.2±2.2 60.0±9.8 10.0±2.4 4.0±s 0.0
113 64.0±10.8 10.0±3.4 4.2±1.8 50.0±7.9 2.1±2.6 0.9±2.6
121 74.0±5.2 14.6±1.0 6.5±0.8 70.0±10.7 14.0±2.4 6.8±1.6
129 69.0±9.9 12.4±1.6 5.5±1.5 49.8±23.2 6.0±4.3 0.8±1.3
152 74.0±12.6 14.6±2.5 6.9±1.5 90.0±13.3 14.2±0.7 4.2±1.7
181 61.0±12.9 10.6±3.0 4.7±1.6 39.8±24.9 7.8±4.9 3.0±1.9
186 60.0±14.9 7.4±4.6 2.6±1.7 20.1±13.6 2.0±2.5 0.0±2.1
195 69.1±14.5 12.3±2.7 5.7±1.4 59.3±19.5 11.1±3.3 4.8±1.8
211 42.0±9.2 7.8±2.9 3.1±1.4 19.8±12.6 0.0±1.2 0.0±2.6
213 61.7±13.7 9.4±2.2 3.7±1.1 55.6±20.2 10.4±0.4 5.2±1.4
230 60.0±18.3 10.2±3.6 3.3±1.3 90.0±17.8 11.9±3.6 2.0±1.4
234 57.0±17.0 8.4±3.9 3.2±1.7 41.2±14.9 2.0±4.7 1.1±1.6
238 64.0±17.8 11.8±3.9 5.0±1.9 80.0±14.5 16.3±1.6 7.0±1.8
w/d/l 18/ 0 / 7 22/ 0 / 3 22/ 0 / 3
MeanEFand standard deviation for the ECFP and ECFPextsimilarity methods at 1%, 5% and 10% of the database (ZINC subset). The extension fingerprint is calculated
from 10% of the ligands (approach B2). Improvements of MCSextcompared to MCS are marked in bold print. CAC = ChEMBL activity class. w/d/l = wins/draws/losses.
database and MCSextand ECFPext. According to the sign
test the difference between extended and non-enxtended similarities is significant at a level of 0.05 [22].
Conclusions
Structural similarity measures, especially the ECFP fin-gerprints, have been reported to be superior to non-substructural fingerprints [23]. This work shows that and how such structural similarity methods used in vir-tual screening can be improved further by integrating background knowledge on binding-relevant structural features. We presented an approach based on by-hand selection of the background knowledge as well as an approach working with fragment-based data mining. From our experimental evaluation we conclude that the addition of only one binding-relevant sub-structural feature of a known ligand can substantial improve the
enrichment factors in the virtual screening. We addi-tionally show that using data mining based knowledge extraction instead of time consuming by-hand selection of relevant features gives competitive results.
Additional file
Additional file 1: Supplementary material for improving structural similarity based virtual screening using background knowledge.The supplementary information contains more extensive result tables and additional mathematical equations.
Competing interests
The authors declare that they have no competing interests.
Authors’ contributions
manuscript and contributed to the experimental design and setup. All authors read and approved the final manuscript.
Acknowledgements
We thank A. Schafferhans for her guidance on the usage of the Schrödinger Maestro Suite.
Author details
1Technische Universität München, Institut für Informatik, Boltzmannstrasse 3,
85748 Garching b. München, Germany.2Johannes Gutenberg-Universität Mainz, Institut für Informatik, Staudingerweg 9, 55128 Mainz, Germany.
Received: 8 June 2013 Accepted: 25 November 2013 Published: 16 December 2013
References
1. Terstappen G, Reggiani A:In silico research in drug discovery.Trends Pharmacol Sci2001,22:23–26.
2. van de Waterbeemed H, Gifford E:ADMET in silico modelling: towards prediction paradise?Nat Rev Drug Discov2003,2:192–204.
3. Rückert U, Kramer S:Frequent free tree discovery in graph data.In Proceedings of the ACM SIG Symposium on Applied Computing (SAC’04). New York, NY, USA: ACM Press; 2004:564–570.
4. Raymond J, Gardiner E, Willett P:RASCAL: calculation of graph similarity using maximum common edge subgraphs.Comput J2002,
45(6):631–644.
5. Rogers D, Hahn M:Extended-connectivity fingerprints.J Chem Inf Model2010,50(5):742–754.
6. Wallis W, Shoubridge P, Kraetz M, Ray D:Graph distances using graph union.Pattern Recognit Lett2001,22:701–704. [http://dx.doi.org/10.1016/ S0167-8655(01)00022-8]
7. Weininger D, Weininger A, Weininger J:SMILES. 2. algorithm for generation of unique SMILES notation.J Chem Inf Comput Sci1989,
29(2):97–101.
8. Stalring J, Carlsson L, Almeida P, Boyer S:AZOrange-High performance open source machine learning for QSAR modeling in a graphical programming environment.J Cheminformatics2011,3:28. 9. Knox C, Law V, Jewison T, Liu P, Ly S, Frolkis A, Pon A, Banco K, Mak C,
Neveu V, Djoumbou Y, Eisner R, Guo AC, Wishart DS:DrugBank 3.0: a comprehensive resource for ‘Omics’ research on drugs.Nucl Acids Res 2011,39(suppl 1):D1035–D1041.
10. Huang N, Shoichet B, Irwin J:Benchmarking sets for molecular docking.J Med Chem2006,49(23):6789–6801.
11. Heikamp K, Bajorath J:Large-scale similarity search profiling of ChEMBL compound data sets.J Chem Inf Model2011,51(8):1831–1839. 12. Irwin JJ, Sterling T, Mysinger MM, Bolstad ES, Coleman RG:ZINC: a free
tool to discover chemistry for biology.J Chem Inf Model2012,
52(7):1757–1768.
13. Lewington S, Whitlock G, Clarke R, Sherliker P, Emberson J, Halsey J, Qizilbash N, Peto R, Collins R:Blood cholesterol and vascular mortality by age, sex, and blood pressure: a meta-analysis of individual data from 61 prospective studies with 55000 vascular deaths.The Lancet 2007,370(9602):1829–1839.
14. Eisenberg D:Cholesterol lowering in the management of coronary artery disease: the clinical implications of recent trials.Am J Med 1998,104(2, Supplement 1):2S–5S.
15. Endo A, Kuroda M, Tanzawa K:Competitive inhibition of
3-hydroxy-3-methylglutaryl coenzyme A reductase by ML-236A and ML-236B fungal metabolites, having hypocholesterolemic activity.
FEBS Lett1976,72(2):323–326.
16. Berman H, Westbrook J, Feng Z, Gilliland G, Bhat T, Weissig H, Shindyalov I, Bourne P:The protein data bank.Nucl Acids Res2000,28:235–242. 17. Istvan E, Deisenhofer J:Structural mechanism for statin inhibition of
HMG-CoA reductase.Science2001,292(5519):1160–1164. [http://www. sciencemag.org/content/292/5519/1160.abstract]
18. Scarsi M, Podvinec M, Roth A, Hug H, Kersten S, Albrecht H, Schwede T, Meyer UA, Ruecker C:Sulfonylureas and Glinides exhibit peroxisome proliferator-activated receptor gamma activity: A combined virtual screening and biological assay approach.Mol Pharmacol2007,
71(2):398–406.
19. Bemis GW, Murcko MA:The properties of known drugs. 1. Molecular frameworks.J Med Chem1996,39(15):2887–2893.
20. Evers A, Klabunde T:Structure-based drug discovery using GPCR homology modeling: successful virtual screening for antagonists of the alpha1A adrenergic receptor.J Med Chem2005,48(4):1088–1097. 21. Liberato MV, Nascimento AS, Ayers SD, Lin JZ, Cvoro A, Silveira RL,
Martínez L, Souza PCT, Saidemberg D, Deng T, Amato AA, Togashi M, Hsueh WA, Phillips K, Palma MS, Neves FAR, Skaf MS, Webb P, Polikarpov I:
Medium chain fatty acids are selective peroxisome proliferator activated receptor (PPAR) gamma activators and Pan-PPAR partial agonists.PLoS ONE2012,7(5):e36297.
22. Demšar J:Statistical comparisons of classifiers over multiple data sets.J Mach Learn Res2006,7:1–30.
23. Hert J, Willett P, Wilton DJ, Acklin P, Azzaoui K, Jacoby E, Schuffenhauer A:
Comparison of topological descriptors for similarity-based virtual screening using multiple bioactive reference structures.Org Biomol Chem2004,2:3256–3266.
doi:10.1186/1758-2946-5-50
Cite this article as:Girschicket al.:Improving structural similarity based virtual screening using background knowledge.Journal of Cheminformatics 20135:50.
Open access provides opportunities to our colleagues in other parts of the globe, by allowing
anyone to view the content free of charge.
Publish with
Chemistry
Central and every
scientist can read your work free of charge
W. Jeffery Hurst, The Hershey Company.
available free of charge to the entire scientific community peer reviewed and published immediately upon acceptance cited in PubMed and archived on PubMed Central yours you keep the copyright
Submit your manuscript here: