ISSN (Online) : 2319 - 8753
ISSN (Print) : 2347 - 6710
I
nternationalJ
ournal ofI
nnovativeR
esearch inS
cience,E
ngineering andT
echnologyAn ISO 3297: 2007 Certified Organization, Volume 2, Special Issue 1, December 2013
Proceedings of International Conference on Energy and Environment-2013 (ICEE 2013)
On 12th to 14th December Organized by
Department of Civil Engineering and Mechanical Engineering of Rajiv Gandhi Institute of Technolo gy, Kottayam, Kerala, India
Development of a Delay Analysis System for
a railway construction Project
Aswathi R, Ciby Thomas
M.Tech Industrial Engineering & Management Rajiv Gandhi Institute of Technology Kottayam, Kerala, India
Associate Professor and Head, Dept. of Mechanical Engg Rajiv Gandhi Institute of Technology Kottayam, Kerala, India
Abstract
Construction delays are one of the biggest issues facing the construction industry. The characteristics of delay factors and their level of impact vary from project to project, ranging from a few days to years. They have significant financial, environmental and social impact in construction projects; therefore, it is vital to investigate the causes of delay and analyse their impact. In this context, the paper was initiated to develop a model for analysing and quantifying the impacts of delay factors on railway construction projects. The system was evaluated using a case study of track doubling project between Chengannur and Mavelikkara. The analysis of case study using Delay Analysis System found that the doubling project might be delayed by 135 months. Also the most sensitive delay factors were identified from the sensitivity report.
Keywords: Critical Path Method, Delay Analysis system, Delay Factors, Frequency Index, Importance Weight, Influence Value, Monte Carlo Simulation, Sensitivity Analysis, Severity Index, Questionnaire Survey.
1. INTRODUCTION
within the specified time and budget. In this context, this research study focuses on analysing and quantifying the impact of delay factors in a Railway construction project (Track doubling).
2. LITERATURE REVIEW
To identify the causes of construction delays, a detailed literature review was carried out. Previous literature has shown that there are few research studies related to delay analysis methods in the construction industry.
The major causes of time overrun in Hong Kong construction projects were identified in [10]. First they identified the principal causes of delays in both building and civil engineering projects in Hong Kong, and then investigated the relative importance weight of these causes. Secondly, they studied the
differences in the perceptions of the three major industry participants – clients, consultants and
contractors – to analyses the factors causing project delays.
The major causes of delays, effects of delays, and methods of minimising delays in construction projects in Aceh, Indonesia were identified in [1]. A total of fifty-seven factors that caused delays were identified. These factors were grouped into eight groups of causes of delays: contractor-related delays; equipment-related delays; client-related delays; material-related delays; finance-related delays; consultant-related delays; external-related delays; and manpower-related delays. These delay factors were considered during the design of a questionnaire that aimed to rank the delay factors using the responses collected from construction industry representatives, including consultants, contractors and owners. The possible delay factors in construction projects are also categorised into internal and external delay factors as follow:
1. The key internal delay factors are:
Change orders by the owner during construction Delay in progressing payments
Ineffective planning and scheduling by the contractor Poor site management by the contractor
A shortage of labour
Difficulties in financing the project by the contractor
However, the involvement of government, particularly in a developing country, where contracts are awarded to the lowest bidders without analysing the technical capability of contractors, is one of the main external factors delaying a project. Malaysia, Nigeria and Saudi Arabia have all reported this type of problem as an external factor.
The paper [5] studied the effects of delays in project delivery in the Nigerian construction industry and investigated how the effects of delays on project delivery and the total construction cost of building projects can be minimised.
The paper [7] identified the causes of delays in construction in the Eastern Province of Saudi Arabia, and tested the importance of the causes of delay between each of two groups of parties. They also studied the differences in perceptions of the three major parties in involved, namely owners, contractors and consultants.
The major causes of delay in construction projects in Malaysia and the perceptions of the different parties regarding the causes and types of those delays were studied in [17].
construction processes. In order to tackle this delay a clear understanding of the causes and knowledge of probable delay is essential. For this delay analysis systems are to be developed. Seventy Five delay factors that are common in construction industry were identified. Project risk identification methodologies include questionnaires, interviews with individuals or groups, brainstorming. Monte Carlo Simulation (MCS) is widely used to analyse the impact of possible risks associated with construction projects.
3. RESEARCH METHODOLOGY
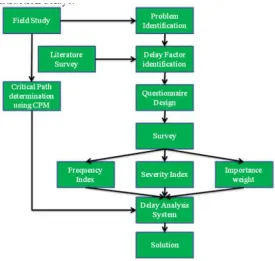
The methodology begins with the field study, which is the study on the doubling project at railway construction department, Kayamkulam. For the study one of the recently completed project carried out by the railway construction department Kayamkulam, which is the railway track doubling work is been considered. The railway construction department no more does any construction works themselves, instead they are all sub-contracted. The entire works involved are sub-contracted to various engineers on open tendering. The methodology to carry out the project is given by a flow diagram shown in Figure 1.
The study began with a field study which was carried out at railway construction department, Kayamkulam. In the study one of the recently commissioned doubling work, which is Chengannur-Mavelikkara doubling work was studied. From the study it was found that almost all the associated works in that project were delayed, and also the budget also overrun. This background study paved path for literature survey to identify the delay factors responsible for construction delays.
Fig. 1. Research Methodology Flow diagram
site engineers of contractors under railway construction department, kayamkulam. The questionnaire responses were used to calculate the frequency index, severity index and importance weight. This was further used to rank the delay factor categories. All the critical activities involved in the doubling project were found using Critical path method. Finally, the delay analysis system was developed using Monte Carlo simulation on Frontline Excel solver platform. The outputs of the system (simulation result and sensitivity report) were then further analysed to provide suitable suggestions and recommendations.
The equations to calculate the frequency index (FI), severity index (SI), importance weight (IW), importance index (II), average weight (AW), influence value and activity duration are as below.
(1)
(2)
(3)
(4)
(5)
(6)
(7)
Where Min Time is the minimum that can be assigned to an activity.
Max Time is the maximum that can be assigned to an activity.
Random = random numbers generated by MCS for the selected type of risk distribution
RF n is the influence of the delay factor (n) on a particular activity.
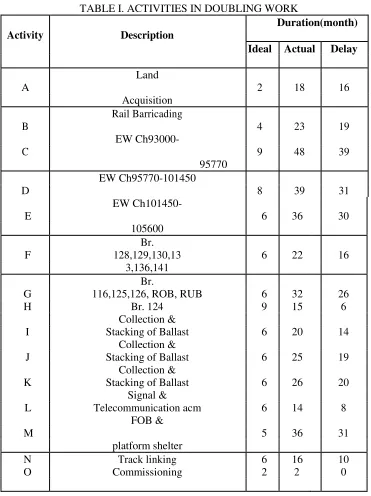
A. Critical path determination
TABLE I. ACTIVITIES IN DOUBLING WORK
Activity Description
Duration(month)
Ideal Actual Delay
A
Land
2 18 16
Acquisition
B
Rail Barricading
4 23 19
C
EW Ch93000-
9 48 39
95770
D
EW Ch95770-101450
8 39 31
E
EW Ch101450-
6 36 30
105600
Br.
F 128,129,130,13 6 22 16
3,136,141
Br.
G 116,125,126, ROB, RUB 6 32 26
H Br. 124 9 15 6
Collection &
I Stacking of Ballast 6 20 14
Collection &
J Stacking of Ballast 6 25 19
Collection &
K Stacking of Ballast 6 26 20
Signal &
L Telecommunication acm 6 14 8
M
FOB &
5 36 31
platform shelter
N Track linking 6 16 10
O Commissioning 2 2 0
The Critical path method (CPM) is a planning technique, which is normally used for activities and resource planning. The CPM helps to identify the possible critical activities in a construction project that are affected by critical resources. If some of the activities require other activities to finish before they can start, then the project becomes a complex task to identify critical activities.
CPM can help to establish:
How long your complex project will take to complete;
Which activities are "critical," meaning that they have to be done on time or else the whole
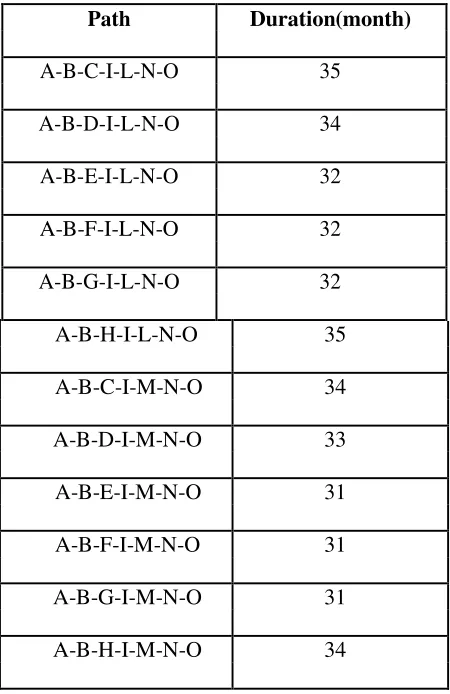
A list of project activities with their durations is identified at first from a construction schedule of a project. The existing techniques (CPM) will be used to identify the critical activities of the project, and these critical activities are then considered as an input of the DAS. The different paths are listed in Table 2.
TABLE II. DIFFERENT PATHS IN PROJECT
Path Duration(month)
A-B-C-I-L-N-O 35
A-B-D-I-L-N-O 34
A-B-E-I-L-N-O 32
A-B-F-I-L-N-O 32
A-B-G-I-L-N-O 32
A-B-H-I-L-N-O 35
A-B-C-I-M-N-O 34
A-B-D-I-M-N-O 33
A-B-E-I-M-N-O 31
A-B-F-I-M-N-O 31
A-B-G-I-M-N-O 31
A-B-H-I-M-N-O 34
Critical path is defined as the path with the longest duration. All activities lying on the critical path are called critical activities. It can be observed from the table that there are only two paths with the highest duration which are A-B-C-I-L-N-O and A-B-H-I-L-N-O. So, the critical activities are A, B, C, H, I, J, K, L, N and O. The total duration is 35 months.
B. Delay Analysis System
A conceptual framework of the DAS is designed to analyse the critical delay factors and to quantify the impact of the delay factors in a construction project. The list of the critical delay factors is identified by analysing the collected data from the industry survey. DAS is divided into three sections: input, process and output.
Input: - the inputs are: the critical delay factors identified from the industry survey; the
Importance Weight (IW) of each delay factor; and the critical activities of a construction project.
of the programme with influence value, determination of the probability of distribution random number, and the integration of the random number with the influence value using the Monte Carlo Simulation.
Output: - The outputs of the system are the delay of each activity and the total delay in a
construction project. Also the sensitivity of the critical delay factors are obtained as output..
4. RESULTS AND DISCUSSIONS
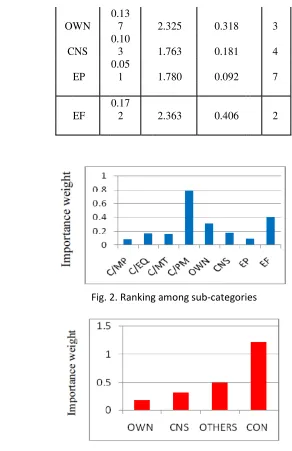
Table 4 gives the importance index values of the sub-category delay factors. Here the importance index value is higher for the contractor/project management category. Ranking on the basis of importance index is considered superior than ranking based on average weight. And hence the project management category is the most critical category. Table 3 shows the importance index values of the main categories. Among the main categories contractor has the highest importance weight, the value is 1.221 which is higher as compared to all other categories.
TABLE III. IMPORTANCE INDEX OF MAIN CATEGORIES
Catego ry Modul us Averag e Importan ce Ran k Weight Index
CON 0.534 2.288 1.221 1
OWN 0.103 1.763 0.181 4
CNS 0.137 2.325 0.318 3
OTHER
S 0.224 2.229 0.499 2
TABLE IV. IMPORTANCE INDEX OF SUB-CATEGORIES Category Modulu s Avera ge Importan ce Rank Weig ht Index C/MP 0.03
4 2.431 0.082 8
C/EQ 0.08
6 2.057 0.176 5
C/MT 0.06
8 2.513 0.170 6
C/PM 0.34
4 2.286 0.786 1
OWN 0.13
7 2.325 0.318 3
CNS 0.10
3 1.763 0.181 4
EP
0.05
1 1.780 0.092 7
EF
0.17
2 2.363 0.406 2
Fig. 2. Ranking among sub-categories
Fig. 3. Ranking among main categories
From Figure 2 and 3, it is very clear that contractor is the main party responsible for the delay in the main category and among sub-categories the project management issue stands first.
A. Simulation Results
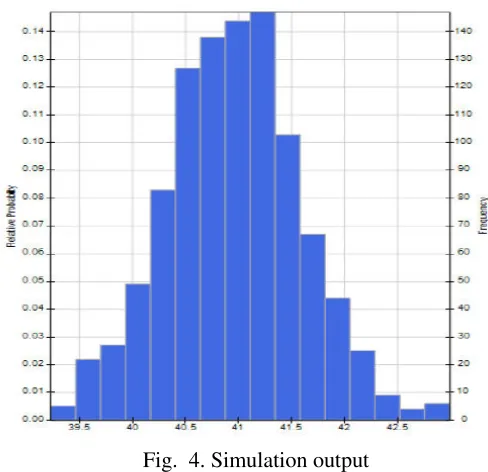
Fig. 4. Simulation output
The evaluation of the simulation model of the DAS is done using the case study, Chengannur-Mavelikkara track doubling project. In this case study, the doubling project was analyzed to quantify the project duration, taking into account the impact of delay factors. Using the information discussed in the sections above (such as critical activities, influence values, random numbers and equations), the possible duration of the building project was quantified through the simulation model of the DAS.
The simulation was run with 1,000 iterations to determine the durations of the project activities, and the results are presented in Figure 4. The figure shows that the project duration was predicted at around 42 months after considering a total of 58 delay factors. However, the project was originally estimated at 35 months. Comparing these values, it was found that the project might be delayed by 7 months when taking into account the delay factors.
B. Sensitivity Analysis
Sensitivity analysis is used to identify sensitivity in project duration due to the variation in the influence value of each delay factor affecting the project. Because the influence values are assigned an uncertainty by integrating random numbers, its values varies in every trial of the simulation.
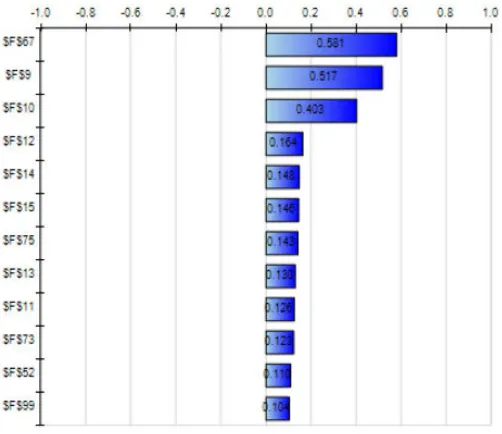
The Figure 5 shows the sensitivity of different delay factors on the total project duration. The
sensitivity value of “delay in materials delivery” is the highest and its value is 0.581. The sensitivity
The following rating shows the delay factors found through sensitivity analysis. From the rating it’s clear that delay in material delivery is the most sensitive among all the delay factors, which means this is the delay factor which has the greatest influence on the inputs of the system. The delay factors obtained from sensitivity analysis like delay in materials delivery, financial problem, delay in issuing change order, shortage of manpower etc have a greater influence on the project.
Fig. 5. Sensitivity Analysis
5. CONCLUSION
The research study has introduced a new methodology to analyse and quantify the impact of delay factors by developing a delay analysis system (simulation model). A framework of the system was developed using the findings from the literature review and industry survey in railway construction projects.
On simulating the model developed using Monte Carlo simulation, it could be found that there is a higher probability for the project to get delayed by 7 months. Also the sensitivity analysis report revealed the major delay factors. The output is highly sensitive to delay factors like delay in materials delivery, financial problems etc. The simulation model developed may be used in such similar works to calculate the probable delay.
The findings of the case study show an indicative figure of the possible delay in terms of time when considering the critical delay factors affecting a construction project. The key contribution of this study is a methodology development for analysing and quantifying the impact of delay factors in construction projects.
ACKNOWLEDGMENT
My sincere thanks to all the railway engineers at railway construction department, Kayamkulam for having helped me throughout the work. I would like to express profound gratitude to my internal guide Ciby Thomas, for all the support and guidance she has offered in successful completion of this work. My heartfelt gratitude to Mr. Raghunathan Rajesh for immensely helping me in organizing my work.
I thank my parents for being my backbone, and finally I thank almighty for all the blessings he has showered through many.
REFERENCES
[1] Abd. Majid, M.Z. and McCaffer, R. , “Factors of non-excusable delays that influence contractors’ performance”, Journal of Management in Engineering, ASCE May/June, pp: 42-4, 1998.
[2] Abdulhamid Shebob . et al ., “Development of a methodology for analysing and quantifying the impact of delay factors affecting
construction projects” , KICEM Journal of Construction Engineering and Project Management , vol.2, No. 3, pp. 17-30, 2012. [3] Abdul Razaque. et al ., “ Fostering project scheduling and controlling risk management”, International Journal of Business and Social
Science Vol. 3 No. 14 , pp. 118-128,2012.
[4] Abdelhak Challal and Mohamed Tkiouat , “Identification of the causes of deadline slippage in construction projects: state of the art and
application “, Journal of Service Science and Management, 2012, Vol 5, pp: 151-159, 2012.
[5] Aibinu, A. and Jagboro, G. , “Effects of construction delays on project delivery in nigerian construction industry”, International Journal of
Project Management, 20(8), 593–99, 2002.
[6] Andy K.W. Ng ,” Optimizing the time performance of subcontractors in the building projects” , Australasian Journal of Construction
Economics and Building, Vol 10 (1/2), pp: 90‐102, 2010.
[7] Assaf, A. and Al-Hejji, S. , “Causes of delays in large building construction projects”, ASCE Journal of Management in Engineering, 11(2),
45–50, 2006.
[8] A. Cunningham. et al., “Application of delay-time analysis via monte carlo simulation”, Journal of Marine Engineering and Technology Vol 10, No 3, pp. 57-72, 2011.
[9] A. De Marco,” Planning and Scheduling”, Project Management for Facility Constructions, pp 89-119, 2011.
[10] Chan, D. W. M. and Kumaraswamy, M. M. A., “Survey of time-cost relationships in Hong Kong construction projects”, Building
Technology and Management Journal, Vol 20,pp 54-72, 1994.
[11] ChangTaek . et al.,” The Development of Probabilistic Time and Cost Data: Focus on field conditions and labor productivity “KICEM Journal of Construction Engineering and Project Management , vol 1, pp: 37- 44, 2011.
[12] Chidambaram Ramanathan and SP Narayanan , “Construction delays causing risks on time and cost –a critical review “, Australasian Journal of Construction Economics and Building, Vol 12 (1), pp: 37-57, 2012.
[13] Dawood, N. , "Estimating project and activity duration: a risk management approach using network analysis", construction management and
economics, Vol.16, pp 41– 48, 1998.
[14] D. Grover,” Graphical Project Planning Techniques: An Overview of Gantt, PERT, and CPM Charts”, 2002. [15] Dale.R.Labitzke, “Planning scheduling and Project control”
[16] Fouad Ghraizi and Fahad Al-Azzaz,” Planning & Scheduling Techniques Used By Elseif Engineering Contracting Company”,
Construction Planning And Scheduling pp 1-27, 2005.
[17] Hancher, D.E. and Rowings, I. E., “Setting highway construction contract duration”, Journal of Construction Engineering and Management, ASCE 107 2, pp. 169-179, 1981.
[18] Mansfield N. K., Ugwu O. O. and Doran T. , “Causes of Delay and Cost Overruns in Nigerian Construction Projects”, Journal of Project Management; 12; 254-260, 1994.