Big Data Analytic Techniques and Its Use in
Supply Chain
Neha Chumbalkar1, Pushkar Chaudhari2, Vijay Gaikwad3
Graduate Student, Department of Electronics Engineering, Vishwakarma Institute of Technology, Pune,
Maharashtra, India1
Graduate Student, Department of Electronics Engineering, Vishwakarma Institute of Technology, Pune,
Maharashtra, India2
Head of Department, Department of Electronics Engineering, Vishwakarma Institute of Technology, Pune,
Maharashtra, India3
ABSTRACT: Though there is rising potential of big data, a few studies have been conducted to examine it in the supply chain field. This article gives an overview of big data, its analytic techniques and its use in supply chain field. The results show that the big data analytic techniques can be categorized into three types: descriptive, predictive, and prescriptive and these in turn influence supply chain processes and creates value. We would be highlighting the analytic techniques.
KEYWORDS: Big data, supply chain, descriptive, predictive, and prescriptive.
I. INTRODUCTION
Now a days due to so many social media and many new technologies a large volume of data is generated. More than 1200 Exabyte’s of new data is brought about each year from a variety of sources. 80% of this data is unstructured and is hard to be stored, processed and analysed with commonly used tools. The concept of big data that emerged in this context is often characterized by the three Vs: Volume, Velocity and Variety. Basically big data is the data that cannot be processed or stored. Many scientist defines big data as “a holistic approach to manage, process and analyse 3Vs in order to create actionable insights for sustained value delivery, measuring performance and establishing competitive advantages.”
Big data analytics is the process of examining this large and varied data sets, big data to uncover hidden patterns, unknown correlations, market trends, customer preferences and other useful information that can help organizations make more-informed business decisions. Analytics allow to make sense of big data by transforming into intelligent information. Overall process of extraction from big data consists of two sub processes: data management and analytics. Data management involves “processes and supporting technologies to acquire and store data and to prepare and retrieve it for analysis” whereas analytics refers to “techniques used to analyse and acquire intelligence from big data”.
Supply chains include every business that comes in contact with a particular product, including companies that assemble and deliver parts to the manufacturer.
II. ANALYTICTECHNIQUES
Big data analytics in supply chain focuses on the use of analytical techniques to drive decisions and actions regarding flows in the supply chain. Several advanced analytics techniques were found that can be categorized into three types: descriptive, predictive, and prescriptive.
1. Descriptive analytics
We find that the descriptive analytics bases on the use of descriptive statistics techniques to transform big data into meaningful information. Indeed, the GPS, RFID technologies and sensors collect data on a real-time.
a. GPS:
The Global Positioning System (GPS) is a satellite-based navigation system made up of at least 24 satellites. GPS works in any weather conditions, anywhere in the world, 24 hours a day, with no subscription fees or setup charges. The U.S. Department of Defense (USDOD) originally put the satellites into orbit for military use, but they were made available for civilian use in the 1980s. GPS satellites circle the Earth twice a day in a precise orbit. Each satellite transmits a unique signal and orbital parameters that allow GPS devices to decode and compute the precise location of the satellite. GPS receivers use this information and trilateration to calculate a user's exact location. Essentially, the GPS receiver measures the distance to each satellite by the amount of time it takes to receive a transmitted signal. With distance measurements from a few more satellites, the receiver can determine a user's position and display it electronically to measure your running route, map a golf course, find a way home or adventure anywhere. To calculate your 2-D position (latitude and longitude) and track movement, a GPS receiver must be locked on to the signal of at least 3 satellites. With 4 or more satellites in view, the receiver can determine your 3-D position (latitude, longitude and altitude). Generally, a GPS receiver will track 8 or more satellites, but that depends on the time of day and where you are on the earth. Some devices can do all of that from your wrist.
Once your position has been determined, the GPS unit can calculate other information, such as:
Speed
Bearing
Track
Trip distance
Distance to destination
Sunrise and sunset time
And more
Fig 1. Working of GPS
b. RFID:
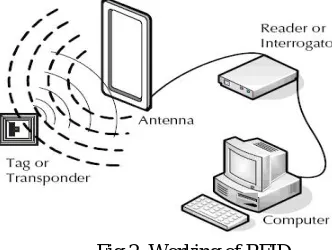
Radio-Frequency Identification (RFID) is the use of radio waves to read and capture information stored on a tag attached to an object. A tag can be read from up to several feet away and does not need to be within direct line-of-sight
interrogator or reader emits a signal to the tag using an antenna. The tag responds with the information written in its memory bank. The interrogator will then transmit the read results to an RFID computer program.
There are two types of RFID tags: passive and battery powered. A passive RFID tag will use the interrogator’s radio wave energy to relay its stored information back to the interrogator. A batter powered RFID tag is embedded with a small battery that powers the relay of information. In a retail setting, RFID tags may be attached to articles of clothing. When an inventory associate uses a handheld RFID reader to scan a shelf of jeans, the associate is able to differentiate between two pairs of identical jeans based upon the information stored on the RFID tag. Each pair will have its own serial number. With one pass of the handheld RFID reader, the associate can not only find a specific pair, but they can tell how many of each pair are on the shelf and which pairs need to be replenished. The associate can learn all of this information without having to scan each individual item.
Fig 2. Working of RFID
c. Sensors:
Sensors are sophisticated devices that are frequently used to detect and respond to electrical or optical
signals. A Sensor converts the physical parameter (for example: temperature, blood pressure, humidity, speed, etc.)
into a signal which can be measured electrically. Let’s explain the example of temperature. The mercury in the glass thermometer expands and contracts the liquid to convert the measured temperature which can be read by a viewer on the calibrated glass tube.
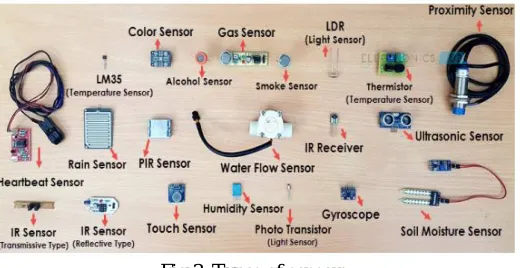
Different Types of Sensors:
The following is a list of different types of sensors that are commonly used in various applications. All these sensors are used for measuring one of the physical properties like Temperature, Resistance, Capacitance, Conduction, Heat Transfer etc.
Temperature Sensor
Proximity Sensor
Accelerometer
IR Sensor (Infrared Sensor)
Pressure Sensor
Light Sensor
Ultrasonic Sensor
Smoke, Gas and Alcohol Sensor
Touch Sensor
Colour Sensor
Humidity Sensor
Tilt Sensor
Fig 3. Types of sensors
2. Predictive analytics
The predictive analytics concern the use of techniques such as data mining, machine learning and social network analysis.
a. Data Mining:
Data mining is the process of sorting through large data sets to identify patterns and establish relationships to solve problems through data analysis. Data mining tools allow enterprises to predict future trends. In data mining, association rules are created by analyzing data for frequent if/then patterns, then using the support and confidence criteria to locate the most important relationships within the data. Support is how frequently the items appear in the database, while confidence is the number of times if/then statements are accurate.
Other data mining parameters include Sequence or Path Analysis, Classification, Clustering and Forecasting. Sequence or Path Analysis parameters look for patterns where one event leads to another later event. A Sequence is an ordered list of sets of items, and it is a common type of data structure found in many databases. A Classification parameter looks for new patterns, and might result in a change in the way the data is organized. Classification algorithms predict variables based on other factors within the database.
Clustering parameters find and visually document groups of facts that were previously unknown. Clustering groups a set of objects and aggregates them based on how similar they are to each other.There are different ways a user can implement the cluster, which differentiate between each clustering model. Fostering parameters within data mining can discover patterns in data that can lead to reasonable predictions about the future, also known as predictive analysis.Data mining techniques are used in many research areas, including mathematics, cybernetics, genetics and marketing.
Fig 4. Stages of Data Mining
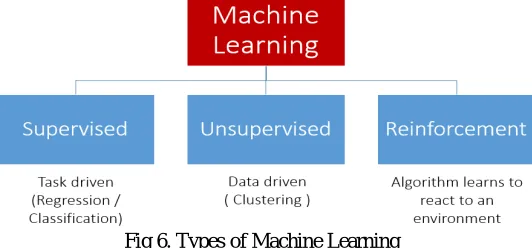
Machine learning is an application of artificial intelligence (AI) that provides systems the ability to automatically learn and improve from experience without being explicitly programmed. Machine learning focuses on the development of computer programs that can access data and use it learn for themselves. The process of learning begins with observations or data, such as examples, direct experience, or instruction, in order to look for patterns in data and make better decisions in the future based on the examples that we provide. The primary aim is to allow the computers learn automatically without human intervention or assistance and adjust actions accordingly.Some machine learning methods:
Fig 6. Types of Machine Learning
Machine learning algorithms are often categorized as supervised or unsupervised.
Supervised machine learning algorithms:
Itcan apply what has been learned in the past to new data using labeled examples to predict future events. Starting from
the analysis of a known training dataset, the learning algorithm produces an inferred function to make predictions about the output values. The system is able to provide targets for any new input after sufficient training. The learning algorithm can also compare its output with the correct, intended output and find errors in order to modify the model accordingly.
Unsupervised machine learning algorithms:
Itare used when the information used to train is neither classified nor labelled. Unsupervised learning studies how
systems can infer a function to describe a hidden structure from unlabelled data. The system doesn’t figure out the right output, but it explores the data and can draw inferences from datasets to describe hidden structures from unlabelled data.
Reinforcement machine learning algorithms:
Itis a learning method that interacts with its environment by producing actions and discovers errors or rewards. Trial
and error search and delayed reward are the most relevant characteristics of reinforcement learning. This method allows machines and software agents to automatically determine the ideal behaviour within a specific context in order to maximize its performance. Simple reward feedback is required for the agent to learn which action is best; this is known as the reinforcement signal.
3. Prescriptive analytics
The prescriptive analytics based on descriptive and predictive analytics and optimization methods. This last tool includes mathematical models and simulation techniques to support decision and optimize process on a real-time. The study shows that the use of advanced analytics improve a firms’ operational performance through SCM initiatives such as TQM, JIT, andStatistical process control.
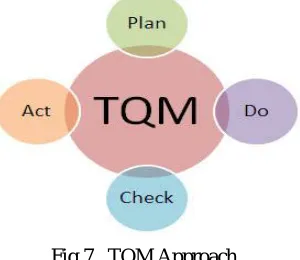
a. TQM:
Total Quality Management (TQM) refers to management methods used to enhance quality and productivity in business organizations. TQM is a comprehensive management approach that works horizontally across an organization, involving all departments and employees and extending backward and forward to include both suppliers and clients. TQM is a management philosophy that seeks to integrate all organizational functions (marketing, finance, design, engineering, and production, client service, etc.) to focus on meeting customer needs and organizational objectives. Total Quality Management (TQM) is an approach that organizations use to improve their internal processes and increase customer satisfaction. When it is properly implemented, this style of management can lead to decreased costs related to corrective or preventative maintenance, better overall performance, and an increased number of happy and loyal customers.
Total quality management is an organization-wide philosophy with its core values centred on continually improving the quality of its product and services, and the quality of its procedures, to meet and exceed customer expectations.
The principles of quality management:
Leadership - leaders establish unity of purpose, direction and the internal environment of the organization. They create the environment in which people can become fully involved in achieving the organization’s objectives.
System approach to management - identifying, understanding and managing a system of interrelated processes for a given objective contributes to the effectiveness and efficiency of the organization.
Customer-focused organization - organizations depend on their customers and therefore should understand current and future customer needs, meet customer requirements and strive to exceed customer expectations.
Process approach - a desired result is achieved more efficiently when related resources and activities are managed as a procedure.
Factual approach to decision making - effective decisions are based on the logical and intuitive analysis of data and information.
Involvement of people - people at all levels are the essence of an organization and their full involvement enables their abilities to be used for the organization’s benefit.
Mutually beneficial supplier relationships - mutually beneficial relationships between the organization and its suppliers enhance the ability of both organizations to create value.
Continual improvement - continual improvement is a permanent objective of an organization.
Fig 7. TQM Approach
b. JIT
to work successfully, producers need to be able to forecast demand accurately. Today, many car manufacturers across the world operate at varying degrees of JIT. They rely on their supply chains to deliver the parts they require to make cars. The parts do not arrive before or after they need them. Instead, they arrive the moment they need them.
Manufacturers like to use JIT because it is a more cost-effective way of holding stock. It is only effective, however, when you do it properly. The advantages are:
Space: if the turnaround of stock is fast, companies do not need as much storage space. Less space means smaller warehouses to rent or build. This subsequently frees up money for other parts of the business.
Waste: items are less likely to deteriorate or become obsolete if stock turnaround is fast. There is also a reduction of waste. The company saves money because it is spending less on excess stocks.
Investment Size: just in time inventory management is ideal for smaller businesses. It is especially useful for businesses that cannot buy large amounts of stock in one go. Cash flow is also healthier if you can order stock as and when you need it.
Greater Flexibility: as your production runs are extremely short, it is easier for your company to halt production. It can, for example, stop producing one product and rapidly switch to a different one. In other words, it is better able to respond to changes in customer requirements.
Addressing Mistakes: employees are more likely to detect mistakes in production more quickly and fix them.
Fig 8. Just In Time(JIT) Approach
III.USEOFBIGDATAANALYTICTECHNIQUESINSUPPLYCHAIN
The descriptive analytics bases on the use of descriptive statistics techniques to transform big data into meaningful information. Indeed, the GPS, RFID technologies and sensors collect data on a real-time which will be summarized and converted into information relative to location and quantity of goods in SC. Thus, the manager can have real-time information, for example, on carrier’s location or stock state and consequently, he can make adjustments concerning the delivery schedules or replenishment orders for instance. Thereby, the descriptive analytics provide information regarding “what has happened?” and “what is happening at the moment?” for reporting and monitoring purposes. It can be combined with visualization techniques in order to give an overview of data represented in form of performance scorecard with key performance indicator such as delivery deadline and sales growth.
descriptive and predictive analytics and optimization methods.This last tool includes mathematical models and simulation techniques to support decision and optimize process on a real-time. For example, by using this technique in outbound logistics, every order is analysed with regard to the availability of stock in order to manage expeditions and determine the appropriate deadlines of delivery on a real-time, what allows to decrease the logistics cost, increase the efficiency and provide a better service to the customer. Accordingly, perspective analytics address the question “what should be happening?”
IV. CONCLUSION
In supply chain management, the use of big data analytics enables to know customers’ perceptions of offered products and services and discover their unobservable characteristics in order to understand market demands and anticipate future consumer product variety desires. The customer’s knowledge enables to develop new products and services more customized and consequently improve their satisfaction.
Furthermore, predicting demand through big data analytics will make it possible to plan and execute supply chain so as to balance supply and demand and improve supply chain operations. Indeed, the combination of analytics techniques enables to optimize manufacturing processes, shop-floor management and manufacturing logistics which allows producing new products in a more profitable way and reducing logistics cost.
Indeed, the combination of analytical techniques such as data mining and visualization tools allow to generate information relevant and viable for decision-makers in particularity production logistics. The use of simulation with statistics and visualization techniques allows analysing markets, production and sales data on a real time and computing the key performance indicators relative to supply chain for developing strategic, tactical, and operational decision making. Thus we see that big data analytic techniques greatly influences the supply chain system. And hence should be used more often to make the supply chain better.
REFERENCES
[1]. Tobias Knobloch and Julia Manske (11 January 2016). "Responsible use of data". D+C, Development and Cooperation.
[2]. Lee, Jay; Wu, F.; Zhao, W.; Ghaffari, M.; Liao, L (January 2013). "Prognostics and health management design for rotary machinery systems—Reviews, methodology and applications". Mechanical Systems and Signal Processing. 42 (1).
[3]. Bouckaert, Remco R.; Frank, Eibe; Hall, Mark A.; Holmes, Geoffrey; Pfahringer, Bernhard; Reutemann, Peter; Witten, Ian H. (2010). "WEKA Experiences with a Java open-source project". Journal of Machine Learning Research. 11: 2533–2541. The original title, "Practical machine learning", was changed ... The term "data mining" was [added] primarily for marketing reasons.
[4]. "Tutorials". PHM Society. Retrieved 27 September 2016.
[5]. "Prognostic and Health Management Technology for MOCVD Equipment". Industrial Technology Research Institute. Retrieved 27 September 2016.
[6]. Nagurney, Anna (2006). Supply Chain Network Economics: Dynamics of Prices, Flows, and Profits. Cheltenham, UK: Edward Elgar. ISBN 1-84542-916-8.
[7]. Inc., Advanced Solutions International,. "Home". cscmp.org. Retrieved 22 January 2018. [8]. "Supply Chain Council, SCOR Model".
[9]. "SCM Institute". scm-institute.org. Retrieved 22 January 2018.
[10]. "Getting Products to People: The JSI Framework for Integrated Supply Chain Management in Public Health".
[11]. National Research Council (U.S.). Committee on the Future of the Global Positioning System; National Academy of Public Administration (1995). The global positioning system: a shared national asset: recommendations for technical improvements and enhancements. National Academies Press. p. 16. ISBN 0-309-05283-1. Retrieved August 16, 2013., https://books.google.com/books?id=FAHk65slfY4C&pg=PA16
[12]. O'Leary, Beth Laura; Darrin, Ann Garrison (2009). Handbook of Space Engineering,Archaeology, and Heritage. Hoboken: CRC Press. pp. 239–240. ISBN 9781420084320.
[13]. Guier, William H.; Weiffenbach, George C. (1997). "Genesis of Satellite Navigation" (PDF). Johns Hopkins APL Technical Digest. 19 (1): 178–181.