Hadronic interaction studied by TA
TakashiSako1,∗on behalf of the Telescope Array Collaboration
1Institute for Cosmic Ray Research, University of Tokyo, Chiba, Japan
Abstract.Two studies by the Telescope Array group related to the hadronic interaction observed with Extensive Air Showers are reviewed. (1) Inelasticp-air cross sectionσinel
p−air =567.0±70.5 [stat]+
29
−25[sys] mb and totalp
-pcross sectionσtot
p−p =170+−4844[stat]+ 19
−17[sys] mb were determined using the 5 years of TA hybrid data with one of the 3 FD stations. These results at the highest energy √sNN=95 TeV showed good agreements with the extrapolation from the previous measurements and model predictions. (2) The signal sizes of SD were compared between data and MC using 7 years of TA SD data in the energy range from 1018.8eV to 1019.2eV. It was found that the data/MC ratios exceed unity and the deviation becomes larger when the expected fraction of muon signal, defined as muon purityP, is higher. The results support the muon excess (with respect to MC) problem reported by the previous observations.
1 Introduction
Observations of Ultra-High Energy Cosmic Rays (UHECR) through extensive air showers (EAS) are the only way to access high-energy particle physics beyond the LHC energy. So far the data from LHC are used to study hadronic interaction up to √s=13 TeV, which corre-sponds to cosmic-ray equivalent energy ECR∼1017eV in case of proton primaries, while UHECR observations can access up to √s=440 TeV or ECR =1020eV. It is known that some EAS observables such as number of muons are not well reproduced even using the post-LHC interaction models in air shower simulation [1]. Investigation of high-energy interactions using EAS observations are thus an important theme for both cosmic-ray physics and high-energy particle physics.
The Telescope Array (TA), the largest EAS observa-tory in the Northern hemisphere, has been observing cos-mic rays with E>1018eV since 2008 [2]. The surface de-tector (SD) array of TA covering 700 km2 area near the Delta city in Utah, USA, observes EASs with more than 95% live time [3]. The sky over the SD array is monitored by 38 fluorescence telescope detectors (FD) installed at 3 stations [4]. FDs image the EAS developments and mea-sure the three-dimensional EAS reconstruction although their observation time is limited to dark and clear nights. The depth of shower maximum development in the atmo-sphere,Xmax, used in this paper is measured using the FD data. In addition, analyzing the events triggered by both the SD and FD detectors, called hybrid events, the ac-curacy of geometrical reconstruction, and hence theXmax resolution, is improved. and hence theXmaxresolution, is improved.
In this paper, two studies by TA related to the hadronic interaction are reviewed. One is the determination of
∗e-mail: [email protected]
proton-air inelastic and proton-proton total cross sections (σinel
p−airandσ tot p−p) at
√s
NN=95 TeV [5], where√sNN des-ignates the center-of-momentum energy per nucleon. The other study is data-Monte Carlo (MC) comparison of the SD signal size for various shower geometries, which is re-lated to the muon density in EASs [6]. The two studies are reviewed in Sec.2 and Sec.3, and a summary is given in Sec.4.
2 Cross section measurements
2.1 Method using FDs
The proton-proton cross-section,σtot
p−p, is one of the most fundamental quantities in particle physics. However, ex-cept for the unitarity limit, the evolution of the cross-section for hadronic interactions is not well understood. Cross-section measurements using FDs was pioneered by the Fly’s Eye experiment in 1984 [7], and was updated by later experiments [8] [9].
The basic idea is to determineσinel
p−air using FD data assuming the exponential slope of Xmax distribution, la-beled asΛm, deep in the atmosphere is proportional to the mean free path of proton-air interaction, λp−air. By se-lecting deep penetrating showers within a certain energy range, the corresponding primary particles are dominated by protons. The proportional coefficient, K, that relates Λm=Kλp−air is determined using air shower MC simula-tions. Finally, σinel
p−air is calculated with a relationσ inel p−air
Figure 1. Historical improvement in the measurement of theK factor compiled for this review. The error bars are assigned as half of max-min uncertainties estimated in each paper ([7] [10] [11] [5] from left to right).
is proposed in [5] to scaleσinel
p−air=530±66 mb reported by Fly’s Eye group [7] down to 392±49 mb according to the Kfactor update from 1.6 to 1.2.
Derivation ofσtotp−prequires another theoretical step to correct for the nuclear effect. Glauber calculation gives
σinel
p−airconsidering the multiple nucleon effect inside a nu-cleus with inputs of σtot
p−p, nucleon distribution function and the elastic slope parameter B[12] [13]. Fixing the nucleon distribution function and introducing another the-oretical assumption of a σtot
p−p-B relation, σtotp−p is deter-mined usingσinelp−airobtained above.
More details on the methodology are found in [10] [13].
2.2 TA result onσinel p−air
In the TA data analysis, data obtained from the SD array and the Middle Drum station, one of the 3 FD stations, from May 2008 to May 2013 were used. Using the hy-brid reconstruction, the estimatedXmaxresolution is about 23 g/cm2. A total of 438 events in the energy range from 1018.3eV to 1019.3eV remained after event selection. The mean energy of all events,1018.68eV, corresponds to the center of momentum energy of 95 TeV that is the highest energy where the cross section is determined so far. Note that because the recent composition study of TA concluded a light mass composition at this energy [14], proton domi-nance of deepXmaxevents is a reasonable assumption.
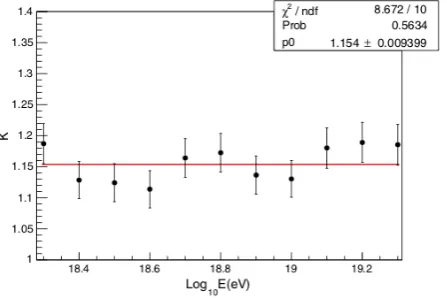
The energy and interaction model dependences of K factor were studied using the CONEX one-dimensional air shower simulation code [15]. Validity of using the 1-D simulation code was confirmed by comparing with calcu-lations using fully three-dimensional CORSIKA code, TA detector response simulation and TA reconstruction code. Fig.2 shows theKfactor determined by the CONEX simu-lation as a function of primary energy. QGSJET II-04 [16] was used as the high-energy hadronic interaction model. No energy dependence is found andKis treated as a con-stant in the energy range of interest. TheKfactors were
Figure 2.Primary energy dependence ofKfactor derived using the CONEX one-dimensional MC simulation. The QGSJET II-04 hadronic interaction model was used. (Figure from [5].)
derived using four different high-energy hadronic interac-tion models QGSJET-01 [17], SIBYLL [18] and EPOS-LHC [19] in addition to QGSJET II-04, to be 1.22, 1.18, 1.19 and 1.15, respectively. Because the uncertainty of each value is only ±0.01, model dependency dominates the uncertainty ofKdetermination, but it is still only±3% from the mean value.
The distribution of Xmax measured by TA is shown in Fig.3. Deep penetrating events in the range from 790 g/cm2and 1000 g/cm2were fit with exponential func-tion. The best fit function is drawn in the figure and its slopeΛmwas found to be (50.47±6.26 [stat]) g/cm2. Us-ing the K factor and Λm obtained above with a relation σinel
p−air=14.45mpK/Λm,
σinel
p−air =567.0±70.5 [stat]+ 29
−25[sys] mb
was obtained for the proton-air cross section at √sNN
= 95 TeV. The dominant elements of the systematic un-certainty accounted here are the interaction model de-pendence (±3% corresponding to ±17 mb), 20% Helium contamination (-18 mb) and 1% photon contamination (+23 mb). Detail of these estimations is found in [5].
σinel
p−air result obtained from the TA data is plotted in Fig.4 with the previous results together with the prediction lines of 4 interaction models.1
2.3 TA result onσtot p−p
The function ofσinelp−air(σtotp−p,B) based on the Glauber cal-culation is shown in Fig.5. Three contour levels ofσinelp−air, a solid curve corresponding to 567 mb obtained in Sec.2.2 and two dotted curves showing the upper and lower un-certainty bands, are drawn. The shaded area is not al-lowed due to the unitarity constraint. A dashed straight line shows the theoretical prediction of the σtot
p−p-B rela-tion using the QCD-inspired Block, Halzen, and Stanev (BHS) fit to the ppand ¯ppdata from the Tevatron [21].
1Abreu et al. [9] shows the result of Auger in 2012. They updated the
Figure 3. Xmax distribution measured by TA. The line shows the result of exponential fit in the range between 790 g/cm2and 1000 g/cm2(Figure from [5].)
Figure 4. Theσinel
p−airobtained by various experiments. The re-sult of this work is shown by a red filled circle with statistical and systematic errors indicated by long and short arrows, respec-tively. The prediction lines of 4 different interaction models are also drawn. (Figure from [5].)
Taking the intersections between the BHS prediction line and threeσinel
p−air curves and projecting them on the hori-zontal axis,σtot
p−pand its error are obtained to be
σtot
p−p=170+ 48
−44[stat]+ 19
−17[sys] mb.
The result is plotted together with the previous works in Fig.6.
2.4 Comparison to recent LHC results
This section discusses the relationship to the latest LHC results after the TA publication. The analysis in Sec.2.3 relied on the theoretical BHS fit to relate σtot
p−p and B based on the Tevatron data at √s=1.8 TeV. The TOTEM collaboration at LHC measuredB=(20.36±0.19) GeV−2 at √s=13 TeV and this is clearly larger than a smooth extrapolation from the data below the Tevatron energy [22]. The deviation does not exist in the √s=2.76 TeV TOTEM result, but becomes clear in the √s=7 and 8 TeV
included. This includes the statistical (outer/thinner error bar) and the systematic (inner/thicker error bar).
V. PROTON-PROTON CROSS SECTION
From the TA proton-air cross section result we can determine the total proton-proton cross section. The proc-ess of inferringσp−pfromσinelp−airis described in details in
[35], and[36].
Theσp−pis calculated from the measured cross section,
also known as the inelastic cross sectionσinel
p−air, using both
Glauber Formalism[37]and the relation:
σinel
p−air¼σtotalp−air−σpel−air−σqelp−air ð3Þ
Whereσtotal
p−airis the total cross section,σelp−airis the elastic
cross section and σqelp−air is the quasielastic cross section. The quasielastic cross section corresponds to scattering processes in which nuclear excitation occurs without particle production.
The relation between theσinel
p−airand theσp−pis highly
dependent on the forward scattering elastic slopeB.
B¼d dt
!
lndσelp−p
dt
"
t¼0 ð
4Þ
This is shown in theB,σtotal
p−pplane in Fig.8. Here the
solid and dotted curves represent a constant value ofσinel
p−air
that reflects the Telescope Array measured value and the statistical fluctuations.
There have been many theories predicting the
relation-ship betweenBandσp−p. However many of these models
either failed to describe the elastic scattering data, or the
elastic slope energy dependence from the Tevatron ([35,38,39]). A more updated theory using the single pomeron exchange model while describing the Tevatron data correctly is not consistent with the Unitarity constraint ([35,40]). Here the unitarity constraint is shown by solid
grey shaded area in Fig.8. A more recent prediction is the
BHS fit[5]. It is consistent with unitarity while using a
QCD inspired fit to the pp andpp¯ data from the Tevatron.
The dashed line in Fig.8shows the BHS prediction. Here
Energy(eV) 12
10 1013 1014 1015 1016 1017 1018 1019 1020
(mb) p-air σ 200 300 400 500 600 700 800
Baltrusaitis et. al. 1999 Honda et. al. 1999 knurenko et. al. 2013 Aiellie et. al. 2009 Mielke et. al. 1994 Siohan et. al. 1978 Aglietta et. al. 2009 Abreu et. al. 2012 Belov et. al. 2007 This Work
QGSJETII-4 Sibyll2.1 QGSJET01 EPOS-LHC Baltrusaitis et. al. 1999
Honda et. al. 1999 knurenko et. al. 2013 Aiellie et. al. 2009 Mielke et. al. 1994 Siohan et. al. 1978 Aglietta et. al. 2009 Abreu et. al. 2012 Belov et. al. 2007 This Work
FIG. 7 (color online). The proton-air cross section result of this work, including the statistical (outer/thinner) and systematic (inner/thicker) error bar. The result of this work is shown in comparison to other experimental results[1,2,28–34]. In addi-tion, the high-energy models (QGSJETII.4, QGSJET01, SIBYLL, EPOS-LHC) cross section predictions are also shown by solid line, fine dashed line, dotted line, and dashed line consecutively.
[mb] p-p tot σ
40 60 80 100 120 140 160 180 200 220
] -2 B [(GeV/c) 5 10 15 20 25 30 35 40
496 mb 567 mb 637 mb
FIG. 8. The elastic slopeBin (ðGeV=cÞ−2) vsσtotal
p−pin mb. The solid and the dotted curves are the relation betweenBandσtotal p−p for the constant value of the measuredσinel
p−airby the Telescope Array detector and the statistical error using Glauber Formalism. The dashed line is the BHS QCD inspired fit[8]. While the gray shaded area is the unitarity constraint.
(GeV) s
1 10 102 103 104 105
(mb) p-p σ 0 50 100 150 200 250 300 350 Fly’s Eye Akeno HiRes Auger This work pbar-p pp ppTOTEM even (QCD-Fit) nn σ
FIG. 9 (color online). The proton-proton cross section vs the center of mass energy result of this work, including the statistical (outer/thinner) and systematic (inner/thicker) error bars. Thepp¯ and theppdata are shown in smaller darker circles and square symbols consecutively[41]. The recent result from LHC is also shown by the star marker[42]. The result of this work is shown in comparison to previous work by cosmic rays detectors ([1,2,29,32]). The dashed curve is the QCD inspired fit by BHS[7].
MEASUREMENT OF THE PROTON-AIR CROSS SECTION… PHYSICAL REVIEW D92,032007 (2015)
032007-7
Figure 5. The Glauber calculation to convertσtot
p−p andBinto σinel
p−air. The three curves correspond toσ inel
p−airand its errors deter-mined in Sec.2.2. The straight line is the BHS fit and the shaded area is not allowed by the unitarity limit. (Figure from [5])
Figure 6.Theσtot
p−pas a function of
√
s. The result of this work is shown by a red filled circle with long and short arrows indicating statistical and systematic errors, respectively. (Figure from [5].)
TOTEM and ATLAS results. Interestingly BHS predicted B=(19.59±0.11) GeV−2at √s=14 TeV in their paper be-fore LHC [21] that is closer to the TOTEM result than the smooth extrapolation. A BHS prediction of σtotp−p = (107.9±1.2) mb is also in a good agreement with the TOTEM measurement σtotp−p = (110.6±3.4) mb. These good agreements with the latest (even unexpected) LHC results validate the usage of the BHS fit.
3 Muon measurements
3.1 Muon measurement by SD
Figure 7.The definition of geometrical parameters of each SD. (Figure from [6])
Because the TA SD is composed of thin plastic scintil-lators [3], the signal size from muon passage is essentially identical to that of electromagnetic particles, and the latter dominate the signal due to a higher flux at the ground level. Because of the same (or similar) response to different type of charged particles, TA SDs do not have high sensitivity of particle identification at the detector level. The fraction of muon density in EAS is a function of geometrical con-dition because the electromagnetic components attenuate faster than muons after shower maximum and at distance far from the core. In this study, the TA collaboration per-formed a data-MC comparison for different geometrical condition of each SD as shown in Fig.7. The zenith an-gle (θ), distance from the shower axis (R) and azimuthal angle of the SD with respect to the primary arrival direc-tion (ϕ) are used as geometrical parameters. When the sig-nal size is calculated using MC simulation, the fraction of muon signal after detector simulation, muon purity P, is also recorded. HigherP is expected for largerR, larger
θand largerϕ. The data-MC comparison was finally per-formed as a function ofP.
3.2 TA dataset and MC
In this analysis, TA SD data obtained in 7 years from May 2008 to May 2015 were used. The energy range was lim-ited between 1018.8eV and 1019.2eV to avoid possible en-ergy dependence. The enen-ergy scale used in the data anal-ysis is the one calibrated using the FD designated as EFD, while there is another energy scale ES Ddetermined by SD alone. A relation EFD=ES D/1.27 between two scales is used in the TA analyses.
MC simulations were performed using CORSIKA 6.960 with QGSJET II-03 and FLUKA2008.3C for high-and low-energy hadronic interactions, respectively, high-and EGS4 for electromagnetic interaction. A technique of thinning [23] and dethinning [24] was used to accelerate calculation speed. The detector response was calculated
using GEANT4 and the final output was formatted the same as the experimental data so that the output was pro-cessed in the identical pipeline as the experimental data. To extractP, the detector simulation was individually per-formed for different type of particles at the detector. It should be noted that in the MC data analysis, energy scal-ing from ES Dto EFDwas NOT applied because this cor-rection factor may also arise from the muon problem.
The primary protons were distributed between 1016.55eV and 1020.55eV following the energy spectrum by the HiRes experiment [25]. An isotropic distribu-tion up to θ=60◦ was also assumed. In addition, 0.05 muons/SD/±32µs were randomly added to account for the accidental background. Simulations of iron primary and with different hadronic interaction models were also per-formed and are discussed in Sec.3.3.
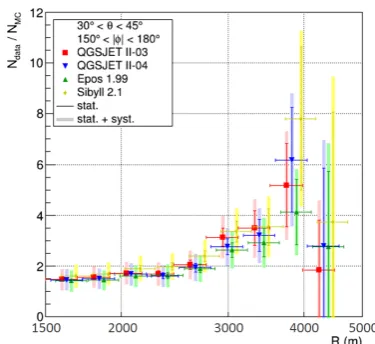
The signal size in units of vertical equivalent muons (VEM) in the SD area of 3 m2after analysis process as a function ofRis shown in Fig.8 (top). Events with recon-structed geometries 30◦< θ <45◦, 150◦ < |ϕ| <180◦ and 1018.8eV<E
S D<1019.2eV are selected. Results are plot-ted for the different type of particles together with the sum of all particles. The muon purityP, fraction of muon sig-nal size to total, defined from this result is shown in Fig.8 (bottom). An increase ofPas a function ofRis found as expected and it rises up to 0.7 whenR=3 km.
3.3 Results of TA data analysis
A data and MC comparison performed under the same conditions as Fig.8 is shown in Fig.9. The systematic un-certainty of the experimental data, ±(22-24)%, is domi-nated by the energy determination uncertainty using the FD. A clear excess of the experimental data to the MC prediction is found. The Ndata/NMC ratio shown in Fig.9 (bottom) shows an increasing trend withR. This suggests the cause of excess is due to muons because Palso in-creases at larger R. A drop of the ratio at the furtherest bin,>4 km, is because at this distance the signal is domi-nated by background.
The same analysis was repeated using different hadronic interaction models and iron primaries in the MC. The model dependent ratios are shown in Fig.10. Increas-ing ratio withRis found for all hadronic interaction mod-els. A comparison between proton and iron primaries us-ing QGSJET II-03 is shown in Fig.11. Because the heav-ier nuclear showers contain more muons than lighter ones, the MC simulation with iron primary results a smaller ratio than the proton primary. However, the ratio is still>1.
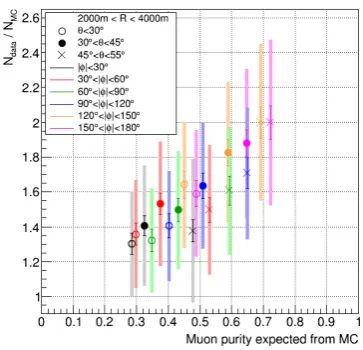
Finally, the Ndata/NMC ratios were calculated for var-ious geometrical conditions in θ andϕ and plotted as a function of muon purity Pin Fig.12. In this analysis R was fixed in the range between 2 km and 4 km where on average highPis expected as shown in Fig.8 (bottom). A positive correlation is found between the ratio andRand this also suggests that the excess is due to muons.
Figure 8.(Top) The simulated signal size in TA SD as a function ofRin a unit of VEM/3 m2for different type of particles and sum of them. (bottom) The muon purity as a function ofR. (Figure from [6])
([26] for example) although the threshold energy of muon detection and Rrange used in the analysis are different. The muon excess found in the TA data will also explain the cause of the discrepancy between ES D and EFD. Though the muon purity,P, at the core distance of 800 m, where the energy scale parameter is defined, is 20%, the muon excess may partly cause misunderstanding of the conver-sion relation.
4 Summary
Two studies by TA related to the hadronic interactions are reviewed in this paper. The proton-air inelastic cross sec-tionσinel
p−airand the proton-proton total cross sectionσ tot p−p at √sNN =95 TeV were determined using the 5 years of TA hybrid data with one of the 3 FD stations. Our results are consistent with the extrapolation of the previous results and various theoretical predictions, but constrain them at the highest energy point. The assumed relation between
σtot
p−pand the elastic slopeBis investigated with the recent
Figure 9.(Top) Data-MC comparison of signal size as a function ofR. (bottom) Data/MC ratio of the signal size. Statistical un-certainties are shown as thick lines while total errors are in gray lines. (Figure from [6])
Figure 11. Data/MC ratio of signal size as a function ofRfor proton (red circles) and iron (blue circles) primaries. (Figure from [6])
Figure 12. Data/MC ratio of signal size as a function ofRfor different geometrical conditions. (Figure from [6])
results at LHC. It is found that the BHS theory used in our analysis successfully predicted the LHC results of σtot
p−p andB. This reinforces the results of the TA analysis. Now TA has 10 years data and using 3 FD stations the statis-tics can be increased by a factor of 5.7. Analysis using this full dataset is ongoing and a significant improvement in the statistical uncertainty, that dominates the current re-sults, is assured. Further increase of statistics and hence extension to higher energy are also anticipated using the coming TA×4 data [27].
A new analysis technique to investigate the muon con-tents in EASs was developed. Instead of extracting num-ber of muons in the observed data, signal sizes of SD were compared between data and MC. According to the geo-metrical conditions of SD, the expected muon purity P was defined according to MC simulation. The TA SD data of 7 years were analyzed in a limited energy range from
1018.8eV to 1019.2eV. When the signal was compared as a function ofR, an excess was observed in the experimental data and it increased with Rfollowing the increase ofP. The same trend was observed using different hadronic in-teraction models and assuming iron primary. Though the amount of excess decreases with iron primary, it is still larger than unity. Results are divided in differentθandϕ ranges with a largeRrange of 2-4 km. The data/MC ra-tio shows a correlara-tion with P. All these measurements support an excess of muons in the experimental data com-pared to the MC predictions. This fact is also anticipated to explain the possible SD, FD discrepancy observed by TA.
Acknowledgments The Telescope Array experiment is supported by the Japan Society for the Promotion of Science(JSPS) through Grants-in-Aid for Priority Area 431, for Specially Promoted Research JP21000002, for Scientific Re- search (S) JP19104006, for Spe-cially Promote Research JP15H05693, for Scientific Research (S) JP15H05741 and for Young Scientists (A) JPH26707011; by the joint research program of the Institute for Cosmic Ray Research (ICRR), The University of Tokyo; by the U.S. National Science
Foundation awards PHY-0601915, PHY-1404495,
PHY-1404502, and PHY-1607727; by the National Re-search Foundation of Korea (2015R1A2A1A01006870,
2015R1A2A1A15055344, 2016R1A5A1013277,
2016R1A2B4014967, 2017R1A2A1A05071429); by
the Russian Academy of Sciences, RFBR grant 16-02-00962a (INR), IISN project No. 4.4502.13, and Belgian Science Policy under IUAP VII/37 (ULB). The foundations of Dr. Ezekiel R. and Edna Wattis Dumke, Willard L. Eccles, and George S. and Dolores Dore Eccles all helped with generous donations. The State of Utah supported the project through its Economic Development Board, and the University of Utah through the Office of the Vice President for Research. The experimental site became available through the cooperation of the Utah School and Institutional Trust Lands Administration (SITLA), U.S. Bureau of Land Management (BLM), and the U.S. Air Force. We appreciate the assistance of the State of Utah and Fillmore offices of the BLM in crafting the Plan of Development for the site. Patrick Shea assisted the collaboration with valuable advice on a variety of topics. The people and the officials of Millard County, Utah have been a source of steadfast and warm support for our work which we greatly appreciate. We are indebted to the Millard County Road Department for their efforts to maintain and clear the roads which get us to our sites. We gratefully acknowledge the contribution from the technical staffs of our home institutions. An allocation of computer time from the Center for High Performance Computing at the University of Utah is gratefully acknowledged.
References
[2] M. Fukushima, Prog. Theor. Phys. Suppl. 151, 206 (2003).
[3] T. Abu-Zayyad et al. (TA Collaboration), Nuclear In-struments and Methods in Physics Research SectionA 689, 87-97 (2012).
[4] H. Tokuno et al. (TA Collaboration), Nuclear Instru-ments and Methods in Physics ResearchA 676, 54-65 (2012).
[5] R. U. Abbasi et al. (TA Collaboration), Phys. Rev. D92, 032007 (2015).
[6] R. U. Abbasi et al. (TA Collaboration), Phys. Rev. D98, 022002 (2018).
[7] R. M. Baltrusaitis, G. L. Cassiday, J. W. Elbert, P. R. Gerhardy, S. Ko, E. C. Loh, Y. Mizumoto, P. Sokolsky, and D. Steck, Phys. Rev. Lett. 52, 1380 (1984).
[8] K. Belov et al. (HiRes Collaboration), Nucl. Phys. B, Proc. Suppl.151, 197 (2006).
[9] P. Abreu et al. (Pierre Auger Collaboration), Phys. Rev. Lett.109, 062002 (2012).
[10] R. Engel, T. Gaisser, P. Lipari, and T. Stanev, Phys. Rev.D58, 014019 (1998).
[11] C. Pryke, Astropart. Phys.14, 319 (2001).
[12] R. Glauber and G. Matthiae, Nucl. Phys.B21, 135 (1970).
[13] T. Gaisser, U. Sukhatme, and G. Yodh, Phys. Rev.D 36, 1350 (1987).
[14] R. U. Abbasi et al. (Telescope Array Collaboration), Astrophys. J.,858, 76 (2018).
[15] T. Pierog et al., Nucl. Phys. B, Proc. Suppl.151, 159 (2006).
[16] S. Ostapchenko, Phys. Rev.D 83, 014018 (2011). [17] N. Kalmykov, S. Ostapchenko, and A. Pavlov, Nucl.
Phys. B, Proc. Suppl.52, 17 (1997).
[18] E.-J. Ahn, R. Engel, T. K. Gaisser, P. Lipari, and T. Stanev, Phys. Rev.D 80, 094003 (2009).
[19] T. Pierog, I. Karpenko, J.M. Katzy, E. Yatsenko and K. Werner, Phys. Rev.C 92, 034906 (2015).
[20] R. Ulrich et al. (Pierre Auger Collaboration), PoS (ICRC2015) 401.
[21] M. Block, F. Halzen, and T. Stanev, Phys. Rev.D 62, 077501 (2000).
[22] G. Antchev et al. (TOTEM Collaboration), arXiv:1712.06153 [hep-ex].
[23] M. Kobal et al., Astropart. Phys.15, 259 (2001). [24] B. T. Stokes, R. Cady, D. Ivanov, J. N. Matthews, and
G. B. Thomson, Astropart. Phys.35, 759 (2012). [25] R. U. Abbasi et al. (High Resolution Fly s Eye
Col-laboration), Phys. Rev. Lett.100, 101101 (2008). [26] A. Aab et al. (Pierre Auger Collaboration), Phys.
Rev. Lett.117, 192001 (2016).
![Figure 3. Xmax distribution measured by TA. The line showsthe result of exponential fit in the range between 790 g/cm2 and1000 g/cm2 (Figure from [5].)comparison to other experimental results [1,2,28–34]](https://thumb-us.123doks.com/thumbv2/123dok_us/8122739.1353380/3.595.323.521.300.438/figure-distribution-measured-showsthe-exponential-figure-comparison-experimental.webp)
![Figure 7. The definition of geometrical parameters of each SD.(Figure from [6])](https://thumb-us.123doks.com/thumbv2/123dok_us/8122739.1353380/4.595.70.270.77.273/figure-denition-geometrical-parameters-sd-figure.webp)