Article
1
Hybrid Analytical Platform Based on
Field-2
Asymmetric Ion Mobility Spectrometry, Infrared
3
Sensing, and Luminescence-Based Oxygen Sensing
4
for Exhaled Breath Analysis
5
L. Tamina Hagemann, Stefan Repp, Boris Mizaikoff*
6
Institute of Analytical and Bioanalytical Chemistry (IABC), Ulm University, Albert-Einstein-Allee 11, 89081
7
Ulm, Germany; [email protected].
8
* Correspondence: [email protected]; Tel.: +49-731-50-22750
9
Received: date; Accepted: date; Published: date
10
Abstract: The reliable online analysis of volatile compounds in exhaled breath remains a challenge
11
as a plethora of molecules occur in different concentration ranges (i.e. ppt to %), and need to be
12
detected against an extremely complex background matrix. While this complexity is commonly
13
addressed by hyphenating a specific analytical technique with appropriate preconcentration and/or
14
preseparation strategies prior to detection, we herein propose the combination of three analytical
15
tools based on truly orthogonal measurement principles as an alternative solution: field-asymmetric
16
ion mobility spectrometry (FAIMS), Fourier-transform infrared (FTIR) spectroscopy-based sensors
17
utilizing substrate-integrated hollow waveguides (iHWG), and luminescence sensing (LS). These
18
three tools have been integrated into a single compact analytical platform suitable for online exhaled
19
breath analysis. The analytical performance of this prototype system was tested via artificial breath
20
samples containing nitrogen (N2), oxygen (O2), carbon dioxide (CO2) and acetone as a model volatile
21
organic compound (VOC) commonly present and detected in breath. Functionality of the combined
22
system was demonstrated by detecting these analytes in their respectively breath-relevant
23
concentration range and mutually independent of each other generating orthogonal yet correlated
24
analytical signals. Finally, adaptation of the system towards the analysis of real breath samples
25
during future studies is discussed.
26
Keywords: exhaled breath analysis; field-asymmetric ion mobility spectrometry; FAIMS;
Fourier-27
transform infrared spectroscopy; FTIR; luminescence sensing; infrared sensors; hyphenated
28
techniques; hybrid techniques; acetone; carbon dioxide; oxygen
29
30
1. Introduction
31
Breath contains a wide variety of molecules in largely different concentration ranges - from ppt
32
to percent - that are potentially useful for therapy monitoring and elucidation of metabolic pathways.
33
The analysis of such a complex sample by a single analytical techniques is almost impossible. Hence,
34
the combination of orthogonal analytical tools appears to be a viable strategy addressing this issue.
35
To date, predominantly preconcentration, e.g. via solid-phase microextraction (SPME) fibers and
36
needle trap devices (NTD), and/or preseparation schemes, e.g. gas chromatography (GC) or
37
multicapillary (MCC) columns are implemented for addressing trace concentrations, and for
38
reducing the sample complexity. By combining preseparation schemes with FID[1], mass
39
spectrometers, (e.g. TOF-MS[2]) or ion mobility based detectors, e.g. IMS[3] or DMS[4] potent
40
analytical tools have resulted. However, MS-based equipment - while being able to detect a very wide
41
variety of analytes - tends to be costly, bulky and frequently not suitable for online analysis. Also, if
42
only one type of detector is used, potentially useful analytes (i.e. biomarkers) that are not sensitive to
43
the selected detector type remain undetected.
44
Therefore, the integration of orthogonal detection schemes into a single hybrid analytical
45
platform is the next logical step. Only a few research groups have selected this path for exhaled breath
46
analysis. The probably most commonly selected approach is the use of electronic noses[5–10], i.e.
47
arrays of different colorimetric[8] or metal oxide sensors[9] individually responding to different types
48
of molecules. While these sensors arrays offer portable and rapidly responding breath detection
49
capabilities, specific biomarker identification and inter-device comparability remain challenging[11].
50
Vaks et al.[12] and Shorter et al.[13] both combined light sources emitting different wavelengths or
51
even wavelength regimes (i.e. subTHz, THz, IR) in order to broaden the scope of addressable analytes
52
in breath. However, even if these light sources complemented each other, hence providing
53
orthogonality to some extent the basic detection mechanism was essentially similar. Hence, molecules
54
not responding to the respective detection scheme (here, sufficient light absorption in the selected
55
wavelength regimes) will remain undetected. Consequently, truly orthogonal methods are based on
56
different physical principles generating the analytical signals, yet applied to the same sample. This
57
approach has already been proposed[14,15] and put into practice[10,16–20] by various research
58
groups. For example, Covington et al.[10] applied an eNose and GC-IMS to the same breath samples,
59
whereas Williams et al.[19] parallely used non-dispersive infrared analysis and PTR-TOF-MS on the
60
same sample set. It is important to notice though that all above-mentioned groups except Monks et
61
al.[20] applied different analytical methods as standalone-techniques, i.e. the used analytical devices
62
were not integrated into a single setup. This entails extensive sample handling – and potentially
63
associated handling errors – and extended analysis times, e.g. required for separate sample injection
64
and limits application at the patient bedside. Furthermore, with the exception of Williams et al.[19]
65
offline breath analysis was performed frequently involving gas bags or sample storage, and thus
66
taking the risk of cross-contamination and sample degradation.
67
Only few groups have developed hybrid analytical devices that enable online breath analysis
68
based on truly orthogonal principles integrated in a single sensing platform. Tiele et al.[21] published
69
a portable device for CO2 and O2 detection that additionally measured temperature and pressure.
70
Miekisch et al.[22,23] presented a multidimensional sensing platform including hemodynamic
71
monitoring as well as comprehensive breath monitoring via capnometry, spirometry and
PTR-TOF-72
MS, all being integrated into the same online monitoring platform. While Miekisch et al. analyzed
73
human breath, our research team has focused on exhaled mouse breath analysis within a mouse
74
intensive care unit (MICU) at the Institute of Anesthesiologic Pathophysiology and Method
75
Development (IAPMD) at Ulm University Medical Center, which requires as an additional challenge
76
the analysis of exceedingly (i.e. few hundreds of microliters) small breath sample volumes[24–26]. In
77
order to gain metabolic insights, 12CO2, 13CO2 and O2 concentrations as well as the respiratory quotient
78
(RQ) were evaluated using various analytical tools (iHWG-FTIR spectroscopy, interband cascade
79
laser based tunable diode laser absorption spectroscopy (TDLAS) and LS), which were all adapted to
80
the challengingly small breath volumes exhaled by a mouse or any comparable small animal model.
81
Besides these already quantifiable analytes in mouse breath, the detection of additional volatile
82
compounds such as acetone and H2S is currently in development for therapy monitoring and to aid
83
in understanding the underlying metabolism of traumatized mice.
84
Hence, the present study aims at extending the scope of addressable analytes in mouse breath
85
beyond CO2 and O2 by combining FTIR and LS with FAIMS serving as truly orthogonal analytical
86
methods. The detection principles of iHWG based FTIR spectroscopy[27], LS[28] and FAIMS[29] have
87
been described in detail elsewhere. O2 detection via LS was necessary, as O2 is neither IR active nor
88
does it give rise to a FAIMS signal. Furthermore, CO2 could not have been detected by the
89
luminescence sensor and is not ionizable by the 63Ni FAIMS ionization source, and hence, not
90
detectable by FAIMS. In turn, it provides a signal via IR spectroscopy/sensing techniques. Last but
91
not least, the luminescence sensor does not respond to VOCs, and the sensitivity of the selected IR
92
approach would not have allowed for VOC detection at the breath-relevant ppt or ppb concentration
93
range, even though a wide variety of breath-relevant VOCs are IR-active. Hence, integrating FAIMS
94
Synthetic breath samples containing N2, O2, CO2 and acetone as an exemplary breath VOC were
96
prepared and analyzed to demonstrate functionality of the developed hybrid prototype. The
97
presented data proves the feasibility of the integration of FAIMS, FTIR and LS into a single analytical
98
platform for simultaneous online analysis of O2, CO2 and acetone as a breath VOC representative. It
99
was shown that the detection of all analytes was possible in the respective breath-relevant
100
concentration range, and that FAIMS, FTIR and LS signals were independent of one another, yet
101
correlated as determined at the same time within the same sample.
102
103
2. Materials and Methods
104
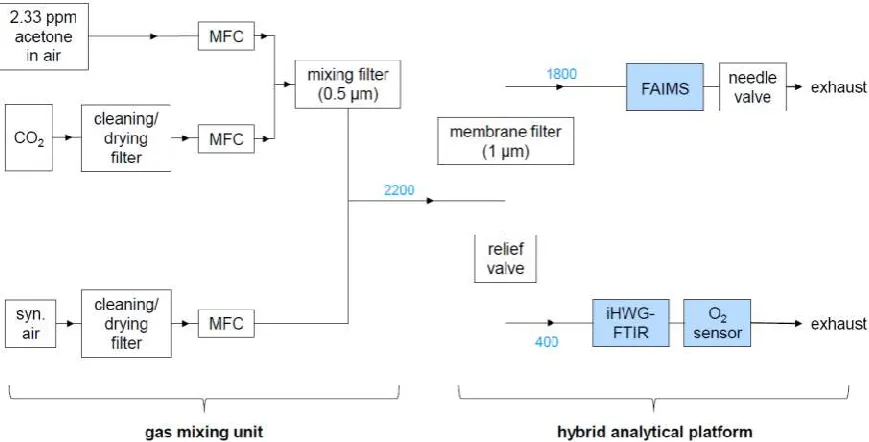
2.1 Hybrid Analytical Platform
105
2.1.1 Gas Sample Preparation
106
A stock gas mixture of 2.33 ppm acetone in synthetic air (± 0.23 ppm, MTI Industriegase,
Neu-107
Ulm, Germany) was diluted down by synthetic air (produced with 20.5 vol.% O2 grade 5.0, remains
108
N2 grade 5.0, H2O ≤ 5 ppmv, NO+NO2 ≤ 0.1 ppmv, low molecular weight hydrocarbons CnHm <
109
0.1 ppmv, by MTI Industriegase, Neu-Ulm, Germany) and CO2 (technical grade (DIN EN ISO 14175),
110
≥ 99.8 vol-%, N2 ≤ 1000 ppmv, H2O ≤ 120 ppmv, MTI Industriegase, Neu-Ulm, Germany) to eight
111
samples, containing acetone concentrations between 0 and 20 ppb and a background concentration
112
of 3, 4 or 5 % CO2 and 19.6 ± 0.5 % O2 (concentrations given here are volumetric concentrations). The
113
acetone, air and CO2 flow were regulated by mass flow controllers (Bronkhorst El Flow Prestige,
FG-114
201CV-RBD-11-K-DA-000, 80 mL/min full scale capactiy for acetone; FG-201CV-ABD-11-V-DA-000,
115
3000 mL/min full scale capacity for synthetic air; Vögtlin red-y smart series, type GSC-A9KS-BB22,
116
200 mL/min full scale capacity for CO2). For cleaning and drying purposes, air and CO2 were filtered
117
through active charcoal (# 20626, Restek, Bad Homburg, Germany), molecular sieve (5Å pore size,
118
# 8475.2, Carl Roth GmbH & Co KG, Karlsruhe, Germany) and sintered glass filter elements
119
(VitraPor®, 40-100 µm, 4-5.5 µm, 1.5 µm). The dew point of air and CO2 was measured to be -39.8°C
120
(humidity sensor SF52-2-X-T1-B, Michell Instruments, Ely, UK), corresponding to a water content of
121
192 ppm. The acetone sample gas was neither VOC filtered nor dried, since this would have caused
122
analyte loss. The water content in the acetone gas cylinder was assumed to be negligible due to the
123
dilution of acetone sample gas in comparatively big volumes of CO2/air.
124
Acetone and CO2 were mixed first, by leading their flow through a filter with 0.5 μm pore size
125
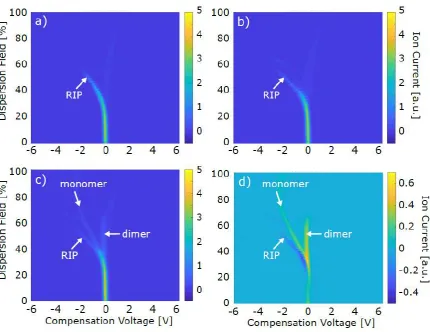
(SS-2TF-05, Swagelok, Reutlingen, Germany) to induce turbulences for homogeneous mixing. The
126
combined acetone/CO2 flow was then combined with the air flow. A schematic of the gas mixing unit
127
is displayed in Figure 1 (left half) in section 2.1.2 together with the hybrid FAIMS-FTIR-LS sensing
128
platform.
129
2.1.2 Hybrid FAIMS-FTIR-LS Platform and Concentration-Dependent Measurements
130
The hybrid analytical platform is displayed in Figure 1. Gas samples were provided by the gas
131
mixing unit displayed in the left half of Figure 1 and described in the previous section. The sample
132
flow produced by the gas mixing unit was constantly kept at 2200 mL/min. The relief valve
(SS-133
RL3S4, Swagelok, Reutlingen, Germany) between the gas mixing unit and the FTIR/O2 sensor unit
134
was adjusted so that the flow reaching the FTIR/O2 sensor unit was 400 ± 10 mL/min and the flow
135
through the FAIMS PAD was 1800 ± 30 mL/min. These flows were regularly checked on with a digital
136
flow meter (ADM1000, J&W Scientific, Folsom, CA, USA) at the outlet of the O2 sensor and with the
137
flow sensor integrated in the FAIMS PAD, respectively. To minimize analyte adsorption along the
138
tubing walls, perfluoroalkoxy alkane (PFA) tubings (1/8’’ and 1/4’’ outer diameter, Swagelok,
139
Reutlingen, Germany) and heated (41 °C) Sulfinert tubings (#29242, Restek, Bad Homburg, Germany)
140
142
Figure 1. Experimental setup comprising the gas mixing unit and the hybrid analytical platform.
143
Numbers in blue are gas flows in mL/min.
144
Before starting a measurement series, a hold time was adopted until flow and pressure had
145
stabilized in the FAIMS device (1800 ± 30 mL/min, 0.800 ± 0.020 barg) to ensure reproducibility of the
146
FAIMS data. In case the flow and pressure varied beyond the given limits, the needle valve at the
147
exhaust of the FAIMS as well as the relief valve between FAIMS and FTIR were adjusted until flow
148
and pressure had stabilized for at least ten minutes in the range defined above.
149
Each measurement series included eight acetone/CO2/air gas samples. Prior to the analysis of an
150
acetone/CO2/air mixture, one sample containing pure air and one sample containing only air and CO2
151
were recorded (see Table 1). During the pure air sample, the FTIR background was recorded, and the
152
according FAIMS spectrum was used to ensure that the system had entirely cleaned down after the
153
previous sample. The CO2/air measurement, on the other hand, served as a background spectrum for
154
FAIMS. Before analysis, the respective sample gas was led through the setup for at least two minutes
155
to ensure a constant analyte concentration in the whole setup and during the entire measurement.
156
Table 1: Overview on the measurement protocol within the hybrid setup.
order injected sample FAIMS iHWG-FTIR LS
1 pure air verifying system
cleanliness
background recording
-
2 CO2/air background
recording
- -
3 acetone/CO2/air acetone signal recording
CO2 signal recording
O2 signal recording 4 repeated for all further samples of a measurement series in random order
157
After recording a blank as the first sample of every measurement series, the remaining samples
158
were analyzed in a random sample order that was different in each measurement series. The CO2
159
concentration was constant (3, 4 or 5 %) within one measurement series. Three measurement series
160
were recorded per CO2 concentration. For all air, CO2/air and all acetone/CO2/air samples, five FAIMS
161
spectra (~19 min) and five FTIR spectra (~ 3.5 min) were successively recorded, while the sample was
162
continuously flowing through the hybrid setup. Simultaneously, the O2 concentration was
163
continuously monitored for the duration of the FAIMS measurements.
164
2.2 Details on the Individual Analytical Methods
166
2.2.1 Field-Asymmetric Ion Mobility Spectrometry
167
FAIMS data were recorded with an OEM FAIMS PAD (Owlstone Inc., Cambridge, UK), using
168
the Lonestar software (version 4.912, Owlstone Inc., Cambridge, UK). After ionization by a 63Ni
169
ionization source, analytes were detected by the FAIMS sensor (gap size 37 µm; RF waveform:
170
267 ± 2 V maximum peak-to-peak voltage, 26 MHz ± 26 Hz RF, 25 % Duty Cycle, 51 steps;
171
compensation voltage (CV) from -6 to +6 V (512 steps, ~4.5 s per full CV scan), flow 1800 ± 30 mL/min;
172
sensor temperature: 60 °C). The sample gas was continuously flowing through the spectrometer at
173
1800 ± 30 mL/min as the data were recorded. The pressure could be regulated via the needle valve
174
(SS-2MG-MH, Swagelok, Reutlingen, Germany) at the FAIMS outlet and was set to 0.800 ± 0.020 barg.
175
A membrane filter at the inlet of the FAIMS device (polytetrafluoroethylene (PTFE) membrane, 1 µm
176
pore size), heated to 100 °C to avoid analyte accumulation in the filter, prevented particle
177
introduction into the FAIMS PAD. In order to avoid charge build up, the intersweep delay between
178
two subsequent recordings was set to 1500 ms. The obtained FAIMS spectra, also called dispersion
179
plots, displayed the ion current on the detector (z axis) in dependence on the CV (x axis) and the
180
percentage of the dispersion field (DF) which was scanned by varying the peak-to-peak-voltage
181
between 0 and 267 V stepwise.
182
2.2.2 Substrate-Integrated Hollow Waveguide Coupled Fourier-Transform Infrared Spectroscopy
183
CO2 concentrations were monitored via iHWG coupled FTIR spectroscopy. The setup and gas
184
cell have been described in detail elsewhere[30]. Light from an ALPHA FTIR spectrometer (Bruker
185
Optik GmbH, Ettlingen, Germany) was coupled into an iHWG (aluminum, 7.5 cm optical path
186
length, 4x4 mm internal cross-section, produced by fine mechanical workshop West, Ulm University,
187
Ulm, Germany) and then onto the internal detector of the spectrometer via two gold-coated off-axis
188
parabolic mirrors (Thorlabs, MPD254254-90-M01, 2″ RFL). Using the software OPUS (version 7.2,
189
Bruker Optik GmbH, Ettlingen, Germany), IR spectra were recorded in the spectral range from 4000
190
to 400 cm-1 at a spectral resolution of 2 cm-1, with 20 averaged scans, and at a flow rate of
191
400 ± 10 mL/min. The Fourier transformation was done in OPUS, using the Blackman-Harris 3-term
192
apodization function. In order to exclude CO2 from ambient air from the optical absorption paths, the
193
entire IR setup was housed in a plastic bag which was purged with synthetic air for at least 15 minutes
194
prior to as well as during each measurement series.
195
2.2.3 Oxygen Sensing
196
A flow-through O2 sensor, detecting O2 based on luminescence quenching, (FireStingO2, Pyro
197
Science GmbH, Aachen, Germany)[28] was used for monitoring the O2 concentration, supported by
198
the Software FireSting Logger (version 2.365, PyroScience GmbH, Aachen, Germany). One data point
199
per second was recorded.
200
201
2.3 Data Processing
202
2.3.1 Field-Asymmetric Ion Mobility Spectrometry
203
Since a direct import of the FAIMS data (.dfm format) into Matlab was not possible, FAIMS data
204
were exported from the Lonestar software as text files and then imported into Matlab (R2018A, The
205
Mathworks Inc., Natick, MA, USA). For baseline correction, the average of the five repetitions of the
206
FAIMS dispersion plot of an CO2/air sample was substracted from the average of the five repetitions
207
of the subsequent acetone CO2/air sample. Acetone monomer and dimer peak volumes were
208
approximated by respectively summing all intensity values in selected regions of the dispersion plot
209
(monomer: 68 to 72 % DF, -2.75 to -1.95 V CV; dimer: 46 to 50 % DF, -0.35 to +0.45 V CV). These
210
compromise between achievable signal height and freedom from interferences with other spectral
212
components. The so obtained monomer and dimer peak volumes were then added together to obtain
213
the total acetone signal (from now on, only called “acetone signal”). Singly integrating the monomer
214
or the dimer peak would have distorted the FAIMS data evaluation: while the monomer peak was
215
very faint or even invisible at higher acetone concentrations, its contribution to the total acetone signal
216
at higher concentrations would not have been negligible.
217
After normalization with the mean acetone signal at the maximum measured acetone
218
concentration (20 ppb), the signal was averaged and the standard deviation was calculated. The
219
normalized and averaged acetone signal was plotted against the acetone concentration and an
220
asymptotic fit (y=A-B·Cx) was applied. Following IUPAC regulations[31], the concentration at the
221
limit of detection (LOD) and at the limit of quantification (LOQ) was estimated by inserting the signal
222
intensity at the LOD and the LOQ (µB + 3.29·σB and µB + 10·σB, respectively, with average normalized
223
signal intensity of the blank µB and its according standard deviation σB) into the inverse of the
224
calibration function (x=ln((A-Y)/B)/lnC).
225
2.3.2 Fourier-Transform Infrared Spectroscopy
226
IR data were imported from OPUS into Origin Pro 2017G. An exemplary spectrum is shown in
227
Figure A1 in the Appendix. For baseline correction, each IR spectrum was shifted by the median of
228
the data set, since the latter suitably represented the baseline. The area under the baseline-corrected
229
IR peak at 2360 cm-1 between 2200 and 2450 cm-1 was averaged for the five repetitions recorded in a
230
row for each sample. The so obtained CO2 signal was then normalized by division by the overall
231
maximum CO2 signal and the normalized signal was averaged for the three repetitions of the
232
measurement series recorded for each CO2 concentration (3, 4 and 5 % CO2). The according standard
233
deviation was calculated.
234
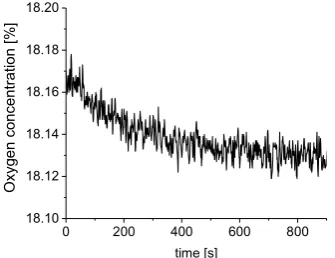
2.3.3 Oxygen Sensing
235
For each measurement, the O2 concentrations directly output by the FireSting Logger software
236
was averaged for the time span between 5 and 15 min after starting the O2 measurement. O2
237
concentrations recorded between 0 and 5 min were not included in the average, because the O2
238
concentration reached an equilibrium after approximately 5 min (see Figure A2 in the Appendix).
239
The so obtained O2 signal was then normalized by division by the overall mean O2 signal; the
240
normalized signal was averaged for the three repetitions of the measurements series recorded for
241
each CO2 concentration and the standard deviation was calculated.
242
243
3. Results and Discussion
244
3.1 FAIMS Results
245
As mentioned above, FAIMS dispersion plots of pure air and of CO2/air were recorded before
246
recording an acetone/CO2/air containing sample (for further detail also see Table 1 in Section 2.1.2).
247
Figure 2 exemplarily shows a dispersion plot for each sample type collected in positive mode. The
248
dispersion plot of pure air (Figure 2a) mainly showed the reactant ion peak (RIP), which, in positive
249
detection mode, appears due to the formation of ionized clusters of water molecules present in the
250
carrier gas[32]. The faint vertical signal in Figure 2a at around 0 V CV was approximately constant
251
for all recorded dispersion plots. It could not be erased throughout the whole project and was likely
252
to be caused by substances emitted from the tubings and the FAIMS device itself. The CO2/air
253
dispersion plot (Figure 2b) also mainly showed the RIP. No clear analyte peak appeared, since CO2
254
is not ionizable by the 63Ni source. The faint additional trace at around -65 % DF and -3 V CV
255
assumably occurred because of contaminations from the CO2 gas bottle that could not be entirely
256
removed by the used filters. The acetone/CO2/air dispersion plot (Figure 2c) showed an intensity
257
decrease of the RIP as well as the appearance of two main additional peaks. Generally, once an
258
carrier gas clusters are replaced by the analyte molecules. Hence, the RIP intensity decreases and a
260
monomer and/or dimer peak appear, respectively. The tentative assignment of monomer and dimer
261
peak, as it is indicated in Figure 2c, was based on the concentration-dependent behavior of both
262
peaks: while the monomer peak intensity showed an intensity maximum at lower concentrations, the
263
dimer peak constantly increased with increasing acetone concentration, as an additional water
264
molecule in each monomer cluster was replaced by a second acetone molecule, thus forming a dimer
265
cluster. The relative position of monomer and dimer peak also was in accordance with our
266
expectations and thus substantiated our peak assignment: the lighter, less bulky and hence more
267
mobile monomer cluster gave rise to a peak at a lower CV than the less mobile dimer cluster. The
268
exact origin of the faint feature between monomer and dimer peak in Figures 2c and 2d
269
(~50 %DF, -0.5 V CV) is unknown, but its potential effect is commented on in section 3.2. In order to
270
obtain the net monomer and dimer signal, Figure 2b was subtracted from Figure 2c for background
271
substraction. The resulting data is shown in Figure 2d. The z axis of Figure 2d was varied compared
272
to Figures 2a to 2c in order to make the monomer and dimer peak more clearly visible. At the position
273
where the RIP appeared in Figure 2a to 2c, the signal intensity was negative in Figure 2d, since the
274
RIP intensity decreased while acetone was present in the FAIMS sensing region.
275
276
Figure 2. FAIMS dispersion plots. (a) pure air sample (b) CO2/air sample (c) acetone/CO2/air sample
(d) background substracted acetone/CO2/air sample ((c) minus (b)). CO2 and acetone concentration of
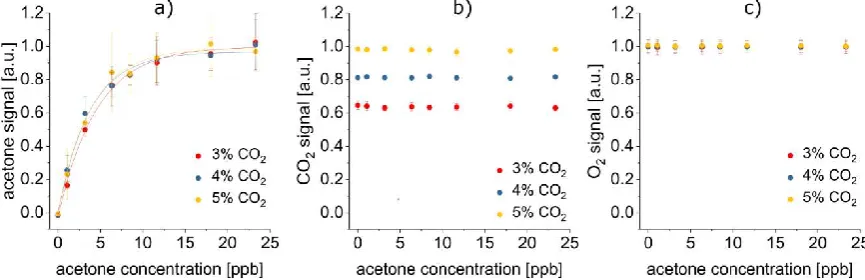
3.2 Co-Dependencies of Acetone, CO2 and O2 Signal
277
The normalized total acetone signal, composed of monomer and dimer peak volume, was
278
plotted against the acetone concentration, shown for 3, 4 and 5 % CO2 in Figure 3a. Due to saturation
279
of the FAIMS detector, the acetone signal converged towards a maximum value for higher acetone
280
concentrations. Thus, an asymptotic fit was applied. It is obvious from Figure 3a, that the acetone
281
signal was statistically identical, regardless if the CO2 concentration was 3, 4 or 5 %. Likewise, the
282
according analytical figures of merit, i.e. LOD, LOQ, R2 and parameters of the asymptotic fit, did not
283
depend on the CO2 concentration (see Table 2). Hence, the CO2 concentration did not have any effect
284
on the FAIMS results. Reversely, Figure 3b and 3c reveal, that the acetone concentration did neither
285
affect the CO2 nor the O2 signal. Also, the O2 signal did not change depending on the CO2
286
concentration, but stayed constant irrespective if 3, 4 or 5 % CO2 were present. In conclusion, no
287
mutual co-dependencies of the acetone, CO2 and O2 signal were detected.
288
Table 2: Analytical figures of merit of the concentration-dependent FAIMS measurements of acetone. No statistical difference between fit parameters A, B and C of the asymptotic fit (equation y = A - B·Cx) at 3, 4 or 5 % CO2. R2, concentration at LOD and concentration at LOQ varied, yet with
no clear trend visible depending on the CO2 content. This indicates independence of the acetone
signal from the CO2 concentration.
3 % CO2 4 % CO2 5 % CO2
fit parameter A 0.998 ± 0.019 0.964 ± 0.025 0.989 ± 0.023 fit parameter B 1.024 ± 0.025 0.962 ± 0.038 0.997 ± 0.034 fit parameter C 0.803 ± 0.012 0.765 ± 0.022 0.772 ± 0.019
R2 > 0.995 0.989 0.992
LOD [ppt] 145 78 56
LOQ [ppt] 358 405 165
289
The FAIMS error bars shown in Figure 3a are relatively big compared to the FTIR and LS error
290
bars in Figures 3b and 3c, respectively. Several different sources have presumably contributed to the
291
acetone signal variance. First, three slight features apart from RIP, monomer and dimer peak were
292
visible in the dispersion plots of the acetone/CO2/air sample (see Figure 3c at ~65 % DF / -3 V CV, at
293
~50 % DF / -0.5 V CV and at ~75 % DF / +0.5 V CV). As mentioned before, these possibly appeared
294
due to contaminations from the CO2 gas bottle and due to evaporations from the tubings and the
295
FAIMS itself. Even if they do not seem to have fundamentally impacted the obtained data, these
296
contaminations might still have competed with acetone for the ionization energy in the FAIMS
297
Figure 3: No mutual signal co-dependencies of acetone, CO2 and O2 were detected. All displayed error bars are
1σ error bars. (a) Acetone signals recorded with FAIMS depend on the acetone concentration (asymptotic fit y = A – B·Cx), yet is independent of the CO2 content. (b) CO2 signals recorded by iHWG-FTIR only vary
depending on the CO2 concentration. (c) O2 signals recorded by LS are neither influenced by the acetone nor by
ionization region, therefore possibly altering the acetone signal intensity and increasing the
298
associated error bars. Furthermore, it cannot be excluded that slight humidity variations occured,
299
additionally enhancing the variance of the acetone signal. Finally, the saturation of the FAIMS
300
detector at higher acetone concentrations can be assumed to also have made a contribution to the
301
signal variance.
302
3.3 Towards Real Breath Analysis
303
It is our goal to further develop the hybrid FAIMS-FTIR-LS platform towards online analysis of
304
mouse breath. Already with the current setup, the detection of the main breath components CO2, O2
305
and acetone, as a breath VOC representative, was possible in breath-relevant concentrations.
306
Especially the fact that breath VOC detection is possible down to LODs and LOQs in the low to
307
medium ppt range with this hybrid setup, makes it a promising tool for real breath analysis, since
308
breath VOCs most often occur in ppt to ppb concentrations[33]. Furthermore, O2, CO2 and acetone
309
signal were found to be mutually independent. This underlines the excellent orthogonality of FAIMS,
310
FTIR spectroscopy and LS, making their combination especially suitable for a complex matrix like
311
exhaled breath: simply by selecting a suitable combination of analytical methods, a first – at least
312
virtual – “preseparation” of the sample components has been undertaken, thus already simplifying
313
the analytical task.
314
Nevertheless, the hybrid setup and the experiments conducted with it need to be further evolved
315
before online analysis of real mouse breath is possible. First, unlike in our model samples, of course
316
more than one VOC is present in real breath. All these breath VOCs will compete for the FAIMS
317
ionization energy and therefore cause co-dependencies of their signals. To prevent this, preseparation
318
based on a GC or an MCC column will be integrated into the hybrid setup, enabling the VOCs to
319
reach the ionization region one by one. Since the contaminations discussed above (see Figure 2c) will
320
also be separated from the analytes via the GC or MCC column, the FAIMS signal variance may
321
additionally benefit from the preseparation scheme. Furthermore, alkanes, as an important class of
322
breath VOCs[34], cannot be detected with the current setup, because they are not ionized by the 63Ni
323
ionization source. This problem could be overcome by taking advantage of the modular flexibility of
324
the FTIR detection unit: extending the optical path length of the iHWG and replacing the FTIR
325
spectrometer by a more intense light source like a tunable quantum cascade laser, the LOD/LOQ for
326
alkane detection via FTIR could be shifted to breath-relevant concentrations. Moreover, the samples
327
tested until now only contained minimal amounts of water, whereas real breath is oversaturated with
328
humidity. Since the FAIMS detection mechanism is based on ionized water clusters, changes in
329
humidity have a major effect on the FAIMS signal intensity. Here, chemometric data treatment in
330
dependence of the present water level or experimentally filtering out the humidity by a condenser as
331
proposed by Maiti et al.[35], which is explicitly suitable for dehumidifying breath without significant
332
VOC loss, could be possible solutions.
333
4. Conclusions
334
A compact hybrid sensing platform enabling orthogonal analysis of gas/vapor phase samples based
335
on FAIMS, FTIR and LS was presented, and its utility online analysis of synthetic breath samples
336
containing acetone, CO2 and O2 was demonstrated. It was shown that the signals of these compounds
337
were independent of one another, and that all three components could be detected at their respective
338
breath-relevant concentrations. The LOQ of acetone could even be lowered to the medium ppt
339
concentration range, which renders the method a promising approach for the potential analysis of
340
trace level breath VOCs. Yet, challenges according to nonetheless integrating additional analyte
341
preconcentration/-separation strategies and dealing with high humidity levels will need to be
342
resolved prior to the useful analysis of real-world exhaled breath samples, and will be addressed
343
during future studies.
344
Abbreviations: Å Angström, barg unit for gauge pressure in bar (pressure in bar exceeding atmospheric
345
pressure), CO2 carbon dioxide, CV compensation voltage, DF dispersion field, FAIMS field-asymmetric ion
mobility spectrometry, FTIR Fourier-transform infrared spectroscopy, GC gas chromatography, IABC Institute
347
for Analytical and Bioanalytical Chemistry, IAPMD Institute for Anesthesiological Pathophysiology and
348
Method Development, iHWG substrate-integrated hollow waveguide, min minutes, LS luminescence sensing,
349
MCC multicapillary column, µL microliter, MICU mouse intensive care unit, N2 nitrogen, O2 oxygen, OEM
350
original equipment manufacturer, PFA perfluoroalkoxy alkane, ppb parts per billion, ppm parts per million, ppt
351
parts per trillion, PTFE polytetrafluoroethylene, RIP reactant ion peak, RQ respiratory quotient, TDLAS tunable
352
diode laser absorption spectroscopy, THz Terahertz, VOC volatile organic compound, °C degree Celsius.
353
Acknowledgments: This work was supported by the Research training group PULMOSENS at Ulm University
354
(GRK 2203) and by the German National Academic Foundation (Studienstiftung des Deutschen Volkes).
355
Author Contributions: Conceptualization: B.M., L.T.H.; Design, establishment and optimization of setup:
356
L.T.H.; Design of experiment: L.T.H.; Final data acquisition: S.R.; Data evaluation: S.R., L.T.H.; Writing original
357
draft: L.T.H.; Writing-review and editing: B.M., S.R.; Funding acquisition: B.M., L.T.H.; All authors read and
358
approved the final manuscript.
359
Conflicts of Interest: The authors declare no conflict of interest. The founding sponsors had no role in the design
360
of the study; in the collection, analyses, or interpretation of data; in the writing of the manuscript, and in the
361
decision to publish the results.
362
Appendix
363
The primary signals of CO2 and O2 recorded by FTIR spectroscopy and LS, respectively, are
364
shown in Figure A1 and A2.
365
366
Figure A1: IR spectrum of 4 % CO2. Acetone theoretically also is IR active, but is not detected here
367
due to its extremely low concentrations in the ppb range.
368
369
Figure A2: O2 concentration as detected by the luminescence sensor.
370
References
371
1. Mueller, W.; Schubert, J.; Benzing, A.; Geiger, K. Method for analysis of exhaled air by microwave energy
372
desorption coupled with gas chromatography-flame ionization detection-mass spectrometry. J.
373
Chromatogr. B Biomed. Appl.1998, 716, 27–38.
374
1000 2000
3000 4000
0.0 0.5 1.0 1.5 2.0 2.5
CO
2
Abs
or
b
ance [1
]
Wavenumber [cm-1]
0 200 400 600 800 18.10
18.12 18.14 18.16 18.18 18.20
Oxyg
en
co
ncentration [%
]
2. Smolinska, A.; Klaassen, E.M.M.; Dallinga, J.W.; Van De Kant, K.D.G.; Jobsis, Q.; Moonen, E.J.C.; Van
375
Schayck, O.C.P.; Dompeling, E.; Van Schooten, F.J. Profiling of volatile organic compounds in exhaled
376
breath as a strategy to find early predictive signatures of asthma in children. PLoS One2014, 9, e95668.
377
3. Hüppe, T.; Lorenz, D.; Maurer, F.; Albrecht, F.W.; Schnauber, K.; Wolf, B.; Sessler, D.I.; Volk, T.; Fink, T.;
378
Kreuer, S. Exhalation of volatile organic compounds during hemorrhagic shock and reperfusion in rats:
379
An exploratory trial. J. Breath Res.2016, 10, 16016.
380
4. Basanta, M.; Koimtzis, T. Sampling and analysis of exhaled breath on human subjects with thermal
381
desorption- gas chromatography- differential mobility spectrometry. Int. J. Ion Mobil. Spectrom.2006, 9,
382
45–49.
383
5. Di Natale, C.; Macagnano, A.; Martinelli, E.; Paolesse, R.; D’Arcangelo, G.; Roscioni, C.; Finazzi-Agrò,
384
A.; D’Amico, A. Lung cancer identification by the analysis of breath by means of an array of
non-385
selective gas sensors. Biosens. Bioelectron.2003, 18, 1209–1218.
386
6. Machado, R.F.; Laskowski, D.; Deffenderfer, O.; Burch, T.; Zheng, S.; Mazzone, P.J.; Mekhail, T.;
387
Jennings, C.; Stoller, J.K.; Pyle, J.; et al. Detection of lung cancer by sensor array analyses of exhaled
388
breath. Am. J. Respir. Crit. Care Med.2005, 171, 1286–1291.
389
7. Peng, G.; Tisch, U.; Adams, O.; Hakim, M.; Shehada, N.; Broza, Y.Y.; Billan, S.; Abdah-Bortnyak, R.;
390
Kuten, A.; Haick, H. Diagnosing lung cancer in exhaled breath using gold nanoparticles. Nat.
391
Nanotechnol.2009, 4, 669–673.
392
8. Mazzone, P.J.; Wang, X.F.; Xu, Y.; Mekhail, T.; Beukemann, M.C.; Na, J.; Kemling, J.W.; Suslick, K.S.;
393
Sasidhar, M. Exhaled Breath Analysis with a Colorimetric Sensor Array for the Identification and
394
Characterization of Lung Cancer. J. Thorac. Oncol.2012, 7, 137–142.
395
9. De Vries, R.; Brinkman, P.; Van Der Schee, M.P.; Fens, N.; Dijkers, E.; Bootsma, S.K.; De Jongh, F.H.C.;
396
Sterk, P.J. Integration of electronic nose technology with spirometry: Validation of a new approach for
397
exhaled breath analysis. J. Breath Res.2015, 9, 46001.
398
10. Tiele, A.; Wicaksono, A.; Kansara, J.; Arasaradnam, R.P. Breath Analysis Using eNose and Ion Mobility
399
Technology to Diagnose Inflammatory Bowel Disease — A Pilot Study. Biosensors2019, 9, 55–70.
400
11. Fens, N.; van der Schee, M.P.; Brinkman, P.; Sterk, P.J. Exhaled breath analysis by electronic nose in
401
airways disease. Established issues and key questions. Clin. Exp. Allergy2013, 43, 705–715.
402
12. Vaks, V.L.; Domracheva, E.G.; Pripolzin, S.I.; Chernyaeva, M.B. Multifrequency high precise
subTHz-403
THz-IR spectroscopy for exhaled breath research. Terahertz Emit. Receiv. Appl. VII2016, 9934, 99340E–1
404
to 99340E–10.
405
13. Shorter, J.H.; Nelson, D.D.; McManus, J.B.; Zahniser, M.S.; Milton, D.K. Multicomponent Breath Analysis
406
With Infrared Absorption Using Room-Temperature Quantum Cascade Lasers. NIH Public Access2010,
407
10, 76–84.
408
14. Ibrahim, W.; Wilde, M.; Cordell, R.; Salman, D.; Ruszkiewicz, D.; Bryant, L.; Richardson, M.; Free, R.C.;
409
Zhao, B.; Yousuf, A.; et al. Assessment of breath volatile organic compounds in acute cardiorespiratory
410
breathlessness: A protocol describing a prospective real-world observational study. BMJ Open2019, 9,
411
1–13.
412
15. Inside the Breath Cluster https://www.insidebreath.com/en/, accessed on April 30th 2019.
413
16. Dharmawardana, N.; Ooi, E.; Goddard, T.; Woods, C.; Watson, D.; Yazbek, R. Characterization of breath
414
volatile organic compounds in patients with upper aerodigestive mucosal squamous cell carcinoma.
415
IABR Breath Summit 2018.
416
early diagnosis of post-operative complications following colorectal cancer and segmental resection.
418
IABR Breath Summit 2018.
419
18. Shimouchi, A.; Jinno, N.; Taniguchi, K.; Okumura, N.; Miyamoto, Y. Volatile compounds in exhaled air
420
associated with scores of general physical and mental conditions. IABR Breath Summit 2018.
421
19. Williams, J.; Stönner, C.; Wicker, J.; Krauter, N.; Derstroff, B.; Bourtsoukidis, E.; Klüpfel, T.; Kramer, S.
422
Cinema audiences reproducibly vary the chemical composition of air during films, by broadcasting
423
scene specific emissions on breath. Sci. Rep.2016, 6, 1–10.
424
20. Wilde, M.J.; Cordell, R.L.; Salman, D.; Zhao, B.; Ibrahim, W.; Bryant, L.; Ruszkiewicz, D.; Singapuri, A.;
425
Free, R.C.; Gaillard, E.A.; et al. Breath analysis by two-dimensional gas chromatography with dual flame
426
ionisation and mass spectrometric detection – method optimisation and integration within a large-scale
427
clinical study. J. Chromatogr. A2019, 1594, 160–172.
428
21. Tiele, A.; Covington, J. Design and development of an end-tidal breath capture device. IABR Breath
429
Summit 2018.
430
22. Sukul, P.; Trefz, P.; Kamysek, S.; Schubert, J.K.; Miekisch, W. Instant effects of changing body positions
431
on compositions of exhaled breath. J. Breath Res.2015, 9, 47105.
432
23. Sukul, P.; Schubert, J.K.; Kamysek, S.; Trefz, P.; Miekisch, W. Applied upper-airway resistance instantly
433
affects breath components: A unique insight into pulmonary medicine. J. Breath Res.2017, 11, 47108.
434
24. Fortes, P.R.; Wilk, A.; Seichter, F.; Cajlakovic, M.; Koestler, S.; Ribitsch, V.; Wachter, U.; Vogt, J.;
435
Radermacher, P.; Carter, C.; et al. Combined sensing platform for advanced diagnostics in exhaled
436
mouse breath. Front. Biol. Detect. From Nanosensors to Syst. V2013, 8570, 85700Q–1 to 85700Q–9.
437
25. Seichter, F.; Tütüncü, E.; Hagemann, L.T.; Vogt, J.; Wachter, U.; Gröger, M.; Kress, S.; Radermacher, P.;
438
Mizaikoff, B. Online monitoring of carbon dioxide and oxygen in exhaled mouse breath via
substrate-439
integrated hollow waveguide Fourier-transform infrared- luminescence spectroscopy. J. Breath Res.2018,
440
12, 036018.
441
26. Tütüncü, E.; Nägele, M.; Becker, S.; Fischer, M.; Koeth, J.; Wolf, C.; Köstler, S.; Ribitsch, V.; Teuber, A.;
442
Gröger, M.; et al. Advanced Photonic Sensors Based on Interband Cascade Lasers for Real-Time Mouse
443
Breath Analysis. ACS Sensors2018, 3, 1743–1749.
444
27. Wilk, A.; Chance Carter, J.; Chrisp, M.; Manuel, A.M.; Mirkarimi, P.; Alameda, J.B.; Mizaikoff, B.
445
Substrate-integrated hollow waveguides: A new level of integration in mid-infrared gas sensing. Anal.
446
Chem.2013, 85, 11205–11210.
447
28. Seichter, F.; Vogt, J.; Radermacher, P.; Mizaikoff, B. Nonlinear calibration transfer based on hierarchical
448
Bayesian models and Lagrange Multipliers: Error bounds of estimates via Monte Carlo – Markov Chain
449
sampling. Anal. Chim. Acta2017, 951, 32–45.
450
29. Covington, J.A.; van der Schee, M.P.; Edge, A.S.L.; Boyle, B.; Savage, R.S.; Arasaradnam, R.P. The
451
application of FAIMS gas analysis in medical diagnostics. Analyst2015, 140, 6775–6781.
452
30. Hagemann, L.T.; McCartney, M.M.; Fung, A.G.; Peirano, D.J.; Davis, C.E.; Mizaikoff, B. Portable
453
combination of Fourier transform infrared spectroscopy and differential mobility spectrometry for
454
advanced vapor phase analysis. Analyst2018, 143, 5683–5691.
455
31. Inczédy, A. IUPAC Compendium of Analytical Nomenclature: Definitve Rules. Chapter 18.4.3.7; 3rd ed.; 1997;
456
32. Eiceman, G.A.; Karpas, Z. Ion Mobility Spectrometry; 2nd ed.; Taylor & Francis Group LLC: Boca Raton,
457
FL, USA, 2005;
458
33. Phillips, M. Method for the collection and assay of volatile organic compounds in breath. Anal. Biochem.
459
34. Cheepsattayakorn, A.; Cheepsattayakorn, R. Breath tests in respiratory and critical care medicine: From
461
research to practice in current perspectives. Biomed Res. Int.2013, 2013, 702896.
462
35. Maiti, K.S.; Lewton, M.; Fill, E.; Apolonski, A. Sensitive spectroscopic breath analysis by water
463
condensation. J. Breath Res.2018, 12, 046003.