Available online:
http://edupediapublications.org/journals/index.php/IJR/
P a g e | 207Visibility and Shopper Type in Explaining Navigation within a
Shopping Mall
Sumanta Deb & Dr. Keya Mitra
1
Research Scholar, Dept. of Architecture T & RP, IIEST Shibpur, India
2Professor and Head, Dept. of Architecture T & RP, IIEST Shibpur, India
Abstract:
The purpose of this paper is to establish a framework for understanding navigation behavior in a mall in terms of achievement orientation and visibility and extending the knowledge in location decision of shops. Navigation of customers within a shopping mall is significant for achieving economic sustenance as reflected in retail management literature. Visibility on the other hand has been identified in the field of architecture and urban design as predictor of movement within a built environment. Visibility, therefore, has been selected in this paper as the environmental factor responsible for navigation in malls along with signage. Achievement orientation is selected in lieu of personal factor. The influence of achievement orientation on navigational preferences has been tested for respondents based on their pre and post signage predilection. It is found that low achievement orientation shoppers explore a built environment based on high visibility and vice versa. Visual configuration can be selected as a potential tool for location of stores in a shopping mall
Keywords Achievement orientation, Navigation, Signage, Shopping Mall, Visibility
1.
Introduction
Navigation and way finding behavior has been attracting attention for several years specifically in the architecture and urban design literature. With the advent of environmental psychology as a discipline, behavior has been described as a function of environmental and personal factors [17]. Later researches confirm that navigation, as a behavior, is influenced by human and individual differences [e.g., 18, 19, 21].
Navigation is extremely significant for shopping malls as explained by the researches in the configurational studies in retail management [e.g., 26, 4, 6] relying on the logic of bid-rent because it influences the sales of a tenant store. Understanding navigation behavior in shopping malls, therefore, is an interesting area of study.
Researches in the field of architecture suggest visibility as a significant factor behind navigational preferences. But knowledge of configuration can explain only a portion of navigational behavior without knowledge of personal factors. Studies of shopper characteristics are confined to the marketing and retail enquiries and their findings are targeted at retail professionals. Studies on configuration on
the other hand are limited to architectural researches. It is therefore an interesting area of study to explain navigational behavior in a shopping mall with respect to shopper characteristics and configurational factors.
2.
Background of the Research
For understanding the navigation behavior, environmental and personal factors have to be properly defined and understood. These factors are discussed below in details.
2.1.Environmental Factors
2.1.1.Relationship between Navigation and Visibility
A rich body of literature from architecture indicates a significant role of visual fields in experiencing built structures and shaping patterns of use of space. Frankl [11] mentioned that our visual perception of any built structure affect our cognitive interactions with that environment and not only the aesthetic appreciation of architecture, as the common wisdom suggests. Different literature advocate different kinds of cognitive process and behavior influenced by visibility in a built environment: visibility of displays in museums to affect visitor‟s movement; influence of visibility on movement between workstations and on interactions between employees; influence of visibility in way finding behavior.
Research results in the field of architecture and environmental psychology indicates the role of visibility in shaping patterns of use of space [e.g. 3, 11,14]. Researches [e.g. 2, 24, 25, 10] applied visibility analysis in explaining movement and found that spaces with higher visibility enjoys higher accessibility.
2.1.2.Signages and Visual Cues
Researches in the field of retail identified the impact of signage and visual cues on indoor navigation [15, 19, 20, 23]. Signage has been considered as an environmental factor along with visibility in influencing navigation.
2.2.Personal Factor: Achievement orientation
Available online:
http://edupediapublications.org/journals/index.php/IJR/
P a g e | 208 and express consumers‟ needs and wants. Titus andEverett [23] have shown that shopping orientations (hedonic or utilitarian) play a significant role behind way-finding behavior
This paper attempts to identify the impact of these environmental and personal factors behind navigation preferences in shopping malls.
3.
Methodology
This navigation behavior is rather difficult to measure in real situations/ actual settings as most of the movement decisions in a shopping mall are guided by prior experiences. So, for any enquiry, it is difficult to segregate the movements influenced by spatial factors from the movements influenced by prior experiences. A proper methodology, therefore, has to be resorted to for measuring navigation at shopping mall junctions. Authors like Franz & Weiner; Weiner et al. and Dalton [12,27,8] have shown that computer generated stimuli, approximating physical spaces, can be exploited ,instead, as a usable tools for recording behavioral tendencies. A survey was conducted to record navigational preferences using representative computer generated pictures (Figure 1) of junctions in hypothetical shopping mall with multiple directional choices. The pictures were shown to the respondents and their preferences for moving in a particular direction were recorded. It was conveyed to the respondents prior to the survey that, unless otherwise shown, there were shops of similar types with no perceivable „brand‟ differences in all the directions available to them.
Figure 1. Scenes of the computer generated shopping mall junctions shown to the respondents for recording
navigational preferences
Among the two pictures shown to the respondents in the survey, the picture in the left shows a foreground with a blank wall at one end. Visibility to the left beyond this wall is more than the visibility to the right, where another wall at right angle to the first narrows the gap and blocks vision. The second one, at the right, is the first situation except a logo of „McDonalds‟ is placed to the right side of the blank wall.
At the beginning of the structured questionnaire, a short description was provided to ensure the clarity of content when answering the questions. As English is most commonly spoken and written language in Urban India the survey instrument was written and the interviews were conducted in English
.
3.1.Sample
Data were collected from 10th September, 2016 to 16th
November, 2017 using mall intercept survey technique
which involves face-to-face interviewing [5]. The interviews were taken at four shopping malls in Kolkata, intercepting a sample of passing by consumers whether they would be willing to participate in a research study [22]. The target population consisted of active mall shoppers. Those who visit a shopping mall less than four times a year are excluded from the study.
3.2.Survey Instrument
A structured questionnaire was developed and administered to the respondents. The survey instrument consisted of items adapted from established scales. A total of 119 respondents participated in the survey. A seven-point Likert Type scale with anchors of “Strongly Disagree” (1) to “Strongly Agree” (7) was used for all items except behavioural intentions and demographics.
In order to determine the underlying dimensions in this study, Principal Component Analysis (PCA) with Varimax rotation was performed with SPSS 20.0 for all constructs in the analysis. Item loading above 0.50 was retained [13]. Reliability of the measurement scales were evaluated using Cronbach‟s Alpha value. A Cronbach‟s Alpha value of more than 0.7 is commonly acceptable [7].
4.
Analysis
4.1.Demographic characteristics
The sample consisted of 71.4 % of male and 28.6% of female respondents. Respondents were mostly between age group of 21-38 years (63.8%). The demographic profile of the respondents is shown in Table 1.
Table 1. Demographic characteristics of the respondents
Variables Frequ
ency
Percent age
Gender Male 85 71.4
Female 34 28.6
Age Less than 21
Years
5 4.2
21 to 26 Years
30 25.2
27 to 32 Years
23 19.3
33-38 Years 23 19.3
39-44 Years 16 13.4
45-50 Years 14 11.8
Over 50
Years 8 6.7
Mall Visit
Less than
once a
month but
more than 4 times a year
53 44.5
At least once
a month 39 32.8
Available online:
http://edupediapublications.org/journals/index.php/IJR/
P a g e | 209once a
month
4.2.Factor Analysis
The test of sample adequacy has to be performed to check whether the collected data is adequate for factor analysis [1]. For analyzing the adequacy, Kaiser-Meyer-Olkin (KMO) test of sampling adequacy and Bartlett‟s test of Sphericity has been conducted. A minimum accepted value of 0.50 or KMO [16] has been considered. The values of the data set are presented below. Based on the values of KMO, the sample adequacy is found to be acceptable (Table 2). The factor structure of achievement orientation is described in Table 3.
Table 2. Summary of KMO and Bartlett's test of Sphericity
Construct KMO Bartlett’s
Achievement orientation 0.843 .000
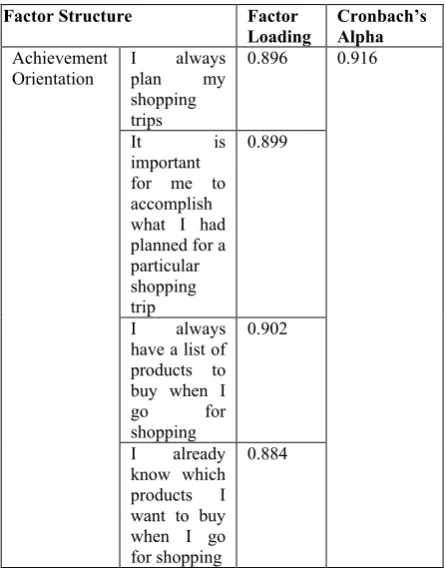
Table 3. The factor structure of the research variable
Factor Structure Factor
Loading
Cronbach’s Alpha Achievement
Orientation I plan always my shopping trips
0.896 0.916
It is
important for me to accomplish what I had planned for a particular shopping trip
0.899
I always
have a list of products to buy when I
go for
shopping
0.902
I already
know which products I want to buy when I go for shopping
0.884
The regression based factor scores for this factor have been used for classifying shoppers.
4.3.Measuring Navigational behaviors
For the first situation (Figure1, Left), 94 preferred to go to left and 25 to the right (out of 119). Participants have shown preference for a particular direction (χ2 = 40.008, df= 1, p<0.0001). For the second situation, (Figure 1,
Right) 60 preferred to go to left, 59 to the right. Here also participants showed no difference in preference (χ2 =
0.008, df= 1, p<0.9270). By conventional criteria, the first difference is considered to be extremely statistically significant and the second difference is not statistically significant.
4.3.1.Relating Navigational behavior and shopper type
The first and second situations (as shown in Figure 1) are exactly the same spatial arrangement but an inclusion of a „visual cue‟ (a sign for McDonalds in this case) in the later. In the first situation, the respondents showed a preference for the left direction. The presence of a navigational cue (signage, in this case) changed the scenario. More people preferred to go to right than the without signage situation, and as a result, there are no significant differences in navigational preferences between left and right. The visual cue or signage acted as an „equalizer‟. The respondents can be classified into four distinct categories depending on their navigational preferences. The categories are different in terms of their response to „with signage‟ and „without signage‟ situations.
1. Category (A): Previous response Left- Later response Left
2. Category (B): Previous response Left- Later response Right
3. Category (C): Previous response Right- Later response Right
4. Category (D): Previous response Right- Later response Left
The regression based factor scores for achievement orientation is compared between the above mentioned four categories to check whether there is any significant difference between the categories in terms of their achievement orientation in following the most visible areas in exploring a shopping mall. Descriptive statistics of the score for different categories are shown in Table 4. To identify whether there is any significant difference between categories, one-way ANOVA has been conducted and the result of the test is summarized in Table 5.
Table 4. Descriptive statistics for k=4 independent treatments
Categories A B C D Pooled
Data
Observatio ns ( N)
50 44 15 10 119
Sum
-28.235 0
-16.081 7
25.072
3 19.2444 -0.0000
Mean
-0.5647 -0.3655
1.6715 1.9244 -0.0000
Sum of
squares
25.161 7
11.322 0
43.879 8
37.636 6
118.000 2
Sample
variance s2 0.1881 0.1266 0.1409 0.0669 1.0000
Sample Std.
Available online:
http://edupediapublications.org/journals/index.php/IJR/
P a g e | 210 Table 5. One-way ANOVA of the 4 independent treatmentsSum of square s (SS)
Degr ees of Free dom (ν)
Mean Square (MS)
F Statistic
P value
Treat ment
110.76 47
3 33.5882 224.1106 1.1102e
-16
Error 17.235
4
115 0.1499
Total 118.00
02
118
The p- value corresponding to the F-statistic of one-way
ANOVA is lower than 0.05 (Table 5), suggesting that the one or more treatments are significantly different.
4.3.2.Tukey HSD Test
The p-value corresponding to the F- statistic of one-way ANOVA is lower than 0.01 which strongly suggests that one or more pairs of treatments are significantly different. There are four treatments, so, Tukey HSD test has been applied (Table 6) to each of the six pairs to pinpoint which of them exhibits statistically significant difference. The critical value of the Tukey-Kramer HSDQ statistic based on four treatments and ν=115 degrees of freedom for the error term, for significance level α=0.01 and 0.05 in the Studentized Range distribution. The Tukey- Kramer confidence limits are taken from the NIST Engineering Statistics Handbook and simplifying algebraic transformation is made. These critical values for Q, for α of 0.01 and 0.05 can be obtained as
and
respectively.
Table 6. Tukey HSD test results Treatments
pair
Tukey
HSD Q
Statistic
Tukey HSD p-value
Tukey HSD
inference
A vs B 3.5205 0.0670407 Insignificant
A vs C 27.7482 0.0010053 ** p< 0.01
A vs D 26.2489 0.0010053 ** p< 0.01
B vs C 24.8877 0.0010053 ** p< 0.01
B vs D 23.8784 0.0010053 ** p< 0.01
C vs D 2.2635 0.3834236 Insignificant
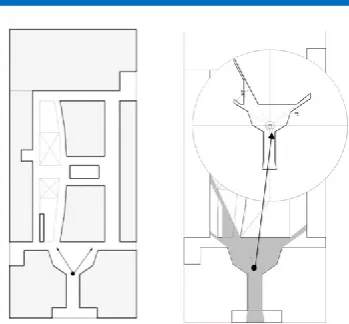
4.4.Visibility Analysis
Figure 2. (Left) Layout of the shopping mall junction shown to the respondents. The dot denotes the location of the observer and (Right) the isovist from the vantage point The plan diagram of the hypothetical mall junction is shown in Figure 2 highlighting the location of the observer with a dot and the directional choices through arrows. Isovist analysis from the vantage point is done using Syntax 2D software tool. The analysis clearly indicates that the left side enjoys more visibility that the right which attracts more movement than without signage situation.
5.
Conclusion
From the visibility analysis and the navigational behavior of categories indicates that the low achievement orientation people explore a space based on visibility (L-R, L-L; initial response Left) and vice versa. While the signage acts as an attractor across different achievement orientations. Low achievement orientation means mall goers with low planned purchase intentions. Visibility therefore is significant for attracting impulse purchasers or explorers. Visibility analysis can be used as a significant tool for positioning of stores in a mall. The stores relying more on impulse purchase or the facilities requiring explorers should be located on the high visible paths in a shopping mall.
6.
References
[1] Anderson, T. M. ,& Herbertson, T. T., Measuring Globalization, IZA Discussion Paper (817), 2003. Available from: http://ssrn.com/abstract=434540
[2] Batty, M., Jiang, B., & Thurstain-Goodwin, M., “Local movement: agent-based models of pedestrian flows”, (CASA Working Papers 4). Centre for Advanced Spatial Analysis (UCL): London, UK, 1998
[3] Benedikt, M. L., “To take hold of space: isovists and isovist fields”, Environment and Planning B: Planning and design,
6, 1,, 1979, pp. 47-65.
Available online:
http://edupediapublications.org/journals/index.php/IJR/
P a g e | 211 [5] Bush, A. J., & Hair, J. F. Jr., “An assessment of the mallintercept as a data collection method”, Journal of Marketing Research, 22, 2,1985, pp.158-167.
[6] Carter, C. C., & Vandell, K. D. “Store location in shopping centers: theory and estimates”, Journal of Real Estate Research, 27, 3, 2005, pp.237-266.
[7] Churchill, G. A. & Brown, T. J., Basic Marketing Research, The Dryden Press, 2006
[8] Dalton, R. C., “The Secret Is To Follow Your Nose Route Path Selection and Angularity”, Environment and Behavior, 35, 1, 2003, pp.107-131.
[9] Dawson, S., Bloch, P. & Ridgway, N., “Shopping motives, emotional states, and retail outcomes”, Journal of Retailing, 66, 4, 1990, pp. 408-427.
[10]Desyllas, J., & Duxbury, E.,“Axial maps and visibility analysis: a comparison of their methodology and use in models of urban pedestrian movement”, In Proceedings 3rd International Space Syntax Symposium, Atlanta, GA,2001 [11]Frankl, P., Principles of Architectural History. Cambridge,
MA: MIT Press, 1973
[12]Franz, G., & Wiener, J. M., “From space syntax to space semantics: a behaviorally and perceptually oriented methodology for the efficient description of the geometry and topology of environments”, Environment and Planning B: Planning and Design, 35, 4, 2008, pp.574-592.
[13]George, D., & Mallery, P., SPSS for windows step by step: A simple guide and reference 14.0 update (7th ed.). Boston, MA: Allyn and Bacon, 2007
[14]Gibson, J. J., The Ecological Approach to Visual Perception: Lawrence Erlbaum Associates Inc, US, 1979 [15]Hölscher, C., Meilinger, T., Vrachliotis, G., Brösamle, M.,
& Knauff, M.,“Up the down staircase: Wayfinding strategies in multi-level buildings”, Journal of Environmental Psychology, 26,4, 2006, pp. 284-299. [16]Kaiser, F. G. (1974). “An index of factoral simplicity”,
Psychometrika, 39, 1, 1974, pp. 31–36.
[17]Lewin, K., Field theory in social science. New York, Harper and Row, 1951
[18]Montello, D. R., “The contribution of space syntax to a comprehensive theory of environmental psychology”, In Proceedings of the 6th International Space Syntax Symposium, Istanbul, 2007.Retrieved from http://www.
spacesyntaxistanbul. itu. edu.
tr/papers/invitedpapers/daniel_montello. pdf.
[19]O'Neill, M. J.”Effects of signage and floor plan configuration on wayfinding accuracy”, Environment and Behavior, 23, 5, 1991, pp.553-574.
[20]Passini, R. (1984). “Spatial representations, a wayfinding perspective”., Journal of environmental psychology, 4, 2, 1984, pp.153-164.
[21]Peponis, J., Zimring, C., & Choi, Y. K. , “Finding the building in wayfinding”, Environment and behavior, 22, 5,1990, pp.555-590.
[22]Rice, R., & Hancock, L.“The mall intercept: A social norms marketing research tool”, The Report on Social Norms, 4, 7,2005, pp. 4-7.
[23]Titus, P. A., & Everett, P. B., “The consumer retail search process: a conceptual model and research agenda”, Journal of the Academy of Marketing Science, 23, 2, 1995, pp.106-119.
[24]Turner, A., & Penn, A., “Making isovists syntactic: isovist integration analysis”. In 2nd International Symposium on Space Syntax, Brasilia, 1999.
[25]Turner, A., Doxa, M., O'sullivan, D., & Penn, A., “From isovists to visibility graphs: a methodology for the analysis of architectural space”, Environment and Planning B, 28, 1,2001, pp.103-121.
[26]Vandell, K. D., & Lane, J. S., “The economics of architecture and urban design: some preliminary findings”,
Real Estate Economics, 17, 2, 1989, pp. 235-260.
[27]Wiener, J. M., Franz, G., Rossmanith, N., Reichelt, A., Mallot, H. A., &Bulthoff, H. H., “Isovist analysis captures properties of space relevant for locomotion and experience”,