Scholarship@Western
Scholarship@Western
Electronic Thesis and Dissertation Repository
12-15-2017 2:00 PM
A performance based design approach for tall buildings under
A performance based design approach for tall buildings under
wind loading
wind loading
Fouad Y. Elezaby
The University of Western Ontario Supervisor
El Damatty, A.
The University of Western Ontario
Graduate Program in Civil and Environmental Engineering
A thesis submitted in partial fulfillment of the requirements for the degree in Master of Science © Fouad Y. Elezaby 2017
Follow this and additional works at: https://ir.lib.uwo.ca/etd
Part of the Structural Engineering Commons
Recommended Citation Recommended Citation
Elezaby, Fouad Y., "A performance based design approach for tall buildings under wind loading" (2017). Electronic Thesis and Dissertation Repository. 5101.
https://ir.lib.uwo.ca/etd/5101
This Dissertation/Thesis is brought to you for free and open access by Scholarship@Western. It has been accepted for inclusion in Electronic Thesis and Dissertation Repository by an authorized administrator of
ii
ABSTRACT
iii
building are evaluated and decomposed into mean, background and fluctuating components. A reduction factor is applied to the fluctuating components and a modified time history response of the straining actions is calculated. The building components are redesigned under this set of reduced straining actions and its fundamental period is then evaluated. A new set of loads is calculated based on the modified period and is compared to the set of loads associated with the original structure.
This is followed by non-linear static pushover analysis conducted individually on each shear wall module after redesigning these walls. Displacement-controlled pushover analysis is carried out to assess the ductility demand of shear walls with reduced cross sections to justify the application of the load reduction factor “R”. Furthermore, a parametric study is conduced to evaluate the effect of ductility level on target performance level reached in each shear wall.
Keywords
iv
To my parents
Yehia Elezaby
and
Suzan Elezaby
To my brothers
Kamal
and
Ibrahim
and my sister
Sarah
For their support, caring, encouragement and sharing these years of hard work
To my supervisor,
Dr. Ashraf A. El Damatty
v
ACKNOWLEDGEMENTS
First of all, I would like to thank Allah (the almighty) for all his blessings and mercy, and give us all the support and inspiration to complete this work. If it weren’t for Allah’s presence, I wouldn’t have had the patience and persistence to reach this milestone in my life.
With boundless love and appreciation, I would like to express with these simple yet sincere word my thanks and gratitude to all those who helped me through the past years, to bring this study into reality which would have never been possible without their help.
I would like to thank my supervisor Dr. Ashraf A. El Damatty for his continuous help and support throughout my masters. I really owe him all the knowledge and skills he has provided me with. I am grateful for all the encouragement and the long hours he has spent with me to provide me with his valuable experience and learning new approaches on how to deal with complicated research problems.
I would like to acknowledge the collaboration of Dar Group Consultants – Shair and Partners for providing us with the structural drawings for our case study. I would also like to thank the Boundary Layer Wind Tunnel (BLWT) facility at Western University for providing us with the wind tunnel data and guidance on post-processing of these data.
vi
and support. To my beloved family, I owe you everything I have achieved so far, and I wish I could always make you proud.
vii
TABLE OF CONTENTS
ABSTRACT ... ii
ACKNOWLEDGEMENTS ... v
LIST OF TABLES ... ix
LIST OF FIGURES ... x
CHAPTER 1 ... 1
INTRODUCTION ... 1
1.1 General ... 1
1.2 Literature ... 4
1.3 Research Gaps ... 7
1.4 Thesis Objectives ... 8
1.5 Thesis Organization... 8
1.5.1 Preliminary Investigation to Assess the Application of Ductility – Based Approach for High-Rise Buildings subjected to extreme Wind Loads. ... 9
1.5.2 Non-linear Static Analysis for Ductility- Based Designed Reinforced Concrete Shear Walls Subjected to Extreme Wind Loads. ... 9
CHAPTER 2 ... 11
PRELIMENARY INVESTATION TO ASSESS THE APPLICATION OF DUCTLITY- BASED APPROACH FOR HIGH-RISE BUILDINGS SUBJECTED TO EXTREME WIND LOADS ... 11
2.1 Introduction ... 11
2.2 Flowchart for the proposed Performance - Based Design framework ... 12
2.3 Step I: Wind tunnel testing ... 14
2.3.1 Building description ... 14
2.3.2 Wind data at building location... 16
2.3.3 Wind tunnel pressure test model ... 18
2.3.4 Evaluation of wind forces evaluation from wind tunnel data ... 19
2.4 Step II: Finite Element Analysis ... 21
2.5 Step III: Evaluate response total, Mean+Background and resonant component (VT(t), VMean+BG, VR) ... 25
2.5.1 Dynamic Time History Analysis ... 25
2.5.2 Step IV: Decomposition of Wind Response into Mean, Background and Resonant component ... 26
viii
2.6.1 Reducing Wind Resonant Component by “R” factor ... 32
2.6.2 Redesign of the concrete shear walls under the new set of loads ... 34
2.7 Effect of reducing wind resonant component on Structure Dynamic characteristics. ... 36
2.7.1 Modal analysis results of structure with reduced cross sections: ... 36
2.7.2 Dynamic time history analysis of the structure with reduced cross sections: ... 37
2.8 Parametric study on changing “R” factor and its effect on structure dynamic characteristics ... 39
CHAPTER 3 ... 40
NON-LINEAR STATIC ANALYSIS FOR REDUCED REINFORCED CONCRETE SHEAR WALLS SUBJECTED TO EXTREME WIND LOADS ... 40
3.1 Introduction ... 40
3.2 Methodology: ... 42
3.2.1 Reduced shear wall cross sections based on ductility design: ... 42
3.2.2 2-D modelling of shear walls and static pushover analysis ... 43
3.3 Results and discussion: ... 50
3.3.1 Module #1: I-Section Pushover analysis results: ... 52
3.3.2 Module #2: Vertical Wall 4200 mm long Module Pushover analysis results: ... 54
3.3.3 Module #3: L-Section Module Pushover analysis results: ... 56
3.3.4 Module #4: Inclined Wall Module Pushover analysis results: ... 58
3.4 Effect ductility of Shear walls on Non-linear behaviour and Performance Criteria: ... 60
3.4.1 I-Section Moment Rotation curve and Acceptance Criteria with Moderate Ductility 61 3.4.2 I-Section Moment Rotation curve and Acceptance Criteria with Limited Ductility .. 63
3.4.3 Vertical wall 4200 mm Moment-Rotation curve and Acceptance Criteria with Limited Ductility ... 64
CHAPTER 4 ... 65
SUMMARY AND CONCLUSIONS ... 65
4.1 Summary ... 65
4.2 Conclusions: ... 66
4.3 Recommendations for future work:... 69
REFERENCES ... 70
APPENDICIES ... 74
ix
LIST OF TABLES
Table 2- 1: Modal Analysis Results with original cross sections ... 23
Table 2- 2: Summary of reduction procedure on shear walls’ straining actions ... 35
Table 2- 3: Modal analysis results before and after reduction ... 36
Table 2- 4: Base Shear values before and after reduction ... 38
Table 3- 1: Modelling Parameters and Numerical Acceptance Criteria for Nonlinear Procedures - Reinforced Concrete Shear Walls. (ASCE/SEI 31 41)………45
Table 3- 2: Damage Control and Building Performance Levels ... 46
Table 3- 3: Ductility demand values for different shear wall modules ... 60
x
LIST OF FIGURES
Fig. 2- 1: Proposed framework for Performance-based design ... 13
Fig. 2- 2: Layout for the project site (Source: Wikipedia: https://en.wikipedia.org/wiki/Abraj_Al_Bait) ... 14
Fig. 2- 3: Elevation and plan views for the layout (Boundary Layer Wind Tunnel report, 2008) 15 Fig. 2- 4: Hourly- Mean wind speeds with different return periods (Boundary Layer Wind Tunnel report, 2008) ... 16
Fig. 2- 5: Hourly- Mean wind speeds with different return periods (Boundary Layer Wind Tunnel report, 2008) ... 17
Fig. 2- 6: Pressure test model tested at the BLWT (Boundary Layer Wind Tunnel report, 2008) ... 19
Fig. 2- 7: Story forces for stories 1-7 ... 21
Fig. 2- 8: Plan view of the typical story of the building ... 22
Fig. 2- 9: The first three mode shapes of the building... 24
Fig. 2- 10: Total Base Shear VT-X (t) ... 25
Fig. 2- 11: Total Base Shear VT-Y (t) ... 26
Fig. 2- 12: Spectral density function for base shear Vx-T ... 28
Fig. 2- 13: Base shear values versus different loading time steps ... 29
Fig. 2- 14: Mean + Background Base Shear VQ-X (t) ... 30
Fig. 2- 15: Mean + Background base shear VQ-Y (t) ... 30
Fig. 2- 16: Resonant Base Shear VR-X (t) ... 31
Fig. 2- 17: Resonant Base Shear VR-Y (t) ... 31
Fig. 2- 18: Reduced resonant base Shear VR-X (t)/R ... 32
Fig. 2- 19: Reduced resonant base shear VR-Y (t)/R ... 32
Fig. 2- 20: New design base shear (VT-I-X (t)) ... 33
Fig. 2- 21: New design base shear (VT-I-Y (t)) ... 33
Fig. 2- 22: Building plan layout ... 34
Fig. 2- 23: Total Base Shear VT-X (t) after redesign ... 37
Fig. 2- 24: Total Base Shear VT-Y (t) after redesign ... 37
xi
Fig. 2- 26: Base Shear values with different reduction factors ... 39
Fig. 3- 1: Flowchart for nonlinear analysis of reduced shear walls………...41
Fig. 3- 2: Base Shear Time History for I-section wall from linear analysis ... 42
Fig. 3- 3: Base Shear Time History for Vertical wall (4200 mm) from linear analysis ... 42
Fig. 3- 4: Typical backbone curve for reinforced concrete cross section. (FEMA 356) ... 43
Fig. 3- 5: Shear Force Diagram for Vertical Wall 4200 mm long. ... 47
Fig. 3- 6: Shear Force Diagram for I-section wall... 47
Fig. 3- 7: Shear Force Diagram for L-section wall ... 48
Fig. 3- 8: Shear Force Diagram for inclined section wall ... 48
Fig. 3- 9: Idealized Load – Displacement relationship and ductility demand (µ) (Chopra and Goel, 1999) ... 50
Fig. 3- 10: Structural Layout showing governing shear walls in Lateral Load Resisting System (ETABS FE Model) ... 51
Fig. 3- 11: Pushover Load – Displacement Curve for I-Section shear Wall ... 52
Fig. 3- 12: Moment – Rotation Curve for I-Section shear wall ... 53
Fig. 3- 13: Pushover Load – Displacement Curve for vertical section shear Wall ... 54
Fig. 3- 14: Moment – Rotation Curve for vertical section shear wall ... 55
Fig. 3- 15: Pushover Load – Displacement Curve for L-section shear Wall ... 56
Fig. 3- 16: Moment – Rotation Curve for L- section shear wall ... 57
Fig. 3- 17: Pushover Load – Displacement Curve for Inclined shear Wall ... 58
Fig. 3- 18: Moment – Rotation Curve for Inclined shear wall ... 59
Fig. 3- 19: Moment – Rotation Curve for I-Section shear wall with moderate ductility ... 61
Fig. 3- 20: Moment – Rotation Curve for Vertical shear wall 4200 mm with moderate ductility 62 Fig. 3- 21: Moment – Rotation Curve for I-shear wall 4200 mm with limited ductility... 63
CHAPTER 1
INTRODUCTION
1.1
General
Buildings subjected to wind forces are designed using elastic analysis and equivalent static lateral loads prescribed in building codes. Recent trends and modern architectural requirements have pushed towards developing increasingly taller and irregularly- shaped complex buildings, leading to structures that are potentially more susceptible to wind excitations. As buildings become taller and more slender, they become more vulnerable to wind excitations than to earthquake effects. However, significant benefits can be obtained with the adoption of a performance-based technique, where member inelastic behavior and dynamic effects of the natural hazard are explicitly considered. Such strategies have been successfully adopted in seismic engineering.
Performance-based design is an attempt to design buildings with predictable loading-induced performance, rather than being based on empirical code specifications. The earthquakes and extreme winds are the two major loading conditions experienced through the lifetime of buildings. While the performance-based seismic design (PBSD) is becoming well known in professional practice for the design of buildings under seismic loading, the wind-induced performance-based design (WPBD) is also emerging as a promising design methodology to improve the current practice in the tall building design against wind.
wind analysis is still undeveloped. One motivation for a nonlinear wind analysis is that prescribed code method in wind design may be overly conservative. Member stresses are limited to the linear elastic range for strength-level events. Another motivation for a nonlinear analysis is to determine collapse capacity of buildings. An additional motivation that triggered the investigation of this subject is the fact that there has been a trend recently in current codes to increase the return period employed in design wind speed approaching the large return period used in seismic design. Furthermore, architetecutral requirements are becoming more complicated, which can encourage structural design to aim at reducing structural members cross sections.
Performance-based design (PBD) is rapidly becoming the benchmark approach for the design of structures to resist lateral loads. In the design of building systems against earthquakes, the principles of PBD have been widely adopted as a means for achieving earthquake resilient designs. Many of the prescriptions contained in international building codes and standards that govern seismic design can be linked back to the principles of PBD (e.g. Eurocode 8 and the ASCE 7-10) and also capacity design procedures as defined by NBCC 2010 . As an approach, PBD focuses on the definition of a set of performance objectives that must be satisfied by the building system under investigation.
wind pressure depend primarily on the shape of the building and the terrain exposure. Wind loads also depend on the type of windstorm (e.g. hurricane, extra-tropical cyclone, downburst, and tornado). This differs from seismic load characteristics, which depend largely on the mass of the building and the tectonic environment, fault mechanism, and epicenteral distance.
When existing buildings are subject to alterations in later design stages such as a change in the cladding system, owners may need to evaluate the adequacy of the lateral load resisting system. For designs governed by wind loads, the standard approach is to evaluate building performance under current codes. This involves an elastic analysis of the building subjected to code-prescribed or wind tunnel equivalent static wind loads, followed by an evaluation of the building behavior at service and strength limit states. For structural members not satisfying code limits, rehabilitation measures are prescribed. An alternate approach is to consider a performance-based evaluation, similar to the current state of the art in building designs governed by seismic loads (ASCE 2003; ASCE 2007).
The merits of a performance-based approach include a more accurate analysis of building response with explicit consideration of nonlinear behavior. In traditional building design procedures, cracking factors are used to represent nonlinear behavior, which is less accurate. Furthermore, a performance-based approach allows for an explicit evaluation of the building’s performance at a particular hazard level, which is generally not assessed as part of the traditional prescribed code method.
design professionals ensure the satisfaction of prescriptive criteria which, even though established based on a certain level of expected performance, do not guarantee the correct evaluation and understanding of the actual reliability achieved (Ellingwood 2001, FEMA 2012a).
In the case of PBD, on the other hand, the performance of the structure is directly linked to the probability of experiencing different types of losses, which can result from natural or man-made hazards over the entire lifetime of the structure.
1.2
Literature
To date, there has been several proposed frameworks for performance-based wind design according to Van de Lindt (2009), Ciampoli et al. (2011), Griffis (2013a) and Griffis et al (2013b). Bakhshi and Nikhbakht (2011) performed nonlinear analyses of 20 to 40- story steel frame buildings in a parametric study comparing earthquake and wind loads, at strength-level hazard intensity. Muthukumar et al. (2012) performed a nonlinear dynamic analysis of an existing 22-story reinforced-concrete shear wall building up to strength-level wind intensities, but did not attempt to evaluate collapse.
Gani and Legeron (2012) predicted the nonlinear response of single-degree-of-freedom (SDOF) models using a spectral stochastic method, exhibiting simple behavior (elastic, perfectly-plastic, and bilinear with strain hardening). However, this approach required use of an equivalent elastic system.
They proposed a performance-based design defining different performance objectives associated with multiple levels of wind hazards. In this study, nonlinear static pushover analysis was conducted to evaluate inelastic drifts resulting from wind events with very high return periods. The augmented optimality criteria method was used to formulate and solve the optimal performance-based design problem considering inelastic deformation. The proposed framework was applied on a practical 40-story residential building.
Muthukumar et al. (2013) presented an evaluation of the Main Wind Force Resisting System (MWFRS) of an existing building, whose façade was proposed to be replaced with a new curtain wall system. The building did not meet the strength limit state prescribed under current codes. Therefore, a performance-based evaluation approach was utilized as per the framework outlined in Griffis et al. (2012). Structural testing, non-destructive evaluations and visual assessments were conducted to determine the condition of the existing structure and develop as-built data for the performance-based evaluation. Inelastic behavior of the shear walls was explicitly modeled. Wind loads were obtained from wind tunnel testing performed at Rowan, Williams, Davies, and Irwin, Inc. (RWDI). Building target performance levels were established at both the service and strength limit states. Nonlinear analyses were then conducted to evaluate building performance at the identified target levels.
an economic design. For the specific building studied, ductility demand was effective in increasing the collapse safety and reducing risk of collapse. It was concluded that by providing a limited level of ductility for the moment frame system, it was justified to use a load reduction factor of R = 1.25. Spence and Kareem (2014) developed a framework for the probabilistic performance-based assessment of large-scale uncertain linear systems driven by experimentally stochastic wind loads. The study was done on a 45 story steel building with an offset core. The members under study were box section columns. Several other probabilistic performance-based design approaches were proposed by Paulotto et al. (2004), Bashor and Kareem (2007), Augusti and Ciampoli (2008), and Ciampoli et al. (2011).
Spence et al. (2015) presented a first attempt to define an appropriate framework to allow the principles of performance-based design to be employed during the design of building systems to resist severe wind events. Focus was placed on highlighting the necessary steps to reach such a goal, which include the definition of site-specific wind hazard models, of suitable fragility functions as well as of consequence functions that rationally assess damage and losses.
1.3
Research Gaps
The previously mentioned studies focused on proposing probabilistic approaches for performance-based wind engineering. Inherent ductility in concrete members has not been explicitly considered before in a defined framework. Wind design has not yet benefited from such property of reinforced concrete, as it is the case in seismic design. Current codes only use equivalent static wind loads, which can be overly conservative. Furthermore, there has been a trend recently in current codes to increase the design wind event return period, but on the other hand, it should be guaranteed that members possess enough ductility to experience inelastic actions without major loss in strength. As such, it is important to define a framework for a performance-based technique, and define target performance levels as limits define in ASCE/SEI 41-13 to be used as a guide in assessment.
1.4
Thesis Objectives
The main objectives of this thesis are summarized as follows:
1- Develop a framework for performance-based design for buildings subjected to extreme wind loads.
2- Investigate the applicability of ductility-based approach adopted in building codes for seismic design (NBCC 2010) on wind design.
3- Assess the inelastic behaviour of concrete shear walls under wind loads.
1.5
Thesis Organization
1.5.1 Preliminary Investigation to Assess the Application of Ductility – Based Approach for High-Rise Buildings subjected to extreme Wind Loads.
In this chapter, a 3D finite element model is constructed for a 65 storey building using ETABS software. The building main lateral load resisting system is concrete shear walls. Wind loads are taken from wind tunnel pressure test results. Testing was conducted at the Boundary Layer wind Tunnel (BLWT) facility at the University of Western Ontario. Dynamic time history analysis is conducted to calculate full dynamic responses of the building (base shear, base moments, and displacements). This is followed by Quasi-static analysis to calculate the Mean and Background responses. Furthermore, wind response is decomposed into Mean, Background and Resonant component. Load reduction factor “R” similar to that applied in seismic design is applied on wind resonant component, and accordingly, concrete shear walls are redesigned. Building dynamic characteristics are compared before and after reduction of shear walls. The same procedure is implemented using different reduction factors.
1.5.2 Non-linear Static Analysis for Ductility- Based Designed Reinforced Concrete Shear Walls Subjected to Extreme Wind Loads.
CHAPTER 2
PRELIMENARY INVESTATION TO ASSESS THE APPLICATION OF
DUCTLITY- BASED APPROACH FOR HIGH-RISE BUILDINGS
SUBJECTED TO EXTREME WIND LOADS
2.1 Introduction
Buildings subjected to wind loads are traditionally designed considering only the elastic range of members and using equivalent static loads and prescribed code methods. It has not been considered before to take inherent ductility in structural members into consideration. Therefore, the implementation of a performance-based design for structures under wind loads would be beneficial, where inelastic behavior of members are considered.
3) Reducing wind resonant component by “R” factor. 4) Comparing the dynamic characteristic and modes shapes of the structure before and after cross section reduction.
2.2 Flowchart for the proposed Performance - Based Design framework
In this section, a proposed framework for performance – based design for high-rise buildings subjected to wind forces is presented. First, wind tunnel data is taken and processed to evaluate story forces that are applied on a 3D finite element model. Time history dynamic analysis is conducted to evaluate total response of the building (base shear VT(t), base moment MT(t) and
displacements ΔT(t)). Second, the response fluctuating part is decomposed into background and
Dynamic time history analysis – Evaluate
VT(t)
Quasi-static analysis – Evaluate
Vmean + VBG(t)
Evaluate VR = VT(t) – [Vmean +
VBG(t)]
Reduced Wind resonant component
Redesign shear wall on reduced load
Base shear (VT-II)
Fundamental period and mode shapes Step I:
Conduct wind tunnel pressure test - Evaluate Cp(t), Fx(t) & FY(t)
Step II:
Develop 3-D Finite element model - Evaluate natural frequencies and mode shapes
Step III:
Evaluate Total, Mean, Background and resonant component (VT(t), Vmean
,VBG(t), VR(t))
Step IV:
Ductiility design approach- VT-I(t) = Vmean+ VB(t) + VR(t)/R
Step V:
Check the dynamic characteristics of the building with the new design
Step VI:
Check if the structure possesses enough ductility to justify the reduction of load
- Assess the inelastic actions
2.3 Step I: Wind tunnel testing
2.3.1 Building description
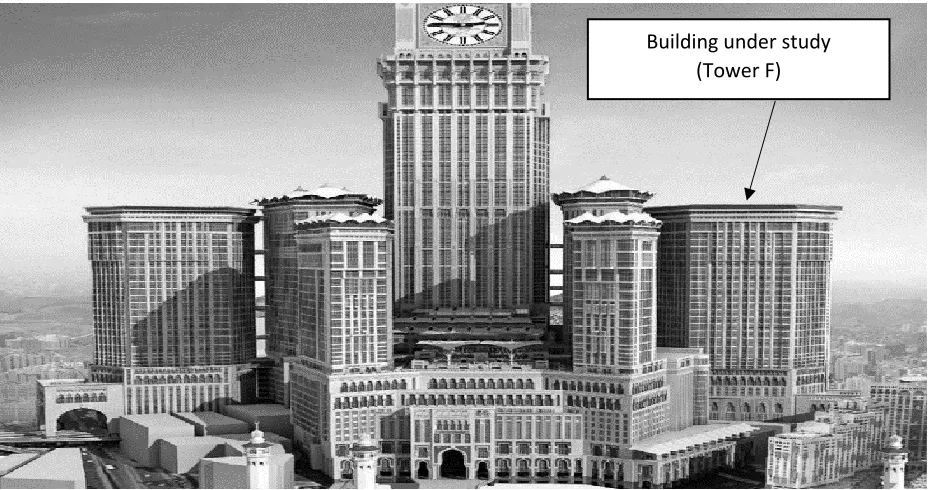
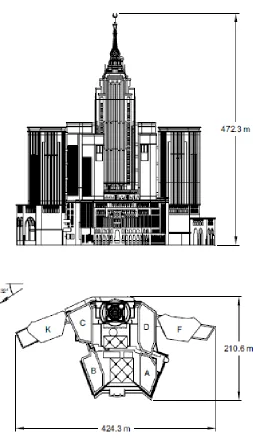
The study is done on a commercial building that consists of 65 stories with a total height of 232 m and overall plan dimensions of approximately 50 m X 70 m. The structure’s main lateral load resisting system is concrete shear walls. The structural system for the typical story is flat slab with spans ranging between 7m and 9m. Fig. 2- 2 shows the layout for the whole site.
The building under study is Tower F as shown in Fig. 2- 3 in the project layout. The building is functioning as a hotel. Initially the building was designed for strength as per building code ACI 318-95, which was as a baseline for comparison of the dynamic characteristics of the structure after applying the reduction procedure on wind resonant component described in this chapter.
Building under study (Tower F)
2.3.2 Wind data at building location
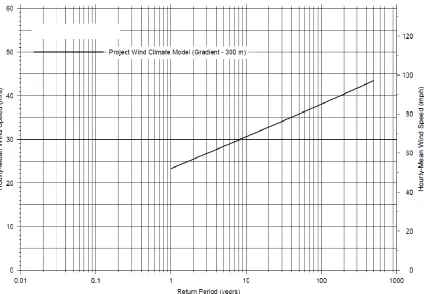
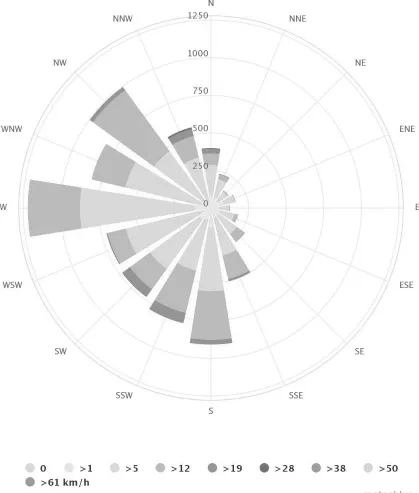
The predicted 50-year and 100-year return period hourly mean wind speeds at gradient level (300 m height) at the location of the building are 35 m/s and 38 m/s respectively as shown in Fig. 2- 4. The most critical wind directions are those coming from West and North-West directions as shown in Fig. 2- 5 in the building location wind rose.
2.3.3 Wind tunnel pressure test model
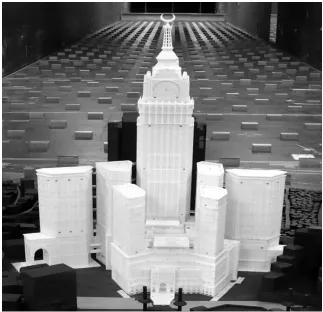
A rigid model was built for the building with a 1:500 scale and a pressure test was conducted in the Boundary Layer Wind Tunnel (BLWT) facility at the University of Western Ontario. Fig. 2- 6
shows the pressure test model built for the building. Local pressure measurements were taken at 10° intervals for the full 360° azimuth range, at 400 samples per second for 26 seconds (equivalent to about 2.5 samples per second for one hour in full scale). Azimuths are measured from true north where 0o is the north, 90o is the east, 180o is the south and 270o is the west direction. Pressure Coefficient values from 114 pressure taps distributed along different elevations of the modelled building were recorded and integrated to evaluate wind story forces according to (Alan Davenport Wind Engineering Group, 2007).
2.3.4 Evaluation of wind forces from wind tunnel data
Time-history pressure coefficient values (Cp) were taken from wind tunnel results to evaluate story
forces resulting from wind loading. Pressure coefficients are referenced to the reference height dynamic pressure which is calculated using this expression qref=1/2.ρ.Vref2according to Mara et
al. (2007), where ρ = air density (1.225 kg/m3) and Vref is the mean-hourly wind speed at reference
height. Thus the pressure coefficients are defined as Cp = Pressure /
q
ref, where the pressurerepresents the pressure at the tap relative to the undisturbed reference static pressure. Tributary areas are calculated for each pressure tap for different elevations of the building, and then areas are resolved in the horizontal-X and vertical-Y directions of the building by angle (ϴ) to account
Fig. 2- 6: Pressure test model tested at the BLWT (Boundary Layer Wind
for the inclination of the building with respect to the true north. The following equations were used to evaluate the wind force at each pressure tap elevation:
Fx = 1/2.ρ.Vref2.Cp. Area Trib. Cos (ϴ)
Where ϴ is the angle between the normal to each face of the building and the positive X-axis and Area Trib. is the tributary area of each pressure tap.
Fy = 1/2.ρ.Vref2.Cp. Area Trib. Cos (Ф)
Where Ф is the angle between the normal to each face of the building and the positive Y-axis. This procedure is done for all Cp values in the time domain to form a time-history for story forces.
2.4
Step II:
Finite Element Analysis
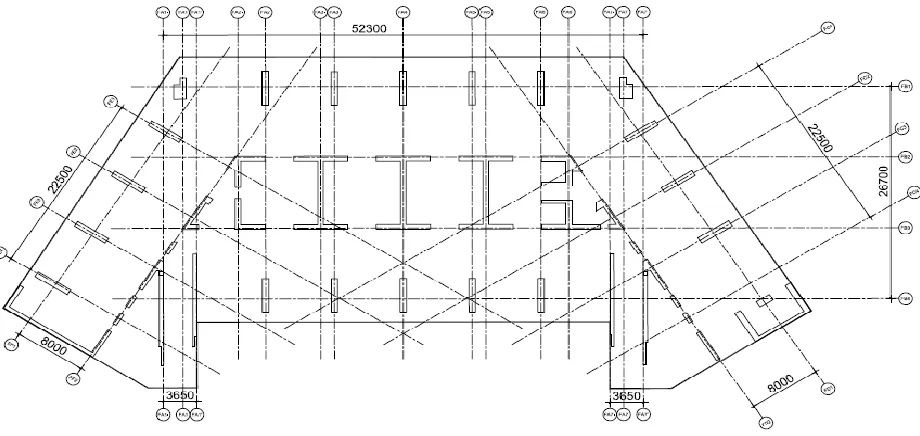
A 3D Finite Element model was developed for the building using ETABS software to evaluate mode shapes and natural periods of the structure, and conduct dynamic time- history analysis. Shear walls were modelled as shell elements in the preliminary stages just for running linear analysis, as computational run time was not an issue in this stage. Floor slabs were modelled as rigid diaphragms according to CSI Analysis Manual (2015). All walls and lateral load resisting system elements were fixed at the foundation level. Mass source was taken as the dead load in addition to the superimposed dead load on the slabs and a portion of the live load that is 25%. Fig. 2- 8 shows plan view of the typical story of the building.
(k
N
)
Time history analysis is conducted to evaluate the dynamic response of the structure to an arbitrary loading. The dynamic equilibrium equation to be solved is given by:
K u (t) +C ů (t) + M ü (t) = r (t)
Where K is the stiffness matrix; C is the damping matrix; M is the diagonal mass matrix; u, ů &, and ü are the displacements, velocities and accelerations, and r is the applied load. ETABS
software is used in this study to solve the dynamic equilibrium equation and evaluate the total
responses of the structure. Damping ratio is taken as 1% of critical damping and the time step Δt is taken as 0.285 sec, which is the original time step of the wind record. Newmark method is used for performing direct-integration time history analysis with γ= 0.5 and β = 0.25.
Table 2- 1 shows modal analysis results in terms periods and mass participation factor, considering the first 20 modes. Mass participation factor represents the amount of the structure mass that contributes to each mode, so a mode with a large mass participation factor is usually a significant contributor to the structure response. Modal analysis results show that the structure’s fundamental period is 10.88 sec., and the first mode is mainly governed by the torsion direction with an 83.5% mass participation ratio. As for the second mode, it is a transitional mode in Y-direction with 88.5% mass participation ratio and the third mode is governed by translation in X-direction with a mass 93.9% participation ratio. Fig. 2- 9 shows the first three mode shapes.
Table 2- 1: Modal Analysis Results with original cross sections
Modal Analysis Results before reducing cross sections
Mode Period UX UY RZ
sec % % %
1 10.882 5.9 10.6 83.5
2 10.376 0 88.5 11.5
3 7.38 93.9 0.9 5.2
4 2.657 2.1 12.7 85.2
5 2.557 3.4 82.7 13.9
6 2.198 94.1 4.6 1.2
7 1.21 43.7 1 55.3
8 1.13 16 63.1 20.9
9 1.045 40.2 35.9 23.9
Mode 1 Mode 2 Mode 3
2.5 Step III: Evaluate response total, Mean+Background and resonant
component (VT(t), VMean+BG, VR)
2.5.1 Dynamic Time History Analysis
The third step in the flowchart involves running linear dynamic time history analysis applying wind forces time-histories on the center of geometry of each story diaphragm to get the structure total response to wind loading (VT (t)). Fig. 2- 10 and Fig. 2- 11 show the time history for base
shear in the X and Y directions.
2.5.2 Step IV: Decomposition of Wind Response into Mean, Background and Resonant component
The second step in the analysis involves decomposition of the wind response. Wind response is divided into a mean part, and a fluctuating part that can be decomposed into background (quasi-static) and the resonant response. The background component refers to the quasi-static response of the fluctuating part of wind response which occurs when wind load frequency is lower than the natural frequency of the structure. On the other hand, the resonant component refers to the additional dynamic amplification of the response according to (Holmes, 2001).
Several approaches can be used to decompose the fluctuating part into Background (quasi-static) and Resonant. For example, most codes simplify this part into the so-called “Gust Response
Factor” and this factor should be multiplied by the quasi-static loads resulting from applying the loads as if the building was rigid as per NBCC (2010). In this study, the methodology presented for separating the resonant component from the background (quasi-static) component is as follows: First, Quasi-static analysis is done applying wind load with an artificial large time step which is 11 sec (≈ 40 times the original time step) to capture the mean + background part of the response VQ(t). Then resonant component VR(t) is evaluated by linear subtraction of VQ(t) from the total
response VT(t).
It can be observed from Fig. 2- 12 that the resonant part represented in the peaks in the response starts to decrease gradually as time step increases. The PSD is plotted for each response resulting from each time step until the peaks in the resonant part eventually diminishes in the last trial, which was the response for Δt = 9 sec. Sensitivity analysis is performed on the peak base shear of each response until the variation between the peak base shear values corresponding to two different time steps converges. Convergence is achieved when using Δt = 11 sec and the difference between the
peak base shear using Δt =11 sec. and Δt= 9 sec. is found to be 1.5 %. Fig. 2- 13 shows the peak base shear values plotted against the time step value.
The final time step Δt used for running quasi-static analysis is 9 sec. This analysis is conducted to capture mean + background components of the response separately. Newmark method is used for performing direct integration time history analysis, with the same parameters used in the case of full dynamic analysis. Damping ratio is taken as 1% of critical damping. The mean + background response is plotted against time. Dynamic amplification factor (DAF) is evaluated by dividing the peak total base shear/ peak quasi-static base shear. DAF is found to be 1.37 for X direction (Vx)
and 1.51 for Y direction (VY). Fig. 2- 14 and Fig. 2- 15 shows the time history for mean +
background base shear in X and Y directions respectively.
Fig. 2- 13: Base shear values versus different loading time steps
0 2000 4000 6000 8000 10000 12000
0 2 4 6 8 10 12
Peak
Bas
e
Fx (KN
)
Time step (Sec.)
Fig. 2- 14: Mean + Background Base Shear VQ-X (t)
Resonant component of the base shear is evaluated by linear subtraction of the mean + background base shear VQ (t) from the total base shear VT (t). Fig. 2- 16 and Fig. 2- 17 show the time histories
of base shear in X and Y directions respectively.
Fig. 2- 16: Resonant Base Shear VR-X (t)
2.6 Step V: Ductility based approach – [VT-I (t)]
2.6.1 Reducing Wind Resonant Component by “R” factor
The next step in the flowchart involves reducing wind resonant component by a factor “R”. A new set of wind loads are applied on the structure and accordingly, redesign of the lateral load structural system under the reduced load is conducted. Fig. 2- 18 and Fig. 2- 19 show plots for time history of reduced resonant component of wind response, which yielded the new straining actions to carry out redesign for shear walls. The “R” factor is given the value of 2 in this study.
Fig. 2- 18: Reduced resonant base Shear VR-X (t)/R
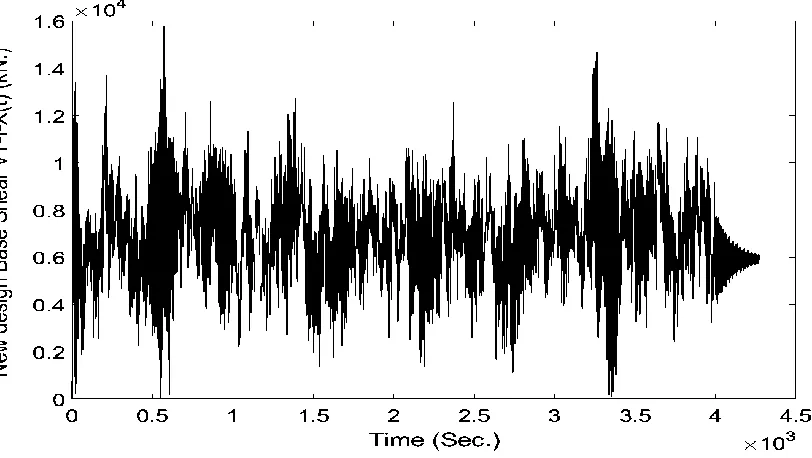
Fig. 2- 20 and Fig. 2- 21 show the new applied base shear which is denoted by VT-I (t) which is the summation of Mean + Background components [VMean+VBG(t)] and the reduced resonant
component [VR(t)/R].
Fig. 2- 20: New design base shear (VT-I-X (t))
2.6.2 Redesign of the concrete shear walls under the new set of loads
The reduction procedure is done on each wall individually in terms of their bending moments. Total base moment on each shear wall is separated into Mean + Background part (MQ) and
Resonant part (MR). The new set of design straining actions are resulting from adding Mean +
background bending moment (MQ) to the reduced resonant bending moment (MR.). Fig. 2- 22
shows the building layout and shear wall modules under study.
Torsion is not considered in this case as torsional effect on shear walls is studied, and it is found that the governing case in design is the bending moment. Check of shear is performed on each shear wall and torsional effects are not the governing case in shear design. Another reason for not
Module # 1: I-Section Module # 2:
Vertical wall
taking torsion into acouunt is that the objective of this study is just the proof of concept; which is the applicability of ductility-based approach on shear walls subjected to wind loads.
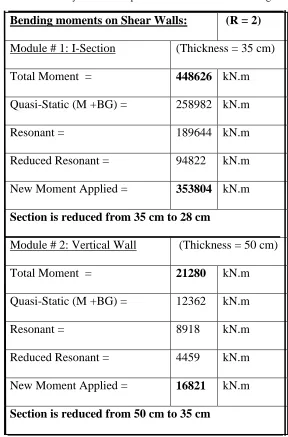
Table 2- 2 shows the summary of reduction procedure and the new design moments on shear wall modules.
Table 2- 2: Summary of reduction procedure on shear walls’ straining actions
Bending moments on Shear Walls: (R = 2)
Module # 1: I-Section (Thickness = 35 cm) Total Moment = 448626 kN.m Quasi-Static (M +BG) = 258982 kN.m Resonant = 189644 kN.m Reduced Resonant = 94822 kN.m New Moment Applied = 353804 kN.m
Section is reduced from 35 cm to 28 cm
Module # 2: Vertical Wall (Thickness = 50 cm) Total Moment = 21280 kN.m Quasi-Static (M +BG) = 12362 kN.m Resonant = 8918 kN.m Reduced Resonant = 4459 kN.m New Moment Applied = 16821 kN.m
Results show that due to reducing wind resonant component by a factor of 2, moments on shear walls were reduced by about 22%, and accordingly there was a saving in concrete volume of affected shear walls by a percentage ranging from 20-25%.
2.7 Effect of reducing wind resonant component on Structure Dynamic
characteristics.
2.7.1 Modal analysis results of structure with reduced cross sections:
The effect of reducing shear wall concrete dimension on global behavior of the structure in terms of fundamental periods and response to wind loading is studied. It is found that as a result of reducing walls’ cross sections, fundamental period of the structure changed from 10.8 sec to 11.5 sec. Table 2- 3 presents a comparison between mode shapes and fundamental periods before and after reduction. The fundamental period of the structure changed from 10.88 sec to 11.5 sec with only 7% increase.
2.7.2 Dynamic time history analysis of the structure with reduced cross sections:
Step III in the flowchart is repeated and full dynamic time history analysis is conducted again on the building with reduced wall cross sections, applying the original time history load. The results show that the peak base shear in the two orthogonal directions did not change much; there is about 4% change only. Fig. 2- 23 and Fig. 2- 24 show the base shear in X and Y directions after reducing shear wall cross sections.
Fig. 2- 23: Total Base Shear VT-X (t) after redesign
Therefore, it can be concluded from the previous comparisons, that reducing wind resonant component and redesigning the lateral load resisting system based on the reduced load did not have a major effect on the structural global behavior in terms of fundamental period and responses.
Table 2- 4 summarizes the comparison between the structure’s dynamic characteristics before and after reduction. Results show that reduction of wind resonant component did not have a major effect on base shear in X and Y directions and dynamic amplification factor.
Table 2- 4: Base Shear values before and after reduction
Structure with
initial cross sections
VT (t)
Reduced applied load –
VT-I (t) =
(VM+VBG+VR/2)
Structure with
reduced cross
sections VT-II (t)
Base Shear VX (kN) 18170 15715 15435
Base Shear VY (kN) 32200 26760 24940
DAF for Vx 1.37 - 1.33
2.8 Parametric study on changing “R” factor and its effect on structure
dynamic characteristics
In this section, a parametric study is presented, trying different reduction factors on wind resonant component. Shear walls are redesigned based on the reduced straining actions in each case. The analysis is done again under the reduced set of loads. The maximum reduction factor employed here is R=3 as it’s not expected that the load reduction factors will be as its counterpart in seismic design where load factors can range between 2.8 and 5.6. The fundamental period of the structure is plotted against different reduction factors as shown in Fig. 2- 25 Base shear is also evaluated in each case and plotted against the reduction factor as shown in Fig. 2- 26.
TABLE4: Modal Analysis results before and after reduction
10.6 10.8 11 11.2 11.4 11.6 11.8 12
0 0.5 1 1.5 2 2.5 3 3.5
Fu n d ame n ta l Period (Se c.)
Reduction Factor "R"
Fig. 2- 25: Fundamental Period values with different reduction factors
-2000 3000 8000 13000 18000 23000 28000 33000
0 0.5 1 1.5 2 2.5 3 3.5
BAs e Sh ear VT -II -Y
Reduction Factor "R"
CHAPTER 3
NON-LINEAR STATIC ANALYSIS FOR REDUCED REINFORCED
CONCRETE SHEAR WALLS SUBJECTED TO EXTREME WIND LOADS
3.1 Introduction
It is concluded from chapter 2 that concrete shear wall modules are designed based on ductility design approach. Wind resonant component of the wind loading is reduced by a factor R=2. Accordingly, concrete shear walls are redesigned. This chapter examines the application of ductility-based approach on concrete shear walls of the building. Non-linearity is defined by assigning plastic hinges at potential locations along the shear wall, and defining moment rotation relationships for hinges as per (ASCE/SEI 41-13). Pushover analysis load patterns are obtained from linear time history dynamic analysis of the full building, applying shear force distribution on each wall individually. Displacement controlled pushover analysis is conducted.
Displacement
- controlled
Assign
plastic hinges
Load Pattern
– Elastic
shear force
Reduced Wall cross
Sections according to
ductility based design
Develop 2-D model for
shear wall and conduct
pushover analysis
Pushover Curves
-Ductility demand.
Moment rotation curves
-Target performance levels
Evaluate the effect of
ductility level on target
performacne level reached
3.2 Methodology:
3.2.1 Reduced shear wall cross sections based on ductility design:
First, Reduced shear wall cross sections (as a result of reducing wind resonant component by R=2) are obtained from the redesign procedure done in chapter 2. The peak bending moment is extracted from linear analysis of the full model of the building. Fig. 3- 2 and Fig. 3- 3 show the time history base shear for I-Section shear wall and vertical wall 4200 mm long.
Fig. 3- 2: Base Shear Time History for I-section wall from linear analysis
3.2.2 2-D modelling of shear walls and static pushover analysis
Second, Pushover analysis conducted in this case is displacement-controlled analysis, where the member is loaded until it reaches a target displacement and strength degradation gradually starts occurring, and eventually the member reaches collapse. Fig. 3- 4 shows the typical force – displacement pushover behavior of a reinforced concrete member.
Zone 1 in the pushover curve that lies between points A and B represents the linear zone. Between points B and C. Zone 2 is the zone where concrete start to spall and strain hardening takes place, which, in well-confined sections, can be associated with strain hardening of the longitudinal reinforcement and an increase in strength from the confinement of concrete. After point C, is the zone where strength loss starts and member fails gradually until reaching collapse, which represents point D on the curve.
The shear walls in this model are modelled using a set of frame elements, with each frame element assigned a concrete cross-section with defined steel reinforcement designed as per (ACI – 318). Boundary conditions are defined assuming that the wall is fixed at its base. Plastic hinge properties are assigned for different frame elements as per moment rotation curve parameters shown in Table 3-1 (as per ASCE/SEI 41-13 – table 10-8, Modelling Parameters and Numerical Acceptance Criteria for Nonlinear Procedures - Reinforced Concrete Shear Walls). Defining concrete section properties, reinforcing steel, and shear reinforcement also, the modelling parameters and acceptance criteria are defined and the moment rotation backbone curves are plotted for the concrete cross-section depending on two parameters, the first one is 𝑃
𝐴𝑔 f′c where P is the axial
force, Ag is the gross area of the cross section and f’c is concrete compressive strength. The other
parameter is 𝐴𝑣
𝑏𝑤.𝑆 which represents the shear reinforcement of the section; where Av is the shear
reinforcement, bw is the shear depth and s is the spacing of stirrups.
The backbone curve, as shown in Fig. 3- 4, consists of five segments. The first segment represents the linear zone until reaching yield (Vy), no deformation occurs in the hinge up to point B. Point
C represents the ultimate capacity of the section for pushover analysis. Point D represents residual strength and point E represents total failure.
Modelling parameters and acceptance criteria are defined depending on the level of axial force P, the shear reinforcement Av ,the shear width bw and spacing of stirrups s. The parameter a which is
procedures as per (ASCE/SEI 41-13). The tabulated values are given for condition i sections (as per ASCE/SEI 41-13) for sections governed by flexural failure, which is the case for most shear walls. Rows are sorted in Table 3- 1from ductile to moderate to limited ductile as we go from top row to the bottom row.
Table 3- 1: Modelling Parameters and Numerical Acceptance Criteria for Nonlinear Procedures - Reinforced
Concrete Shear Walls. (ASCE/SEI 31-41) 𝑃
𝐴𝑔 f′c
𝐴𝑣 𝑏𝑤. 𝑆
a b c IO
(rad.)
LS
(rad.)
CP
(rad.)
≤ 0.1 ≥ 0.006 0.035 0.060 0.2 0.005 0.045 0.060
≤ 0.1 = 0.002 0.027 0.034 0.2 0.005 0.027 0.034
≤ 0.1 < 0.002 0.010 0.010 0.0 0.003 0.009 0.010 For each rotational degree of freedom (bending) in the frame element, plastic hinges are assigned
using a plastic moment – rotation behaviour. Degrees of freedom that are not specified remain
elastic. Each plastic hinge is modeled as a discrete point hinge. All plastic hinge deformations
whether displacement or rotation, occur within the point hinge.
Table 3- 2 shows each structural acceptance criteria. ASCE/SEI 41-13 specifies the level of damage accompanied by each structural performance criteria. Immediate occupancy level is specified in the table, and overall damage for this structural performance level is explained. The overall damage life with no permanent drift occurring. Structures substantially retains its original strength and stiffness. Minor damages can occur in non-structural elements as facades, partitions and ceilings.
Table 3- 2: Damage Control and Building Performance Levels
Immediate occupancy (IO)
Life Safety (LS) Collapse Prevention (CP)
No permanent drift – No loss in strength – Minor cracking occurs
in facades.
Some permanent drifts occur – Minor
loss in strength – Building may be beyond economical
repair.
Large permanent drifts – Major loss in strength – Building is
near collapse.
ETABS finite element software is used to do static pushover analysis for shear walls with reduced
cross sections. Reduction was done based on the procedure described in chapter 2. The Linear
model for elastic design was used as the baseline for non-linear analysis done in this part.
Displacement-controlled Static pushover case is defined applying the load pattern as the shear
force diagram resulting from elastic analysis of the section shown in Fig. 3- 5to Fig. 3- 8. The
application of a larger load on the wall with reduced cross-section; i.e.: reduced capacity, it is
expected that the member will experience inelastic actions and a certain level of ductility is
Fig. 3- 6: Shear Force Diagram for Vertical Wall 4200 mm long.
Fig. 3- 5: Shear Force Diagram for I-section
Fig. 3- 8: Shear Force Diagram for inclined section wall
Fig. 3- 7: Shear Force Diagram for L-section
The assumption of equal displacements is often used to assess the plasticity of sections in seismic
design. In this study, the same concept is applied here in the case of wind design. In each pushover
curve, the linear curve is extrapolated to the value of elastic base shear VE, resulting from elastic
design of the section without taking ductility into account. After getting VE, the corresponding
displacement Δdemand is calculated. Then by getting the value of yield displacement (Δyield) and getting the ratio Δdemand/Δyield, ductility demand can be evaluated.
Fig. 3- 9Shows the Idealized load – displacement relationship of a frame structure as per FEMA
356 in terms of base shear plotted versus top displacement. In the same figure, an idealized bilinear
elastic-perfectly plastic representation of this nonlinear behaviour is shown on the graph. A notable
parameter in this figure is ductility demand (µ) which is defined as the ratio of the displacement
corresponding to the elastic base shear Δdemand, and the displacement Δy corresponding to the
3.3 Results and discussion:
Non-linear static analysis is done on the reduced shear wall modules marked in the layout in Fig.
3- 10. Reduction in shear wall thickness is done based on reduction in wind load resonant
component by a factor of R=2, which resulted in reduction in concrete shear wall thicknesses with
a factor ranging between 1.15 to 1.25 applied on different shear wall modules. The four shear wall
modules in the lateral load resisting system are I-shaped shear wall, Vertical wall 4200 mm long,
the inclined shear walls on the two sides of the layout close to the slab edges, and L-shaped shear
walls.
For each shear module, proper detailing is provided as per NBCC 2010 to ensure the section
possesses enough ductility. NBCC 2010 categorized reinforced concrete sections into three
categories based on level of ductility provided which the designer can control through abiding by
certain reinforcement provisions: high, moderate and limited ductility. In this study, shear wall
sections are reinforced to ensure high ductility, which was used as a baseline for comparison with
other ductility levels in terms of assessing inelastic behaviour. Module
# 1
Module # 2
Module #4
Module #3
3.3.1 Module #1: I-Section Pushover analysis results:
First shear wall module that is tested for non-linear static pushover analysis is the I-Section shaped
shear wall. Load pattern applied in the analysis is obtained from the shear force diagram of the
wall resulting from linear analysis of the building. Level of axial load is an important issue when
conducting non-linear analysis. For this shear wall, axial force P is found to be 83743 kN. Fig. 3-
11 shows the pushover curve for this shear wall module.
Load combination used for evaluating the level of axial force is 1.25 Dead Load + 0.5 Live Load
as this is the combination used in wind design as per NBCC 2010.
Adopting the concept of equal displacements, displacement corresponding to the elastic base shear on the pushover curve is divided by the yield displacement and ductility demand µ is found to be 1.17.
Plastic moment M3 is plotted against the plastic hinge rotation as shown in Fig. 3- 12. On the same graph also, the backbone curve of the member is plotted to show the acceptance criteria defined by ASCE/SEI 41-13.
It can be observed from Fig. 3-12 that the maximum plastic rotation experienced by the member
is 0.008 rad. Which is very close to immediate occupancy (IO) limit which is 0.005 rad.
3.3.2 Module #2: Vertical Wall 4200 mm long Module Pushover analysis results:
The Second Shear wall module in which static pushover curve is carried out is the Verical wall
4200 mm long. Value of axial load P from the full model was 49860 kN. Assuming equal
displacements theory, the value of displacements corresponding to elastic base shear Ve divided
by the yield displacements gives the ductility demand of the section which is found to be 1.3. Fig.
3- 13shows the pushover curve for this shear wall module.
Adopting the concept of equal displacements, displacement corresponding to the elastic base shear on the pushover curve is divided by the yield displacement and ductility demand µ is found to be 1.3.
Plastic moment M3 is plotted against the plastic hinge rotation as shown in Fig. 3- 14 . On the same graph also, the backbone curve of the member is plotted to show the acceptance criteria defined by ASCE/SEI 41-13.
It can be observed from Fig. 3- 14that the maximum plastic rotation experienced by the member
is 0.004 rad. Which is very close to immediate occupancy (IO) limit which is 0.005 rad.
3.3.3 Module #3: L-Section Module Pushover analysis results:
The third module of shear walls that is evaluated under static pushover analysis is the L-section
shaped shear wall. Axial load P applied on this section is 51225 kN. Assuming equal
displacements, ductility demand is calculated by dividing Δdemand / Δyield. This value is found to be 1.25. Fig. 3- 15shows the pushover curve for this shear wall module.
Plastic moment M3 is plotted against the plastic hinge rotation as shown in Fig. 3- 16. On the same graph also, the backbone curve of the member is plotted to show the acceptance criteria defined by ASCE/SEI 41-13.
It can be observed from Fig. 3- 16that the maximum plastic rotation experienced by the member
is 0.0053 rad, which is very close to immediate occupancy (IO) limit which is 0.005 rad.
3.3.4 Module #4: Inclined Wall Module Pushover analysis results:
The fourth module of shear walls that is evaluated under static pushover analysis is the L-section
shaped shear wall. Axial load P applied on this section is 51225 kN. Assuming equal
displacements, ductility demand is calculated by dividing Δdemand / Δyield. This value is found to be 1.2. Fig. 3- 17shows the pushover curve for the inclined shear wall module.
Plastic moment M3 is plotted against the plastic hinge rotation as shown in Fig. 3- 18. On the same graph also, the backbone curve of the member is plotted to show the acceptance criteria defined by ASCE/SEI 41-13.
Table 3- 3 shows a comparison between ductility demand values µ for different shear wall modules.
Table 3- 3: Ductility demand values for different shear wall modules
Table 3- 4 shows a comparison between target performance level reached for each wall cross section.
Table 3- 4: Target performance reached for different shear wall modules
3.4 Effect of ductility of Shear walls on Non-linear behaviour and
Performance Criteria:
In this section, a parametric study is presented, by changing the level of ductility of all reduced shear walls, and monitoring the plastic deformations. Furthermore, inelastic rotations are compared with performance limits defined by ASCE/SEI 41-13 in table 10-8. The Designer always
Shear Wall Module Ductility Demand (µ) I - Section 1.17
Vertical Wall (4200 mm long) 1.3 L – Section 1.25 Inclined shear walls 1.2
Shear Wall Module Ductility Demand (µ) I - Section Between IO and LS Vertical Wall (4200 mm long) Smaller than IO
selects the level of ductility in all reinforced concrete members depending on the desired locations of plastic hinge formation and failure or collapse mechanisms.
In this study, the level of ductility of reinforced concrete shear walls is changed from ductile to moderate ductile. This is achieved by changing the reinforcement details of the shear wall, and abiding by moderate ductility code provisions defined by NBCC 2010.
3.4.1 I-Section Moment Rotation curve and Acceptance Criteria with Moderate Ductility
Pushover analysis is conducted again on the same I-Section but this time given different reinforcement detailing and shear reinforcement ratio, which corresponds to different level of ductility. Fig. 3- 19 shows the moment rotation curve and hinge response in the I-section shear wall in case it’s designed as moderately ductile.
It can be observed from the figure that the section is still between Imeediate Occupancy (IO) (0.005 rad.) and Life Safety (0.027) limits with a maximum plastic rotation of 0.008 rad.
3.4.2 Vertical Wall 4200 mm Moment Rotation curve and Acceptance Criteria
with Moderate Ductility
The vertical wall 4200 mm long is analyzed again providing different detailing and different ductility level (moderate ductility). Hinge response shown in Fig. 3- 20 indicates that the plastic hinge is still before the Immediate occupancy limit (0.005 rad.) with a value of plastic rotation of 0.004 rad.
3.4.2 I-Section Moment Rotation curve and Acceptance Criteria with Limited Ductility
Pushover analysis is conducted again on the same I-Section but this time given different reinforcement detailing and shear reinforcement ratio, which corresponds to different level of ductility (limited ductility). Fig. 3- 21 shows the moment rotation curve and hinge response in the I-section shear wall in case it is designed as limited ductile.
It can be observed from the Fig. 3- 21 that the section is still between Immediate Occupancy (IO) (0.003 rad.) and Life Safety (0.009) limits with a maximum plastic rotation of 0.008 rad.
3.4.3 Vertical wall 4200 mm Moment-Rotation curve and Acceptance Criteria with Limited Ductility
Pushover analysis is conducted again on the same vertical section but this time given different reinforcement detailing and shear reinforcement ratio, which corresponds to different level of ductility (limited ductility). Fig. 3- 22 shows the moment rotation curve and hinge response in the vertical section shear wall in case it is designed as limited ductile.
It can be observed from the Fig. 3- 22 that the section is still between Immediate Occupancy (IO) (0.003 rad.) and Life Safety (0.009) limits with a maximum plastic rotation of 0.004 rad.
CHAPTER 4
SUMMARY AND CONCLUSIONS
4.1 Summary
4.2 Conclusions:
A high-rise 65-story building subjected to wind loads was considered in this study to assess ductility-based design approach for high-rise buildings under extreme wind loads. Pressure coefficient (CP) time history values were taken from wind tunnel test and used to evaluate wind
story forces. A 3D model was constructed for the building and time-history dynamic analysis was conducted to evaluate total wind responses of the structure. Quasi-static analysis was conducted to capture the mean + background components of the response (VQ (t)) and separate them from the
resonant part (VR (t)). Resonant part of the response was reduced by a factor “R” and shear walls
were redesigned under reduced load to assess structure’s dynamic characteristics. The case study results presented in this chapter shows that by reducing wind resonant component by a factor of “2”, and redesigning wind load resisting system members under reduced loads results in reduction in concrete walls dimensions by 20-25% with no major change in the fundamental period. Fundamental period of the period increased by 6% only. Peak responses did not increase when making the building more flexible, with a decrease of 7%. A parametric study was done on the “R” reduction factor studying its effect on building response. It was found that as a result of increasing R factor, the peak base shear decreases, and the fundamental period of the building increases but the variation doesn’t exceed 6%.
A reduction factor R = 2 was selected by the designer and applied on wind resonant component of the response, and a certain level of ductility has to be achieved. The study presented in this chapter elaborates the inelastic behaviour for different sections of reinforced concrete shear walls, and assesses the ductility demand in these sections to justify the application of this reduction factor. Plastic rotations experienced by plastic hinges in shear walls are monitored and compared with Performance Limits defined in current codes (ASCE/SEI 41-13 and FEMA 356). Based on this comparison, the assessment is done on each individual wall and it was checked whether this ductility level and performance is acceptable as the philosophy adopted in seismic design, where controlled inelastic actions are permitted without major loss in strength and the members still have some margin before collapse. Each Performance level or plastic hinge state has to be associated with an action to be taken on the members experiencing inelastic actions as adopted in current building codes. In this study, all members are found to be in the Immediate Occupancy (IO) level, which as per (ASCE/SEI 41-13) is the state where the building is still safe to be occupied immediately after the extreme event occurred during the lifetime of the building.
The following conclusions are obtained from application of a ductility-based approach for a high-rise building subjected to extreme wind loads:
1- Concrete shear wall cross sections were reduced by 20-25% as a result of applying a load reduction factor to wind resonant component by R =2.
2- Fundamental period of the structure changed by only 6% after reducing shear wall cross-sections.
3- Total base shear of the building in the two orthogonal directions did not increase as a result of reducing shear wall cross-sections, and almost remained the same.
4- The same reduction procedure was repeated with R = 3, with no major change in fundamental period and building responses for the studied building.
The conclusions drawn from conducting static pushover analysis on reduced cross-sections of concrete shear walls are:
1- Ductility demand values for different shear wall modules, applying the assumption of equal displacements, are evaluated, and values are ranging between 1.17 and 1.3.
2- Target performance levels reached for ductile shear walls are between Immediate Occupancy (IO) and Life Safety (LS).
3- In case of limited ductile shear walls, target performance level reached is still in within the Immediate Occupancy (IO) range.
4.3 Recommendations for future work:
The current study investigated the application of ductility-based approach on high-rise building subjected to extreme wind loads, and assessed the inelastic actions experienced by concrete shear walls. The following investigations are suggested for future research:
1- Conducting non-linear static pushover analysis for the full model of the building using a powerful finite element tool, to monitor the sequence of plastic hinge formation within different members in the lateral load resisting system.
2- Carrying out dynamic time-history analysis on the reduced cross section of shear walls, to evaluate the hysterias loops, and assess the stiffness degradation due to large number of loading cycles.
3- Trying different number of cycles, and assessing the stiffness degradation in each case. 4- Repeating the analysis for several wind events with different return periods.