Cell Growth Control
Ian J. Conlon
Department of Biology (Laboratory for Molecular Cell Biology)
University College London
Thesis submitted to the University of London
for the degree of Doctor of Philosophy
ProQuest Number: U643312
All rights reserved
INFORMATION TO ALL USERS
The quality of this reproduction is dependent upon the quality of the copy submitted.
In the unlikely event that the author did not send a complete manuscript and there are missing pages, these will be noted. Also, if material had to be removed,
a note will indicate the deletion.
uest.
ProQuest U643312
Published by ProQuest LLC(2016). Copyright of the Dissertation is held by the Author.
All rights reserved.
This work is protected against unauthorized copying under Title 17, United States Code. Microform Edition © ProQuest LLC.
ProQuest LLC
789 East Eisenhower Parkway P.O. Box 1346
ABSTRACT
This thesis investigates the fundamental relationship between cell growth and
cell-cycle progression. Understanding this relationship is crucial to understanding
how cells proliferate, yet very little attention has been paid to it, especially in
vertebrate cells. In yeast cells it has been demonstrated that cell growth regulates
cell-cycle progression through the action of a cell-size checkpoint. Using normal
rat Schwann cells, I demonstrate that it is not necessary to invoke a cell-size
checkpoint to explain why these cells maintain their size while proliferating in
vitro. I show that an extracellular signalling molecule can promote Schwann cell-
cycle progression without promoting cell growth, and thus cell growth rate is not
the sole determinant of the rate o f cell-cycle progression or cell size. Also, I
investigate the intracellular signalling pathways stimulated by extracellular
signals that exert different effects on Schwann cell growth and cell-cycle
progression. It has previously been assumed that animal cells co-ordinate cell
growth and cell-cycle progression in a similar way to yeasts. Taken together with
CONTENTS
Abstract... 2
Contents... 3
Acknowledgements... 6
C hapter 1: G eneral Introduction... 7
Cell Growth... 8
Cell-cycle progression... 8
Cell proliferation... 9
- The relationships between cell growth and cell-cycle progression... 9
Extracellular controls on cell proliferation... 14
- Aims of this thesis... 15
C hapter 2; Is a cell-size control checkpoint necessary in Schwann cells?... 16
Introduction ... 17
R esults... 18
Is Schwann cell growth autocatalytic?... 18
Protein synthesis and degradation rates of large and small Schwann cells... 21
Different concentrations of serum induce different rates of linear growth... 23
Discussion... 23
An implication of cell growth rate being cell-cycle dependent... 29
The coupling of protein synthesis to protein degradation... 31
Growth of hepatocytes following starvation... 31
The implications of these results on the models on cell growth and cell-cycle progression... 32
M aterials and M ethods... 32
C hapter 3: E xtracellular control of cell size and cell-cvcle progression ra te 37 In troduction... 38
R esults... 40
- The effect o f extracellular signalling molecules on cell growth... 42
- The effect of IGF-I and GGF on cell-cycle progression... 46
The effect of IGF-I and GGF on cell-cycle progression rate in proliferating cells... 49
- The effect of IGF-I and GGF on cell size in proliferating cells... 53
Discussion... 53
GGF promotes cell-cycle progression and IGF-I promotes both cell growth and cell-cycle progression... 53
Cell-cycle progression can be promoted independently from cell growth at the extracellular level... 56
- Adherence and extracellular factors are required for cell growth... 58
M aterials and M ethods... 58
C hapter 4: Intracellular control of cell growth and cell-cvcle progression... 61
Introduction... 62
Results... 64
- The effect o f IGF-I and GGF on the PI3K and MAPK signalling pathways... 64
- The effect of specific intracellular signalling inhibitors on IGF-I induced growth... 66
- The effects o f overexpression of effectors o f the PI3K and MAPK pathways on cell growth... 69
- The effects o f IGF-I and GGF on MAPK and PI3K signalling pathways in quiescent cells... 71
- The effect o f specific intracellular signalling inhibitors on the synergistic promotion o f cell-cycle progression by IGF-I and GGF... 77
Discussion... 77
- Cell growth... 80
- Cell-cycle progression... 82
- The contribution of the MAPK and PI3K pathways to cell growth and cell-cycle progression... 82
- The synergistic promotion of cell-cycle progression by IGF-I and GGF... 82
Materials and Methods... 84
Chapter 5: General Discussion... 87
The cell-size checkpoint... 88
Extracellular factors and intracellular signals... 91
Proteins affecting cell growth and cell-cycle progression... 91
Sustained versus transient intracellular signals... 93
Changes in cell-cycle phase and total cell-cycle time... 93
- The permissive role of IGF-I... 94
- How common are ‘pure’ mitogens?... 94
A possible model describing the control of Schwann cell proliferation... 95
Why do yeast cells and cells from multicellular organisms have different mechanisms for co-ordinating cell growth with cell-cycle progression?... 95
How do extracellular growth factors promote cell growth?... 97
ACKNOWLEDGEMENTS
I would like to thank past and present members o f the lab for making it such an
enjoyable place to work. I have collaborated with Graham Dunn, Denise
Malcolm, and Lili Cheng at various times during this project; their help was much
appreciated. Paul Nurse, Robert Brooks, and Murdoch Mitchison stimulated me to
return to the previous work on the size control checkpoint and provided helpful
comments on my data. Anne Mudge provided useful advice throughout my time
in the lab. Alison Lloyd helped to expand the studies on intracellular signalling
pathways. Derek Knight kept my feet firmly on the ground. I will be Martin
R affs final PhD student and I feel honoured to have had the chance to work with
him. Finally, I would like to thank Helen Wood and my family for their love and
Chapter 1:
How is an organism’s size determined? This fundamental issue of developmental
biology remains mysterious, despite its importance. The size o f an organism
depends on the number and size o f the cells it contains (Conlon and Raff, 1999).
Thus, to understand how organism size is controlled, one must understand how
cell number and cell size are controlled. Fundamental to both o f these parameters
are the processes of cell growth and cell-cycle progression.
Cell growth
Cell growth depends on macromolecular synthesis (Su and O'Farrell, 1998),
which, if greater than macromolecular degradation and secretion, leads to an
increase in cell mass and cell size. This accumulation o f mass is carefully
orchestrated depending on the context of the cell (Schmelzle and Hall, 2000). For
instance, yeast cells grow only when nutrients are available (Schmelzle and Hall,
2000), and differentiated myocytes grow in response to the amount of work they
do (Goldberg, 1968). Despite the importance of cell growth, it has hardly been
studied compared to cell-cycle progression.
Cell-cycle progression
Virtually all cells in a multicellular organism contain a complete set o f genetic
instructions (Alberts, 1994). The cell cycle is the process by which a cell
duplicates its DNA, segregates it correctly during mitosis, and divides. The cell
cycle is divided into four phases. DNA replication occurs in S phase. The interval
between the completion of mitosis (M phase) and the beginning o f DNA synthesis
is called the G1 phase, and the interval between the end of DNA synthesis and the
beginning of mitosis is called the G2 phase. Most proliferating cells conform to
this standard cell cycle and progress in sequence through G l, S, G2, and M phases
Cell proliferation
Both cell growth and cell-cycle progression are necessary for sustained cell
proliferation (Su and O'Farrell, 1998). Without cell growth, proliferating cells
would progressively decrease in size, and, without cell-cycle progression, cell
number would not increase. Even the early divisions of amphibian embryos,
where cell-cycle progression occurs without apparent cell growth, depend on the
massive previous growth of the egg.
For proliferating cells, cell number is determined by the rate o f progression
through the cell-cycle (and cell death, which I won’t discuss here) (Conlon and
Raff, 1999). Their size at division is determined by the initial size o f the cell, the
rate of progression through the cell-cycle, and the rate of cell growth (Conlon and
Raff, 1999). Therefore, to understand how cell number and cell size are
controlled, one needs to understand how the rate o f cell growth and the rate of
cell-cycle progression are controlled. This is not simple, however, as cell-cycle
progression is, to some extent, influenced by cell growth, and vice versa. These
interactions are poorly understood, in part because almost all studies on cell
proliferation have concentrated on cell-cycle progression, without a consideration
of cell growth. Thus, proteins thought to stimulate cell-cycle progression directly,
for example, may, in fact, stimulate progression indirectly by promoting growth.
In addition, there is confusion in the terminology used in the literature in that the
term ‘growth’ is often used to mean proliferation.
The relationships between cell growth and cell-cycle progression
The rate o f cell production and the size of cells within the same tissue at the same
developmental time are highly reproducible, suggesting that cell growth and cell-
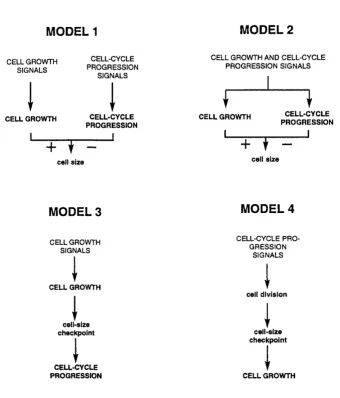
cycle progression are somehow coupled (Coelho and Leevers, 2000). Coelho and
Leevers have suggested four models by which this coupling could be achieved
(see Figure 1.1). In the first model, cell growth and cell-cycle progression are
Figure 1.1
MODEL 1 MODEL 2
CELL GROW TH SIGNALS
CELL-CYCLE PR O G R E SSIO N
SIGNALS
CELL GROW TH AND CELL-CYCLE PR O G R E SS IO N SIGNALS
CELL GROWTH CELL-CYCLE
PROGRESSION
CELL GROWTH
cell size
CELL-CYCLE PROGRESSION
cell size
MODEL 3 MODEL 4
CELL GROWTH SIGNALS
CELL-CYCLE P R O G R ESSIO N
SIGNALS
CELL GROWTH
cell division
cell-size
checkpoint cell-size
checkpoint
CELL-CYCLE
PROGRESSION CELL GROWTH
model, cell growth and cell-cycle progression are regulated by a common signal.
In the third model, signals promote cell growth, and, when the cell reaches a
specific size, cell-cycle progression is triggered. In the fourth model, signals
promote cell-cycle progression, and, when the cell decreases in size (by cell
division) past a certain threshold, cell growth is triggered. These models are not
mutually exclusive.
I will review below the few studies where both cell growth and cell-cycle
progression have been considered together. I will use the models described above
to interpret these results, and in the subsequent chapters, to interpret data from my
experiments. Though I will discuss the models in relation to experiments that
examine the interaction between cell growth and cell-cycle progression at both the
extracellular and intracellular level, it is important to note that the hierarchy of
signalling is important in understanding how proliferation is controlled in vivo.
For example, downstream signalling molecules that promote only cell growth or
cell-cycle progression are consistent with model 1. These proteins, however, may
be controlled by upstream signals that promote both cell growth and cell-cycle
progression, and therefore, in this case, model 2 rather than model 1, describes the
controls on proliferation.
In experiments where cell growth and cell-cycle progression have been addressed,
the rate of cell-cycle progression was usually determined by counting the number
of cells produced over a certain time period. As the cell cycle is split into different
phases, and one phase may be more influenced by gro^wth rate than another, the
proportion o f cells in the different phases of the cell cycle was sometimes also
determined. The rate o f cell gro^vth was measured by assessing the accumulation
o f mass over time, for one or several cells. Mass was usually measured by
determining cell volume or cell protein content.
Yeasts were the first eukaryotic organisms where both processes were
investigated. Hartwell, in the 1960’s, isolated several hundred temperature-
cell growth) and cell division (Hartwell, 1967). When cell-cycle mutants were
blocked at any stage of the cycle, cell growth continued (Johnston et al., 1977).
This finding excludes model four for yeast, as continued growth does not depend
on progression through the cell cycle. When cell growth was restricted, cells that
had initiated a cell cycle were able to complete it and then arrested in G l
(Johnston et al., 1977). As they were not growing during this period, the daughter
cells produced were abnormally small. Interestingly, when growth was no longer
restricted, the smallest cells took the greatest length of time to progress through
the subsequent cell cycle. This suggests that a minimum cell size must be reached
before the next cell cycle is initiated. The data from yeast have been used to
promote the third model of how cell growth is coupled to cell-cycle progression.
The idea of a cell-size checkpoint is discussed more in the next chapter and in the
General Discussion.
The interactions between cell growth and cell-cycle progression in animal cells
have, until recently, received very little attention. Almost all of the recent studies
have been carried out in Drosophila (Oldham et al., 2000). The effects on cell
growth and cell-cycle progression o f proteins known to be involved in
proliferation have been studied in the cells of the wing and eye imaginai discs.
The imaginai discs are the tissues destined to form the adult fly; they develop
during the larval phase o f D rosophila development (Hartenstein, 1993). The
proteins tested fell into three groups. The first group affected both cell gro^vth and
cell-cycle progression: when the proteins were overexpressed, cell growth and
cell-cycle progression (through one or all phases) were accelerated. This group
included Ras (Prober and Edgar, 2000), Myc (Johnston et al., 1999), Cyclin D
(Datar et al., 2000), and Phosphatidylinositide 3-kinase (P13K) (Weinkove et al.,
1999). All but Cyclin D had a proportionally greater effect on cell-cycle
progression from G l into S phase. The second group affected only cell-cycle
progression: when the proteins were overexpressed, only cell-cycle progression
was accelerated. This group included cyclin E, dE2F, and string, a cdc25
phosphatase that affects progression from G2 into M phase (Neufeld et al., 1998).
cell growth rate increased, but neither the total cell cycle time nor the phasing of
the cell-cycle were affected. This group, so far, only includes Akt, a downstream
target of the PI3K signalling pathway (Verdu et al., 1999).
In the categories above, I have, for simplicity, only considered positive regulators
of either cell-cycle progression, cell growth, or both. Negative regulators of cell
growth and cell-cycle progression exist. RBF, the Drosophila homologue of RB,
for example, inhibits cell-cycle progression when overexpressed and therefore
belongs to the second group of proteins (Neufeld et al., 1998).
What do these results say about the coupling o f cell growth and cell-cycle
progression in animal cells? One major conclusion is that at the intracellular level
the cell cycle can be uncoupled from cell growth (by overexpression o f group 2
proteins), and cell growth can be uncoupled from cell-cycle progression (by
overexpression o f the group 3 protein, Akt). This would appear to lend support for
the first model, where separate signals promote cell growth and cell-cycle
progression. This, however, need not be the case. Both sets of proteins could be
downstream of signals that couple both cell growth and cell-cycle progression
(model 2). In addition, the activities of the second group of proteins could be
directly regulated by cell growth (model 3). This would mean that the uncoupling
of cell size and cell-cycle progression rate from cell growth rate is an artefact of
experimental overexpression. To distinguish between models 1 and 2 in this case,
it is necessary to analyse the effects of the signals that are furthest upstream, i.e.
extracellular signals.
The effects of the group one proteins (those that affect both cell growth and cell-
cycle progression) have been suggested to be evidence for the third model
(Johnston et al., 1999; Prober and Edgar, 2000), in which cell-cycle progression is
indirectly promoted via the direct promotion of cell growth. These proteins,
however, could be having direct effects on the cell cycle as well as on cell growth
The fact that cell growth continues and cells get much larger when the cell-cycle
is slowed by overexpressing proteins such as RBF suggests that model 4 can be
discounted. As for yeast, animal cell growth appears not to be dependent on cell-
cycle progression. A clearer result, however, would be an experiment in which
cell-cycle progression was stopped completely in animal cells, as has been done in
yeast.
Largely because of the interpretation of the results from yeast, model 3 is widely
accepted as the way in which cell growth is coupled to cell-cycle progression in
all cells (Fantes and Nurse, 1977; Johnston et al., 1977; Nurse et al., 1976;
Polymenis and Schmidt, 1999; Stocker and Hafen, 2000). The evidence for the
existence of a cell-size checkpoint in animal cells, however, is very weak.
Extracellular controls on cell proliferation
Animal cells, unlike yeast cells, do not proliferate in medium containing only
nutrients (Alberts, 1994). They require the presence o f extracellular signals, and
usually attachment to a substratum (Alberts, 1994). These extracellular cues,
therefore, allow the cells to grow and progress through the cycle. Because o f this,
it is at the extracellular level where it will be important to establish if models 1 or
2 apply to proliferating animal cells.
Because there has been little work to distinguish between effects on cell growth
and cell-cycle progression, it is not known how extracellular factors promote cell
proliferation. Predictions can be made, however, about the expected behaviour of
extracellular factors from the models outlined previously. For instance, if cell
growth drives cell-cycle progression (model 3), one would expect all extracellular
factors to promote cell growth.
In the two studies where the effects o f extracellular factors on cell growth and
cell-cycle progression were studied, it was shown that certain proliferative
fibroblasts (Zetterberg et al., 1984) and thyroid stimulating hormone (TSH) in
thyrocytes (Taton and Dumont, 1995) have been shown to promote cell-cycle
progression without promoting an increase in dry cell mass or protein synthesis,
respectively. Although this is suggestive that extracellular signals can act solely
on cell-cycle progression (model 1), it has not been shown that this occurs in
proliferating cells.
Aims of this thesis
In this thesis, I aim to expand what is currently known about the interactions
between cell growth and cell-cycle progression in animal cells. I have chosen
primary rat Schwann cells as my model cell type. It is important to use primary
cells in studies on cell proliferation, as controls on proliferation are often
abnormal in cell lines. Rat Schwann cells are amenable primary cells to culture as
they can be isolated in large numbers (Cheng et al., 1998), purified to
homogeneity (Cheng et al., 1998), and passaged indefinitely (Mathon et al.,
2001).
In Chapter 2, I examine whether it is necessary to invoke a cell-size checkpoint
(model 3) to understand how cell growth and cell-cycle progression are co
ordinated in Schwann cells. In Chapter 3 ,1 examine the role of extracellular signal
molecules on cell growth and cell-cycle progression, and I apply the findings to
proliferating cells. In Chapter 4 , 1 examine the intracellular signalling pathways
Chapter 2:
Introduction
In the previous chapter, I outlined four models, each of which can explain how
cell growth interacts with cell-cycle progression. The third and fourth models
invoked a mechanism in which the cell can measure its size and adjust either cell-
cycle progression or cell growth to this size. Observations in yeasts and
mammalian cells have shown that the mean size o f cells in a proliferating
population remains constant over time (Brooks, 1981). Even though individual
cells vary in size at division, the distribution of cell sizes remains constant, with
no change in the co-efficient of variation (Brooks, 1981). Thus, cells that are
initially bigger or smaller than the mean after mitosis tend to return to the mean
size over time. These observations have led to the belief that a cell-size
checkpoint must exist to co-ordinate cell growth and cell-cycle progression and to
prevent an increase in size variation.
Such a mechanism is only required, however, if the rate of cell mass increase is
directly proportional to cell size - i.e. if the increase is autocatalytic (Brooks,
1981). If cell growth is autocatalytic, cells that are bom larger than the mean birth
size will grow faster than those that are smaller. Large cells will grow at a faster
rate, and if no cell-size checkpoint is operating will divide at larger size and
produce still larger daughters, which will again grow at faster rate, and so the
distribution of sizes in the population will not remain constant. If growth is not
autocatalytic, however, a cell-size checkpoint is not required to maintain a
constant distribution of cell sizes (see Discussion).
Measurements to determine whether cell growth is autocatalytic have usually
assessed whether the rate of mass accumulation increases through the cell-cycle
(e.g. Sveiczer et al., 1996). It is difficult, however, to distinguish between linear
and autocatalytic growth over the timescale o f a cell cycle (Brooks, 1981).
Moreover, even if cell growth rate increases through a cell-cycle, this does not
prove that cell growth is auto-catalytic. It could be, for example, that the increase
rather than the increase in cell size. Thus, the critical experiment to determine
whether cell growth is autocatalytic and therefore whether a size checkpoint is
necessary, is to arrest the cell cycle and then measure cell growth rate over time,
thereby removing the complicating factor of cell-cycle progression. This has been
done for yeast cells, and cell growth is autocatalytic (Nurse et ah, 1976). In this
chapter, I address whether Schwann cell growth is autocatalytic.
Results
I purified primary Schwann cells from postnatal day 7 (P7) rat sciatic nerve by
sequential immunopanning (Cheng et al., 1998). I maintained the cells in a
proliferative state in Dulbecco's m odified Eagles' m edium (DM EM ),
supplemented with 3% foetal calf serum (PCS), the neuregulin GGF, and the
adenylyl cyclase stimulator forskolin (complete medium). I passaged the cells
before they reached confluence. Their size, measured at the time o f passage,
remained constant through many passages over many months (A. Lloyd, pers.
comm.).
Is Schwann cell growth autocatalytic?
To determine whether Schwann cell growth was autocatalytic I developed an
assay to determine the growth rate of the cells when arrested at a specific point in
the cell cycle. To do this, quiescent Schwann cells were stimulated to re-enter the
cell-cycle and begin cell growth by exposure to 3% PCS and forskolin. At the
same time, the cells were blocked from progressing through S phase by the DNA
polymerase a inhibitor aphidicolin (Ikegami et al., 1978), resulting in cell-cycle
arrest at the beginning of S-phase. In these conditions, the cells continued to grow
in size for many days (see Figure 2.1).
To determine cell growth rate, the volume of the cells was measured every 24
hours in a Coulter counter after dislodging the cells from the culture dish with
Figure 2.1
f
/
y
Figure 2.2
12000
-10000
-cÇ 8000 3
I 6000
1
o 4000
-2000 1
24 48 72 96
hours after serum addition
120
progressively increase in size, if growth were autocatalytic, the rate o f growth
should increase over time, resulting in an exponential or exponential-like, growth
curve. Thus, cell growth for these cells in these conditions is not autocatalytic.
To confirm that the volume measurements in the Coulter counter produced a
reliable measure of cell growth I developed another technique to assess cell
growth rate. The cells were cultured in the same way and harvested at 24 hour
intervals as before, but cell size was determined by measuring the amount of
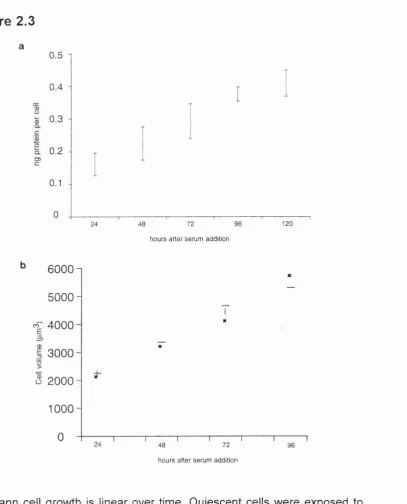
protein per cell. The rate of increase o f protein per cell was linear (Figure 2.3a);
consistent with the results obtained with the Coulter counter. The rate of growth
of the cells, however, was less in these experiments, probably because the cells
were cultured at higher density in order to have enough cells to measure the
protein content. At higher density, the cells are effectively exposed to a relatively
lower concentration o f serum than at lower densities (and I show later that cell
growth rate increases with increased serum concentration). This interpretation was
supported in experiments where cell volume was measured in the Coulter counter:
cells plated at a higher density grew more slowly than cells plated at a low density
(compare Figure 2.3b to Figure 2.2). In Figure 2.3b, the cells were plated at the
same density as those for the protein assay, and the growth rates obtained from the
two experiments were comparable.
Protein synthesis and degradation rates of large and small Schwann cells
The growth rate of Schwann cells is not autocatalytic but is instead linear over
time. This means that over an equivalent time period, cells add the same net
amount of volume, independent of their size. As the rate o f protein accumulation
per cell is also linear, the cells also add the same net amount o f protein per day,
independent o f their size. Thus, the difference between protein synthesis and
protein degradation (plus secretion) must not change as the cells grow.
To determine the protein synthesis rate per cell as cells grow, cells were cultured
Figure 2.3
0.5 1
0.4
-o 0.3
-0. 0.2
D )
0.1
24 48 72 96
hours after serum addition
120
6 0 0 0
5 0 0 0
-cÇ 4000
i 3 0 0 0
ü 2 0 0 0
-1000
-0
24 48 72
hours after seru m addition
96
Schwann cell growth is linear over time. Quiescent cells were exposed to medium containing 3 % serum and forskolin, as well as with aphidicolin to arrest them in S-phase. Cell size was assessed at the time points indicated, a, The amount of protein per cell. Each bar represents the 60% confidence
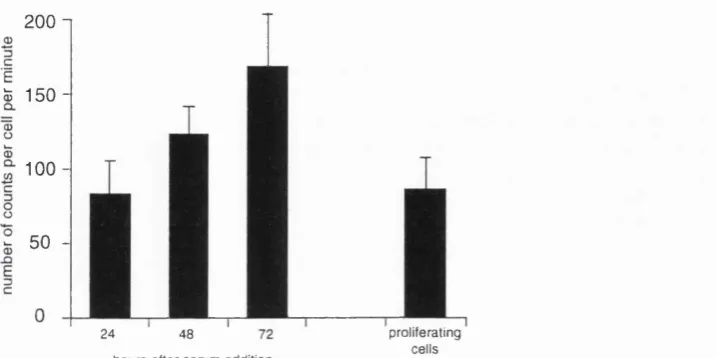
addition, the cells were incubated for two hours with methionine and
cysteine, and the amount of radio labelled protein per cell was determined. As can
be seen in Figure 2.4, the rate of protein synthesis increased as the cells increased
in size.
As discussed above, the rate of protein accumulation increases linearly as the cells
get bigger. If protein synthesis is increasing with cell size, then protein
degradation must also increase as the cells get bigger. To determine the rate of
protein degradation, cells were treated as above and harvested after the 2 hour
with methionine and cysteine. They were washed, incubated in non
radioactive medium, and harvested after a further 2 or 6 hour ‘chase’. The
decrease in radiolabelled protein observed during the chase was taken as a
measure of the protein degradation rate. As can be seen in Figure 2.5, the rate of
protein degradation increased as the cells increased in size.
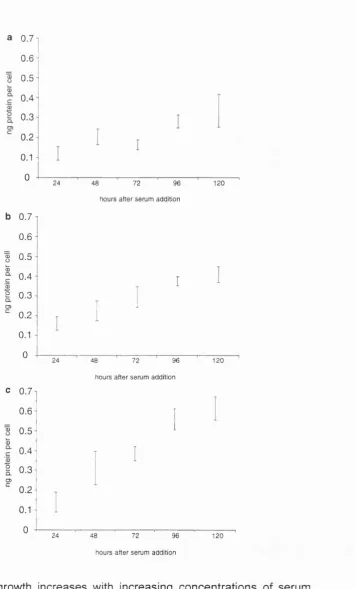
Different concentrations of serum induce different rates of linear growth.
To determine if cell growth remained linear in different growth conditions,
quiescent Schwann cells were exposed to either 1%, 3%, or 10% serum, as well as
forskolin, and aphidicolin. Their growth rate was determined by measuring cell
volume (Figure 2.6) or protein per cell (Figure 2.7) every 24 hours. The rate of
growth in the three conditions was linear and increased with increasing serum
concentration. In addition, cells in 1% serum, forskolin, and aphidicolin exhibited
linear growth over nine days of measurement (Figure 2.6b).
Discussion
The idea of a cell-size checkpoint is pervasive throughout the cell-cycle field
(Alberts, 1994; Fantes and Nurse, 1977; Johnston et al., 1977; Nurse et al., 1976;
Polymenis and Schmidt, 1999; Stocker and Hafen, 2000). It is an attractive and
simple idea that appears to explain how proliferating cells in vitro maintain a
Figure 2.4
200-1
S
150-1 0 0
50
-24 48
hours after seru m addition
proliferating ce lls
Figure 2.5
300 1
2 0 0
-^ 1 0 0
-0
□ 96 hour arrest
■ 72 hour arrest
^ ♦ 48 hour arrest
• 24 hour arrest
2 4
tim e after p u lse (hours)
300-2 0 0
-“ 1 0 0
-0
tim e after p u lse (hours)
Figure 2.6
”e a . O co E a . (D E 14000 12000- 10000-8000
6000
4000
-2000 -
0
14000
12000 1 0 0 0 0-
8000
-> 6000 4 1
ü
4000
-2000 -
0
-h 10% FCS
♦ 3% FCS
■ 1% FCS
24 48 72 96
hours after seru m addition
120
24 48 72 96 120 144 168 192 216
hours after seru m addition
Figure 2.7
0.71
0.6
-0.5 0.4 0.34 0.2 0.14 0 0.7 0.6 0.5 0.4 0.3 0.2 0.1 0
c 0.7 n
0.6 % o 0.5 o5 Q. c 0.4-2 Q . 0.3 -05 C
0.20.1
0
-24 48 72 96
hours after seru m addition
120
24 48 72 96
hours after seru m addition
120
24 48 72 96
hours after serum addition
120
Schwann cell growth increases with increasing concentrations of serum. Quiescent cells were exposed to medium containing forskolin, aphidicolin, and a, 1% FCS, b, 3% FCS, c, 10% FCS. Cell size was determined by measuring the amount of protein per cell. Each bar represents the 60% confidence limit of the mean of the amount of protein per cell from a plate
universal acceptance, evidence that animal cells have a cell-size checkpoint is
weak.
Nearly all experiments in yeast and mammalian cells to determine whether cell
growth is autocatalytic have attempted to measure the growth rate through a cell-
cycle (Brooks, 1981). It is clear, from such experiments, that cell growth increases
through the cell-cycle (Fantes and Nurse, 1977; Sveiczer et al., 1996; G. Dunn
pers.comm.). On the basis of this observation it has been argued that cell growth
is autocatalytic, with growth rate increasing as cells enlarge through the cell-
cycle. My data show that cells arrested at the G l/S boundary grow at the same
rate no matter what their size. Experiments in 3T3 cells just after division have
shovm that large and small cells grow at the same rate (Brooks and Shields,
1985). These data suggest that the increase in growth rate through the cell-cycle is
related to cell-cycle progression, rather than to increasing size. Indeed, it is not
even clear whether the increase in growth rate through the cell-cycle is
exponential (as would be expected if growth rate were related to cell size). In the
best-studied case in yeast, the growth rate is linear for the first phase o f the cycle
and then increases, but it remains linear (Sveiczer et al., 1996). This increase in
growth rate through the cell-cycle might reflect the increase in ploidy as a cell
traverses S-phase, perhaps because more mRNA templates are available for
translation. If the increase in growth rate depends on cell-cycle progression rather
than on an increase in cell size, it cannot be used as an argument that cell growth
is autocatalytic and that a cell-size checkpoint is necessary.
As explained in the Introduction, a cell-size checkpoint is only required to
maintain a constant size distribution in proliferating cells if cell growth rate is
directly proportional to cell size. Because Schwann cell growth is independent of
cell size, a consistent mean cell size does not require a cell size checkpoint.
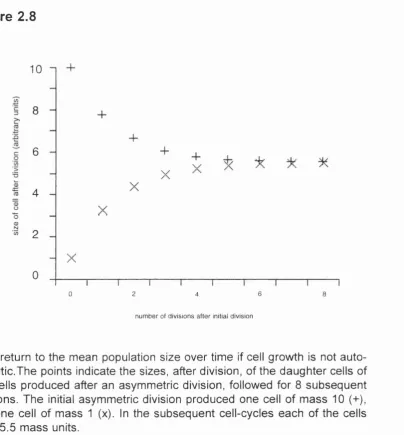
This argument can be illustrated by the following example. Suppose a cell divides
asymmetrically to produce one daughter cell o f mass 10 (arbitrary units) and
divisions, it can be seen that the two cells will converge to a mean size of 5.5
(Figure 2.8), assuming that cell-cycle length and growth rate are equal (5.5 mass
units, and 5.5 time units) for large and small cells, as would be the case for non-
autocatalytic cell growth. This convergence can occur in the absence o f a direct
coupling between cell size and cell-cycle progression, because large cells will not
double their cell mass in one cycle, and small cells will more than double their
cell mass in one cycle.
An implication of cell growth rate being cell-cycle dependent
I argue above that the increase in cell grov^th rate through the cell-cycle is
dependent upon the stage o f the cell-cycle rather than cell size. In the General
Introduction, I discussed the experiments carried out in Drosophila where proteins
known to promote proliferation were assessed on their ability to promote cell
growth and cell-cycle progression. One group o f proteins (assigned to group 1)
affected both cell growth and cell-cycle progression when overexpressed. This
finding has been used to argue that these proteins promote cell-cycle progression
by increasing cell growth (i.e. model 3) (e.g. Johnston et al., 1999). It is possible,
however, that these proteins directly promote cell-cycle progression. If this is the
case, their effect on cell growth could be indirect and secondary to their effect on
cell-cycle progression. This could work if, for instance, growth rate during the
cycle is ploidy-dependent: overexpression o f Ras, for example, results in an
acceleration through 01, and a greater growth rate (Prober and Edgar, 2000); the
greater growth rate could be due to less time being spent in G1 and more time
spent in S and G2, where growth would be greater because o f the 4N amount of
DNA.
Thus, although cell growth does not depend on cell-cycle progression (and
therefore model 4 does not apply to these cells), cell growth rate may depend on
the phases of the cell-cycle. Thus, there are three ways in which group 1 proteins
could be promoting cell growth and cell-cycle progression. They could promote
Figure 2.8
10
8
6
4
2
0
2 6
0 4 8
num ber of division s after initial division
The coupling of protein synthesis to protein degradation
Although Schwann cell growth rate does not increase with cell size, the rates of
both protein synthesis and protein degradation increase proportionally with cell
size, indicating that the cells somehow couple synthesis and degradation to
maintain linear growth. This coupling mechanism has received little attention and
therefore remains mysterious. It has been shown, however, that an extracellular
growth factor, nerve growth factor (NGF), is required to couple the rate of protein
synthesis to the rate of protein degradation in rat sympathetic neurons in culture
(Franklin and Johnson, 1998). When protein synthesis was blocked by
cyclohexamide treatment in the presence of NGF, the degradation rate o f long-
lived proteins also decreased, and the cells maintained their size. However, in the
absence o f NGF, the degradation rate did not decrease, and the neurons rapidly
atrophied when treated with cyclohexamide. It is not known how NGF exerts this
remarkable effect (Franklin and Johnson, 1998).
The coupling between protein synthesis and protein degradation is presumably
very important, as the cell must control the coupling in order to control its growth
rate. The rate of protein accumulation (and therefore growth) is the difference
between the rates o f protein synthesis and degradation. As increasing
concentrations of serum increase the rate of Schwann cell growth, it is clear that
the coupling between protein synthesis and protein degradation is regulated by
extracellular factors in serum.
Growth of hepatocytes following starvation
A previous study provides additional evidence for linear growth of mammalian
cells, in this case, in vivo (Hutson and Mortimore, 1982). When a mouse is
starved for 48 hours, its liver shrinks in size by 40%. This shrinkage is entirely
due to the shrinkage of hepatocytes rather than to cell death. Upon refeeding, the
through cell division. As can be seen in Figure 2.9, the rate o f valine accumulation
in liver cells, presumably reflecting the rate o f protein accumulation and cell
growth, is linear. Thus for hepatocytes in vivo, just as for Schwann cells in vitro,
cell growth is linear.
The implications of these results on the models on cell growth and cell-cycle
progression
As cell growth is autocatalytic in yeast, a cell-size checkpoint is necessary to
explain how proliferating cells in the same conditions maintain their size. This
makes it likely that the observations detailed in the General Introduction, where
small yeast cells take longer to progress through a cell-cycle than large yeast cells,
are explained by the action of a cell-size checkpoint. Therefore, model 3, where
cell growth drives cell-cycle progression through a cell-size threshold, appears to
be important for the control of yeast cell proliferation.
The results discussed in this chapter show that cell growth is not autocatalytic for
Schwann cells. This means that a cell-size checkpoint is not required to explain
why Schwann cells maintain their size when proliferating. It does not, however,
mean that a cell-size checkpoint does not exist in these cells. Model 3 could still
apply. Model 4, however, like in yeast and Drosophila cells, does not apply to
Schwann cells, because cell growth continues in the absence o f cell-cycle
progression. Cell growth is thus not dependent on cell-cycle progression. The
precise rate of cell growth, however, may be dependent on the position in the cell-
cycle.
Materials and methods
Figure 2.9
_ REM O VE FOOD
REFEED
(a d U bih im }
260
220
u_
I S O
1 4 0
-too*
2 4 6
0
time (days)
from Hutson and Mortimore, 1982
Cell culture
Schwann cells were purified from P7 rat sciatic nerve by sequential immunopanning
as previously described (Cheng et ah, 1998). The cells were expanded on poly-D-
lysine-and flbronectin-coated culture dishes (Falcon) in DM EM (Gibco),
supplemented wdth 3% FCS, 1 |iM forskolin (Calbiochem) and recombinant GGF (a
gift from M.Marchionni, Cambridge NeuroScience) (complete medium). Cells were
passaged every 3 days and were >99.9% pure as judged by antigenic markers (Cheng
et al., 1995).
Cell growth analysis using cell volume
Quiescent cells were obtained by culturing cells to confluence. About 4 x 10^
quiescent cells were plated per well o f a 6 well poly-D-lysine and fibronectin-coated
dish culture dish (Falcon) (area 9.6 cm2) in medium containing 1%, 3%, or 10% FCS
with 1 pg/ml aphidicolin to arrest them in S-phase. Cell size was assessed every 24
hours in a Coulter Counter (Multisizer II, Beckman-Coulter) using a volumetric
analysis. To assess size in the Coulter Counter, cells were removed from the tissue
culture dish with trypsin-EDTA (Gibco) and resuspended in Isoton II (Beckman-
Coulter). Each point on a graph represents the mode o f cell sizes from a well.
Between 1000 and 5000 cells were counted per well, and the data were analysed
using Coulter Multisizer Accucomp colour software (Beckman-Coulter). All of the
experiments were repeated at least three times, with similar results.
It is important to note that the aphidicolin block at S-phase may not be absolute.
Previous studies (e.g. Sorscher and Cordeiro-Stone, 1991) have demonstrated that
DNA replication can occur in some cell types in the presence of aphidicolin, albeit at
a much reduced rate. No mitotic figures were seen in my cultures, indicating that the
cells did not progress to M-phase, but they may have progressed beyond the G l/S
Cell growth analysis using protein per cell
Quiescent cells were obtained by culturing cells to confluence. About 1 x 10^
quiescent cells were plated in a poly-D-lysine-and fibronectin-coated culture dish
(Falcon) (diameter 15 cm) in medium containing 1%, 3%, or 10% FCS with 1 pg/ml
aphidicolin to arrest them in S-phase. Protein content was assessed every 24 hours.
The plates were rinsed twice with PBS, and the cells scraped off the dish and
centrifuged at 4000 rpm in for 3 minutes. The cells were then resuspended and two
aliquots removed - one for cell number analysis and one for protein analysis. Cell
number was determined by measuring the concentration of DNA in the aliquot and
assuming the haploid weight o f DNA in the cells is 6 pg. Protein concentration was
determined by lysing the cells in 0.4% Triton and 0.2% SDS with protease inhibitors
(Boehringer Mannheim) on ice for 15 minutes and carrying out a micro-BCA assay
on the resultant solution, using a BSA standard. The experiments were done twice for
each condition, with similar results.
Protein synthesis and degradation rates
Quiescent cells were obtained by culturing cells to confluence. About 1 x 10^
quiescent cells were plated in a poly-D-lysine-and fibronectin-coated dish culture
dish (Falcon) (diameter 5.5 cm) in medium containing 3%, or 10% FCS with 1 pg/ml
aphidicolin to arrest them in S-phase (except in one experiment where the protein
synthesis rate in proliferating cells was determined). At the time point to be
investigated, cells were washed twice with cysteine-and methionine-free DMEM
(Gibco) and 2.5 ml o f this DMEM with glutamate, forskolin, and serum was added.
lOOuCi o f ^^S methionine and cysteine (Amersham) were added and the cells
incubated at 37°C for 2 hours. The amount of radiolabel was not limiting as the
amount in the medium did not significantly decrease during the experiment. The cells
were then washed and, if protein synthesis rate was to be measured, were trypsinised,
spun down at 3000 rpm, and then resuspended in serum-free medium. Aliquots were
counter. Radiolabel incorporation was assessed by lysing the cells in 0.2% triton then
removing three aliquots and counting them in a scintillation counter. 100% ice cold
TCA was added to a final concentration o f 10% to precipitate proteins. After 10
minutes on ice, the solution was centrifuged at 14,000 rpm to pellet the precipitated
protein, and the amount of non-incorporated radiolabel assessed by removing three
aliquots and counting in a scintillation counter. The amount o f label incorporated
into protein was the reading from the total cell lysate minus the reading from the non
incorporated label. To determine the rate of degradation, cells were washed three
times with complete medium and then left for either 2 or 6 hours, and the above
procedure was followed to assess the amount of radiolabelled protein still remaining
in the cells after the chase. Each point represented 3 plates o f cells, and the
Chapter 3:
Introduction
Yeast cells seem to have a cell-size checkpoint, and its action appears to explain
the relationship between cell growth and cell-cycle progression in proliferating
yeast cells. As discussed in the General Introduction, this model has also been
assumed to apply to animal cells. The evidence for this, however, is very weak,
and, in the previous chapter, I demonstrated that a cell-size checkpoint is not
necessary to explain how proliferating Schwann cells maintain their size. In this
chapter I investigate which of the models outlined in the General Introduction
apply to proliferating Schwann cells.
It has been shown in Drosophila that cell growth can be dissociated from cell-
cycle progression (by overexpression o f Akt) (Verdu et al., 1999), and cell-cycle
progression can be dissociated from cell growth (by overexpression o f proteins
such as dE2F) (Neufeld et al., 1998). This does not mean, however, that the
controls on these processes are separable in Drosophila cells (as in model 1),
because intracellular and extracellular signalling molecules upstream of these
proteins may promote both cell growth and cell-cycle progression directly.
Therefore, I have investigated the actions of extracellular signals on cell growth
and cell-cycle progression as the most upstream signals acting on these processes.
By considering the models outlined in the General Introduction, predictions can
be made about the action o f extracellular signals on cell growth and cell-cycle
progression. If model 3 were sufficient to explain the relationship between cell
growth and cell-cycle progression, as in yeast, then one would expect those
extracellular factors that promote cell proliferation to promote cell growth. Cell-
cycle progression would be stimulated indirectly via the action o f a cell-size
checkpoint. If model 1 is operates, then some extracellular factors should directly
stimulate only cell growth, and some should directly stimulate only cell-cycle
I have investigated the effect of the extracellular factors in two ways - first, by
analysing the effects on cell growth in cell-cycle arrested cells and the effects on
cell-cycle progression in quiescent cells, and second, by analysing the effects of
changing the concentration of extracellular factors on cell-cycle rate and cell size
in proliferating cells. I concentrated on two extracellular factors, insulin-like-
growth-factor-I (IGF-I), and glial growth factor (GGF).
IGF-I is an 8 kDa protein that is expressed by many types o f cells and tissues
(Froesch et ah, 1985). It has been implicated in the promotion of both protein
translation (which is necessary for cell growth) (Froesch et al., 1985)and cell
survival (Butt et al., 1999). IGF-I knockout mice are small at birth and exhibit
reduced growth rates throughout development (Efstratiadis, 1998). IGF-I is
required for the serum-free culture of many cell types (Froesch et al., 1985). It
acts via the IGF-I receptor (IGFIR) (Efstratiadis, 1998). Ligand binding results in
tyrosine phosphorylation of the receptor and various signalling proteins that bind
to it. This in turn activates downstream signalling pathways. IGFIR knock-outs
are reduced in size at birth and die immediately due to an inability to breathe.
IGFIRs are found on the surface of most cell-types (Efstratiadis, 1998).
GGF (80 kDa) is the soluble isoform of the neuregulin-1 gene. The neuregulins
are a family of alternatively spliced, soluble or membrane-bound proteins encoded
by four known genes. Neuregulin-1, which was the first member of this family to
be described and remains the best characterised, is highly expressed in the
neurons of the peripheral and central nervous system during development (Garratt
et al., 2000). Neuregulin-1 promotes the proliferation of Schwann cells. Mice with
targeted disruptions of the neuregulin-1 gene exhibit a severe deficiency of
precursor Schwann cells (Meyer and Birchmeier, 1995). NeureguIin-1 isoforms
mediate their effects via members of the erbB receptor tyrosine kinase family,
which includes the EGF receptor (erbBl), erbB2, erbB3, and erbB4 (Adlkofer and
Lai, 2000). Ligand binding is believed to result in receptor dimerization and
tyrosine autophosphorylation and subsequent activation of multiple intracellular
receptor proteins expressed by Schwann cells and their precursors during
peripheral nerve development (Cohen et al., 1992; Levi et ah, 1995; Shah et al.,
1994). Consistent with the critical role of these receptors, Schwann cells fail to
develop in peripheral nerves of mice with knockouts of either erbB2 or erbB3
(Garratt et a l, 2000).
I find that IGF-I, but not GGF, promotes cell growth, whereas both factors
promote cell-cycle progression. By varying the concentration o f GGF in a
constant concentration of IGF-I, I show that cell-cycle progression rate can be
dissociated from cell growth rate, and that the cells divide at a variable size,
despite the growth rate being a constant.
Results
Extracellular factors and attachment are necessary for cell growth
To measure cell growth separately from cell-cycle progression, the cells were
arrested in S phase for 24 hours by treatment with the DNA polymerase a
inhibitor aphidicolin, and their volume was assessed in a Coulter counter
following trypsinisation. In parallel experiments, the dry mass of adherent cells
was assessed using interferometric microscopy (Dunn and Zicha, 1993), which
confirmed that cell volume was a reliable measure of cell mass. When measured
by either technique, the aphidicolin-arrested cells grew much larger in complete
medium than untreated proliferating cells in the same medium, showing that the
cells can continue to grow in the absence of cell-cycle progression (Figures 3.1a
and 3.1b).
To determine if cell growth depended on extracellular signals, the cells were
switched, after 24 hours in complete medium and aphidicolin, into DMEM that
contained no serum or signal proteins (minimal medium) but that still contained
aphidicolin. The cells did not grow further (Figure 3.1c), demonstrating that
Figure 3.1
a
arrested ce lls proliferating ce lls
(Si
c3 O o
8
600 1000 3000 7000
Cell volum e (^m ^ )
g 200
proliferating arrested
cells cells
arrested ce lls
minimal m edium
c 3 o o CD o
1000 4000 7000 10000
Cell volum e (p.m^)
To assess if attachment was necessary for cell growth, I assessed the growth of
cells kept in suspension in either complete medium supplemented with
m ethylcellulose in minimal m edium supplem ented with methylcellulose.
Methylcellulose thickens the medium, allowing the cells to remain in suspension.
The cells suspended in complete medium did not grow or shrink over 24 hours
(Figure 3.2a) similar to the results with attached cells in minimal medium.
However, cells maintained in suspension in minimal medium shrank and began to
die (Figure 3.2b).
The effect of extracellular signalling molecules on cell growth
The extracellular factors platelet-derived-growth-factor-AA (PDGF-AA), basic
fibroblast-growth-factor (FGF), GGF, and IGF-I, have been shown to promote
Schwann cell proliferation (Burden and Yarden, 1997; Cheng et al., 1998; Davis
and Stroobant, 1990; Stewart et al., 1996). Therefore, if cell growth rate limits the
rate of cell-cycle progression (as in model 3), all of these proteins might be
expected to stimulate Schwann cell growth. To test whether these extracellular
factors could promote cell growth we switched the cells after 24 hours in
complete medium and aphidicolin into minimal medium containing aphidicolin
and the individual extracellular factors for another 24 hours. As shown in Figure
3.3, IGF-I stimulated cell growth (Figure 3.3a), but the other factors did not
(Figure 3.3b-d),
To test for synergistic effects on growth, IGF-I alone and IGF-I in combination
with the other factors were tested in the assay. None o f the combinations
promoted growth over that o f IGF-I alone (Figure 3.4). Thus, in these conditions
at least, IGF-I is the only extracellular signalling molecule tested that promotes
Schwann cell growth.
In this assay, IGF-I is promoting cell growth in the absence o f cell-cycle
Figure 3.2
0 hours
2 4 hours
7 2 hours
i2 c 3
8
0) U
4000
700 1000
Cell volum e
0 hours
7 2 hours
c 3 O CJ 0) U
700 1000 4000
Cell volum e (|am^)
Figure 3.3
a
control 10 ng/ml IGF-I
Bc
3 8 (D O
1000 4000 7000 10000
C
control
10 ng/ml GGF
E3 O O 0) o 4000
1000 7000 10000
Cell volum e Cell v o lu m e (p.m^)
b
control
10 ng/ml bFG F
3 O
ü
CD O
4000 7000 10000
1000
Cell volum e (|im ^ )
d 11
control
10 ng/ml P D G F A A
g 3 O ü 0 O
1000 4000 7000 10000
C ell v o lu m e (iim ^ )
Figure 3.4
a i I
control 10 ng/ml IGF-I
Bc 3 O o 03 O
1000 4000 700010000
C
10 ng/ml IGF-I
10 ng/m l G G F + 10 ng/ml IGF-I
3 O
ü
03
O
1000 4000 7000 10000
Cell volum e Cell vo lu m e (p.m^)
b
10 ng/ml IGF-I
10 ng/ml bFGF -t- 10 ng/m l IGF
Bc
3
8
03
O
1000 4000 7000 10000
Cell volum e (|j.m^)
d
10 ng/ml IGF-I
10 ng/ml PDGF AA -t- 10 ng/ml IGF-I
I
38
03
O
1000 4000 7000 10000
C ell volu m e (nm ^)
progression, as could be the case for the group 1 proteins such as Ras (see
previous chapter).
The effect of IGF-I and GGF on cell-cycle progression
To confirm that both IGF-I and GGF promote cell-cycle progression cells were
quiesced in minimal medium for 48 hours and different concentrations of GGF
and IGF-I, alone or in combination, were added for another 24 hours, together
with bromodeoxyuridine (BrdU) to label S-phase cells. We then stained the cells
with an anti-BrdU antibody. As shown in Figure 3.5a, IGF-I had little effect on
BrdU incorporation on its own, whereas the higher concentration o f GGF alone
weakly stimulated incorporation. Thus, GGF stimulated entry into S phase, even
though it did not promote cell growth - either in these conditions (Figure 3.5b) or
in the conditions described above (Figures 3.3 and 3.4). The combination of IGF-I
and GGF, however, stimulated BrdU incorporation much more strongly than GGF
alone (Figure 3.5a), indicating that IGF-I can co-operate with GGF to stimulate
entry into S phase. A low concentration o f GGF stimulated S-phase progression
less well, either alone or in combination with IGF-I, than a high concentration of
GGF, indicating that the levels o f GGF were not saturating for cell-cycle
progression in this assay (cell growth was not stimulated at either concentration).
The growth promoting effects of the different concentrations o f IGF-I and GGF
are shown in Figure 3.6. It can be seen that 10 ng/ml IGF-I appears to be
saturating for growth, whereas, 100 ng/ml IGF-I has a stronger synergistic effect
on cell-cycle progression in combination with GGF. This argues that the effect of
IGF-I on cell-cycle progression is not related exclusively to its effect on cell
growth.
GGF appears to be a ‘pure’ mitogen for Schwann cells, as it stimulates cell-cycle
progression but not cell growth. IGF-I, by contrast, promotes both cell growth and
cell-cycle progression and at least some o f its effects on cell-cycle progression
seem to be independent of its effects on cell growth. Though the above
Figure 3.5
a
10 20
0 30 40 50
IGF-I GGF
(ng/ml) (ng/ml)
10
100
2
20
10 2
10 20
100 2
100 20
% BrdU incorporation
control
2 0 ng/ml GGF
c ZJ
o
o 0) o
700 1000 4000
Cell volum e (|im ^ )
control
1 0 0 ng/m l IGF-I
8
<u o
700 1000 4000
C ell v o lu m e (|im ^ )
Figure 3.6
a control
10 0 ng/ml IGF-I
10 ng/ml IGF-I c 3 O CJ CD U
1000 4000 700010000
control
10 0 ng/ml IGF-I 10 0 ng/ml
IGF-I + 2 0 ng/ml
GGF
Cell volum e (|im ^ )
1000 4000 7000 10000
Cell vo lu m e (|im ^ )
control
b
2 ng/ml GGF
20 ng/ml GGF 3 8 CD O 7000 10000 1000 4000
C ell volum e (|im ^ )
d co m p le te
m edium
10 0 ng/ml IGF-I
I
38
CD O
1000 4000 7000 10000
C ell v o lu m e (iim ^ )
raise the possibility that the concentration of extracellular mitogen may affect the
rate of cell-cycle progression without influencing the rate o f cell growth (as in
model 1). This possibility is tested directly using proliferating cells in the next
section.
The effect of IGF-I and GGF on cell-cycle progression rate in proliferating
cells
It has been proposed that the rate of cell-cycle progression depends mainly on cell
growth rate (i.e. model 3). The finding that some extracellular signals stimulate
cell-cycle progression without stimulating cell growth suggests that this may not
always be the case. To test directly whether growth rate is rate-limiting for cell-
cycle progression the effects of keeping growth stimulation (IGF-I) constant and
varying the concentration of the mitogen (GGF) on proliferating Schwann cells
was studied. (If IGF-I affected only cell growth, it could have been determined
whether increasing levels of growth stimulation (IGF-I) increased cell-cycle rate
while keeping the mitogenic stimulation (GGF) constant; as IGF-I synergises with
GGF to stimulate cell-cycle progression (Figure 3.5a), the results o f such an
experiment would be difficult to interpret.)
Schwann cells are able to proliferate in serum-free medium. Cells were quiesced
in minimal medium for 48 hours as above, and then 100 ng/ml of IGF-I and either
2 or 20 ng/ml o f GGF were added; forskolin was also added, as it is required for
sustained proliferation of the cells (Cheng et al., 1998). It is thought that the
increased level of cAMP induced by forskolin prevents the downregulation of
receptors over time (Cheng et al., 1998; Weinmaster and Lemke, 1990). Even in
the presence o f forskolin, the growth rate o f aphidicolin-treated cells was the same
in the two concentrations of GGF (Figure 3.7).
As shown in Figure 3.8a and 3.8b, cells in 20 ng/ml GGF took less time to
progress through the cell cycle than did cells in 2 ng/ml GGF, confirming that the
Figure 3.7
control
high G G F
low G G F
Sc
3 O o CD o
5000 7000
1000 3000
C e ll v o lu m e (p.m ^)
Figure 3.8
3 0 0
-2 0 0
-■ I low GGF
□ high GGF
*
1:IUL
2 4 hours 48 hours 7 2 hours1 0 0 -1
80
60
40
-20
-0
■ I low GG F
□ high GG F
I
r n---I I n i i n i i i2 4 hours 4 8 hours 7 2 hours 9 6 hours
c e lls in G1 = 76% c e lls in G1 = 61% c e ils in S + G 2= 24% c e lls in S + G 2= 39%
high GGF low GGF
4C 2C
DNA content