IJEDR1602042
International Journal of Engineering Development and Research (www.ijedr.org)243
Comparison of Classification Techniques
For Diabetes Dataset Using Weka Tool
Minal Ugale, Darshana Patil, Meghana Shah Department Of Computer Engineering & IT
VJTI, Matunga
________________________________________________________________________________________________________
Abstract - As we know that the most life threaten disease which is prevalent in most of the developing as well as in developed countries is nothing but the Diabetes. The data classification can be applied on the dataset of the diabetic patients which can be developed by collecting enormous amount of data from the hospital repository having 1086 instances along with different attributes. Urine tests and blood tests are two categories of tests which are the instances in the given dataset. In the following paper we discuss and compare various classification algorithms of data mining that have been utilized for diabetic disease prediction. In order to do the classification of diseases such as cancer and diabetes many of data mining techniques used by the world health organization one of the technique is the classification only. As data mining is the computer assisted process of digging into and then analyses the large extent sets of data and then extracting the meaningful data. Data mining tools predicts behaviors, future trends and allows making of proactive decisions by businesses.
Keywords - Data Mining, Weka Tool, Classification, Naïve Bayes, J48 Tree, SMO, REP Tree, Random Tree.
________________________________________________________________________________________________________
I. WEKATOOL
In order to learn, analyse and compare the data mining tasks there is a collection of machine learning algorithms called as a Weka tool. This machine learning algorithm can be used as methods and called in Java codes. Also they can be applied to a dataset.
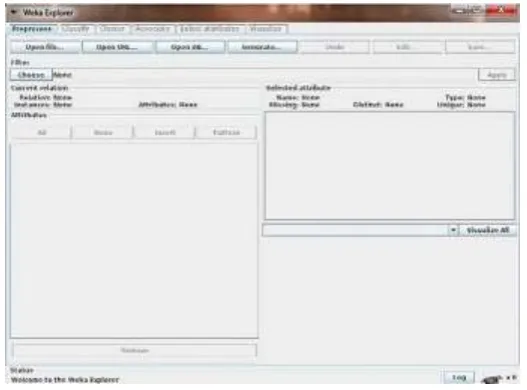
Figure 1- visualizes the interface of WEKA Data mining tool
In order to classify, to pre-process data, to cluster and apply association rules and regression algorithm Weka tool is used. In order to develop new machine learning schemes Weka is very convenient and well-suited tool.
It has four applications:
(1) Explorer: The explorer is an interface which has several panels such as to classify, preprocess, associate; select attribute, cluster and visualize it. But here in this interface mainly focusing on classification panel.
(2) Experimenter: Applying different algorithms on given dataset and results into systematic comparison between them, this is the facility provided by Experimenter interface. Here is algorithm is get executed by ten times and then the accuracy is finalized.
(3) Knowledge Flow: Explorer interface has an alternative interface which is nothing but the knowledge flow. Here in this interface user selects different components of Weka from the tool bar and connects according to the final layout of the running algorithms.
IJEDR1602042
International Journal of Engineering Development and Research (www.ijedr.org)244
Figure 2- WEKA ExplorerII. CLASSIFICATIONALGORITHM
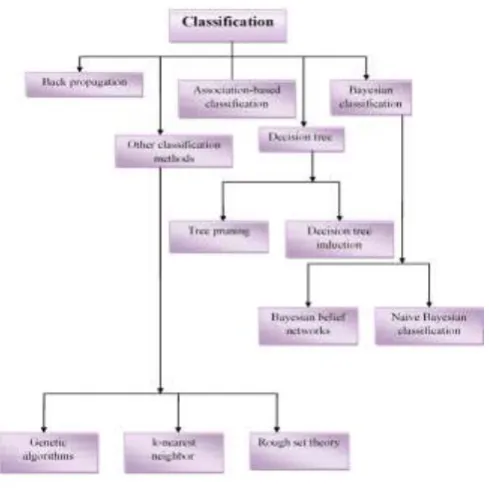
There is a data mining technique which is used to predict data instances group membership called as Classifications. One of the forms of data analysis, classification extracts models describing important data classes. Such models are called as classifiers; predict categorical (discrete, unordered) class labels. This analysis helps us to understand large set of data. There are many more classification algorithms and methods in pattern recognition, machine learning and statistics which are proposed by researcher.
1. Working of classification:
There are two steps of the data classification procedure which includes a) Building the Classifier or Model
b) Using Classifier for Classification
1.1 Building the Classifier or Model
This is called as learning phase or the learning step.
In this step the classifier is built by the classification algorithms.
Associated class labels of the database and their tuples are used to make the training set which is used to build the classifier.
As the training set consist of the tuples, where each tuple is referred to as a class or category. These tuples can also be named as object, sample or data points.
1.2 Using Classifier for Classification
IJEDR1602042
International Journal of Engineering Development and Research (www.ijedr.org)245
Figure 3- Classification Hierarchy2. Implementation In Different Interface’s
2.1 Explorer Interface
It first pre-processes the data and then filters the data. Users can then load the data file in CSV (Comma Separated Value) format and then analyse the classification accuracy result by selecting the following algorithms using 10 cross validation: Naïve Bayes, J48, SMO, REP Tree, and Random Tree.
Figure 4 shows the interface of explorer when The output obtained by scoring of NaïveBayes, J48, SMO, REPTree , Random Tree algorithm accuracy of is given on the basis of time, accuracy, error and ROC.
Figure 4- Screenshot view of Explorer Interface Accuracy
2.2 Experimenter Interface
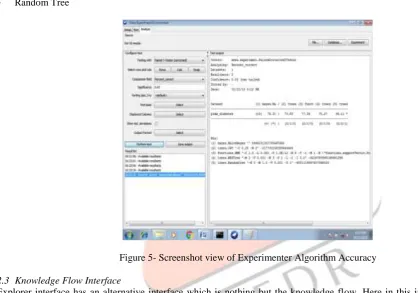
Here we analyse patient data using Experimenter Interface by experimenting through algorithms such as Naïve Bayes, REP Tree, J48 and Random Tree in order to classify the data using train and test sets. In Figure 5 we run four different algorithms on Diabetes datasets and analyse algorithms accuracy.
(a) Naïve Bayes
IJEDR1602042
International Journal of Engineering Development and Research (www.ijedr.org)246
(b) J48 TreeBased on different attributes of dataset we decide the target value using J48 tree algorithm in order to predict the accuracy of the algorithm.
(c) REP Tree
In order to analyse accuracy applied on the given i.e Diabetes dataset we use Weka classifier tree algorithm. (d) Random Tree
Random classifier tree algorithm is used in order to analyse the classification algorithm applied on the given dataset. Figure 5 gives analysis of all four algorithms experiment test, where each algorithm is run and executed 10 times and then the accuracy is reported. Here worse accuracy prediction is given by "*" and best accuracy prediction by". This means the prediction of the best and worse scoring accuracy is done between all four different algorithms listed below respectively:
Naïve Bayes J48 Tree
SMO
REP Tree Random Tree
Figure 5- Screenshot view of Experimenter Algorithm Accuracy
2.3 Knowledge Flow Interface
Explorer interface has an alternative interface which is nothing but the knowledge flow. Here in this interface user selects different components of Weka from the tool bar and connects according to the final layout of the running algorithms as shown in Figure 6.
In order to do our experimentation we have connected the several modules such as class assigner, CSV loader, Cross validation and the various algorithm such as REP tree, SMO etc. which is followed by Classifier Performance evaluator and finally we can see the output using text viewer.
IJEDR1602042
International Journal of Engineering Development and Research (www.ijedr.org)247
3. ComparisonsThe various data mining techniques Explorer, Experimenter and Knowledge flow that have been used by us use different algorithms such as Naïve Bayes, J48, SMO, RANDOM tree and REP tree. By using these techniques we trained out results on the basis of time taken to build model, correctly classified instances, error and ROC area. Algorithm scoring accuracy is shown in Table 1.
The correctly instances accuracy of the Naïve Bayes is 76.3021 % along with maximum Naïve Bayes ROC =0.819 having a minimum Mean Absolute Error = 0.284, for this time taken to build model=0.05 seconds. Now on the basis of the result of Explorer Interface on data mining technique we can conclude that the Naïve Bayes algorithm have least error, maximum accuracy and takes less time for model development/built and has maximum ROC.
In Table 2 the correctly instances accuracy of the Naïve Bayes is 76.3021 % along with maximum Naïve Bayes ROC =0.819 having a minimum Mean Absolute Error = 0.2841, for this time taken to build model=0.05 seconds. Now on the basis of the result of Explorer Interface on data mining technique we can conclude that the Naïve Bayes algorithm have least error, maximum accuracy and takes less time for model development/built and has maximum ROC. As we know that, we had achieved the same scoring result from the Explorer and Knowledge flow interface, to classify accuracy but to be specific for Naïve Bayes there is approx. change in ROC Value as compared to other because as we said Knowledge flow is an alternative method of Explorer.
IJEDR1602042
International Journal of Engineering Development and Research (www.ijedr.org)248
III.CONCLUSION
With the Help of this WEKA tool effective and efficient execution of the Diabetes data set has been done and in future we can extend this work by using other techniques like Classification, Clustering etc .
REFERENCES
[1] S , Liver Disease Prediction Using Bayesian Classification , Special Issues , 4th National Conference on Advance Computing , Application Technologies, May 2014
[2] SolankiA.V., Data Mining Techniques using WEKA Classification for Sickle Cell Disease, International Journal of Computer Science and Information Technology,5(4): 5857-5860,2014.
[3] Joshi J, Rinal D, Patel J, Diagnosis And Prognosis of Breast Cancer Using Classification Rules, International Journal of Engineering Research and General Science,2(6):315-323, October 2014.
[4] David S. K., Saeb A. T., Al Rubeaan K., Comparative Analysis of Data Mining Tools and Classification Techniques using WEKA in Medical Bioinformatics, Computer Engineering and Intelligent Systems, 4(13):28-38,2013.
[5] Vijayarani, S., Sudha, S., Comparative Analysis of Classification Function Techniques for Heart Disease Prediction, International Journal of Innovative Research in Computer and Communication Engineering, 1(3): 735-741, 2013.
[6] Kumar M. N., Alternating Decision trees for early diagnosis of dengue fever .arXiv preprint arXiv:1305.7331,2013. [7] Durairaj M, Ranjani V, Data mining applications in healthcare sector a study. Int. J. Sci. Technol. Res. IJSTR, 2(10), 2013. [8] Sugandhi C , Ysodha P , Kannan M , Analysis of a Population of Cataract Patient Database in WEKA Tool , International
Journal of Scientific and Engineering Research ,2(10) ,October ,2011.
[9] Yasodha P, Kannan M, Analysis of Population of Diabetic Patient Database in WEKA Tool, International Journal of Science and Engineering Research, 2 (5), May 2011.
[10] Bin Othman M. F , Yau, T. M. S., Comparison of different classification techniques using WEKA for breast cancer, In 3rd Kuala Lumpur International Conference on Biomedical Engineering 2006, Springer Berlin Heidelberg, 520-523,January 2007.
[11] Wikipedia, http://en.m.wikipedia.org/wiki/Dengue_fever, accessed in January 2015.
[12] Wikipedia,http://en.m.wikipedia.org/wiki/weka (machine learning), accessed in January 2015. [13] Waikato, http://www.cs.waikato.ac.nz/ml/weka,accessed in January 2015.