1
Afamin and adropin in patients with alcohol-induced liver cirrhosis
Andrzej Prystupa1, Paweł Kiciński2, Dorota Luchowska-Kocot3, Jarosław Sak4, Tomasz Prystupa5, Ko-Hsin Chen6, Yu-Chieh Chen6, Lech Panasiuk7, Wojciech Załuska8
1Department of Internal Diseases, Medical University of Lublin, Lublin, Poland
2Department of Experimental Hematooncology, Medical University of Lublin, Lublin, Poland 3Department of Medical Chemistry, Medical University of Lublin, Lublin, Poland
4Department of Ethics and Human Philosophy, Medical University of Lublin, Lublin, Poland 5Independent Public Teaching Hospital No 4 in Lublin, Poland
6Students' Scientific Society, Medical University of Lublin, Lublin, Poland
7Department of Internal Diseases and Hypertension, Institute of Rural Medicine, Lublin,
Poland
8Department of Nephrology, Medical University of Lublin, Lublin, Poland
Corresponding author:
2
Abstract
Introduction: Liver cirrhosis develops in about 10% of alcohol abusers. To date, a number of cells and cytokines have been identified, which are involved in induction of liver fibrotic processes. Nevertheless, the pathogenesis of liver cirrhosis has not been fully elucidated. The aim of the present study was to determine serum concentrations of afamin and adropin in patients with alcoholic liver cirrhosis and to define their correlation with the stage of disease.
Materials and methods: The study included 99 patients with alcoholic cirrhosis from the region of Lublin, (Eastern Poland). Liver cirrhosis was diagnosed based on clinical features, history of heavy alcohol consumption, laboratory tests and abdominal ultrasonography. The control group consisted of 20 healthy individuals without liver disease who did not abuse alcohol. The serum afamin and adropin concentrations were determined using ELISA kits.
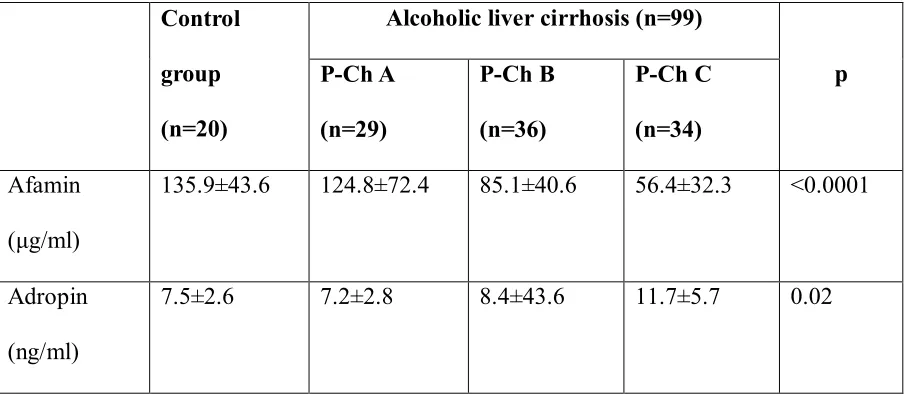
Results: The concentration of afamin was found to be significantly lower in patients with compensated alcoholic liver cirrhosis, i.e. P-Ch B (85.1±40.6 μg/ml) and P-Ch C (56.4±32.3 μg/ml) individuals, as compared to the control group (135.9±43.6 μg/ml); p-value was <0.01 and <0.001, respectively. As far as adropin is concerned, a reverse relationship was demonstrated: the highest concentration was found in patients with P-Ch C (11.7±5.7 ng/ml) cirrhosis. Furthermore, the above concentration was significantly higher compared to patients with P-Ch A cirrhosis (7.2±2.8 ng/ml; p<0.05) and controls (7.5±2.6 ng/ml; p<0.05).
3
Introduction
Chronic alcohol abuse can lead to the development of alcoholic liver disease, chronic pancreatitis and many other ailments. Liver cirrhosis is a relatively common disease; its incidence is estimated at 200-300 per 100 000 individuals. In Poland, the liver cirrhosis-associated mortality increased from 5.14/100 000 in 1980 to 7.6/ 100 000 inhabitants in 2010i.
Three forms of alcoholic livers cirrhosis are distinguished: alcoholic fatty liver, acute alcoholic hepatitis and liver cirrhosis. The factors increasing the risk of alcoholic liver cirrhosis include: the duration of excessive alcohol consumption, female gender, consumption of high-proof alcohol and coexistence of other liver diseases.
Liver cirrhosis develops in about 10% of alcohol abusers. Acetaldehyde is the main metabolite of ethyl alcohol resulting in liver damage. The major process leading to cirrhosis is fibrosis which is associated with imbalance between fibrogenesis and fibrolysisii. To date, a
number of cells and cytokines have been identified, which are involved in induction of liver fibrotic processesiii. Nevertheless, the pathogenesis of liver cirrhosis has not been fully elucidated. Recent studies have demonstrated that metabolic disorders are likely to affect the development of liver cirrhosisiv.
4 The aim of the present study was to determine serum concentrations of afamin and adropin in patients with alcoholic liver cirrhosis and to define their correlation with the stage of disease.
Material and methods
Patients
The study included 99 patients with alcoholic cirrhosis from the region of Lublin, (Eastern Poland). Liver cirrhosis was diagnosed based on clinical features, history of heavy alcohol consumption, laboratory tests and abdominal ultrasonography. The patients with alcoholic hepatitis, hepatocellular carcinoma, viral and autoimmune diseases were excluded from the study. Other exclusions criteria were: type 2 diabetes, obesity, acute infections (e.g., pneumonia, spontaneous bacterial peritonitis), acute and chronic heart failure (> NYHA I), acute and chronic respiratory disorders resulting in respiratory insufficiency, acute kidney injury and chronic kidney disease (> stage G2). Both clinical assessment and laboratory tests were used to exclude the underlying liver diseases in the control group. The degree of liver cirrhosis was evaluated according to the Pugh-Turcotte-Child criteria (Pugh-Child score)viii. Based on them patients were assigned to one of three groups: Pugh-Child (P-Ch) A – 29 with stage A , P-Ch B – 26 with stage B and P-Ch C – 34 with stage C of liver cirrhosis. The control group consisted of 20 healthy individuals without liver disease who did not abuse alcohol. There were no significant age- or gender-related differences in the groups (Table 1). Detailed demographic, clinical and biochemical characteristics of patients are presented in Table 1 and 2.
5 Determination of serum afamin concentration
The afamin concentration was determined using human afamin ELISA kit (BioVendor, Czech Republic) according to the manufacture’s procedure. After the addition of the appropriately diluted samples (100-fold diluted serum), standards and water (blank sample), 60-minute incubation was provided. During incubation, human afamin was bounded to antibodies absorbed to the microwells. After incubation and washing, monoclonal anti-human afamin antibody conjugated with horseradish peroxidase (HRP) was added to the wells and incubated for 60 minutes with captured afamin. After a thorough wash, the remaining conjugate was allowed to react with the substrate solution (TMB). The reaction was stopped by addition of acidic solution. Absorbance of coloured products was measured spectrophotometrically (λ=450 nm) and their concentration was determined using a standard curve prepared for standards. The results were multiplied by a dilution factor (100).
Determination of serum adropin concentration
6 concentration of adropin in the samples was determined using a standard curve constructed for standards. The results were multiplied by a dilution factor (20).
Statistical analysis
STATISTICA 13 (Statsoft, Inc.) was used for data analysis. Continuous variables were expressed as the mean ± standard deviation (SD). Before calculations, variables were checked for normality using the Shapiro-Wilk test; the Brown-Forsythe`s test was applied to test equality of variances. To compare the results between more than two groups, one-way ANOVA test was used. The Tukey`s test was applied for detailed identification of statistically different groups. Correlations among variables were performed using the Pearson’s correlation test. Stepwise multiple linear regression analysis was applied to determine the potential independent influence of various factors on afamin and adropin concentrations. Qualitative variables are shown as indicators of structure (percentage); for intergroup comparisons the χ2 test was used. Receiver-operators characteristic (ROC) curves were used
to assess diagnostic accuracy of afamin and adropin. For all tests, p< 0.05 was considered as statistically significant.
Results
7 As far as adropin is concerned, a reverse relationship was demonstrated: the highest concentration was found in patients with P-Ch C (11.7±5.7 ng/ml) cirrhosis. Furthermore, the above concentration was significantly higher compared to patients with P-Ch A cirrhosis (7.2±2.8 ng/ml; p<0.05) and controls (7.5±2.6 ng/ml; p<0.05) (Figure 1B).
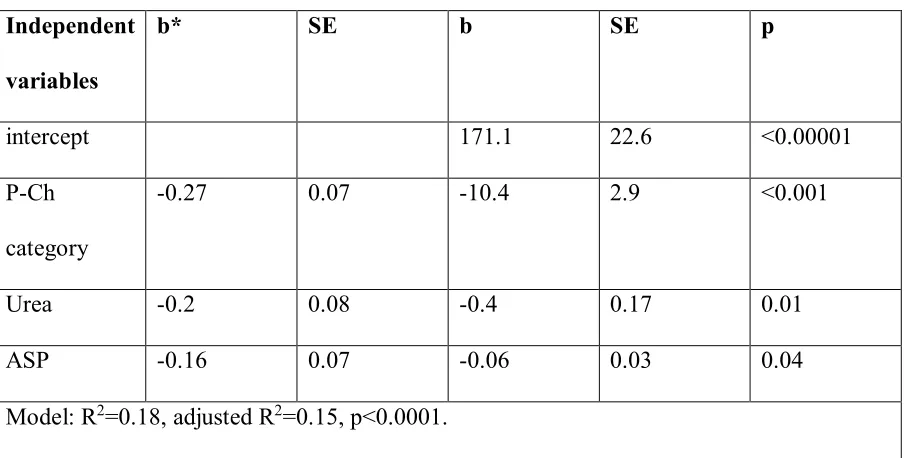
To evaluate the independent effects of various variables on the concentration of afamin and adropin, a multiple linear regression analysis was performed. The following variables were used: stage of disease according to the P-Ch classification and the additional laboratory parameters outside this classification. The factors independently associated with serum concentrations of afamin were found to be: stage of liver cirrhosis according to the P-Ch score (the highest relative effect on the variability of afamin concentration), activity of ASP and concentration of urea. This model accounted only for 15% of variability of an independent variable albeit was optimal under given conditions (Table 4).
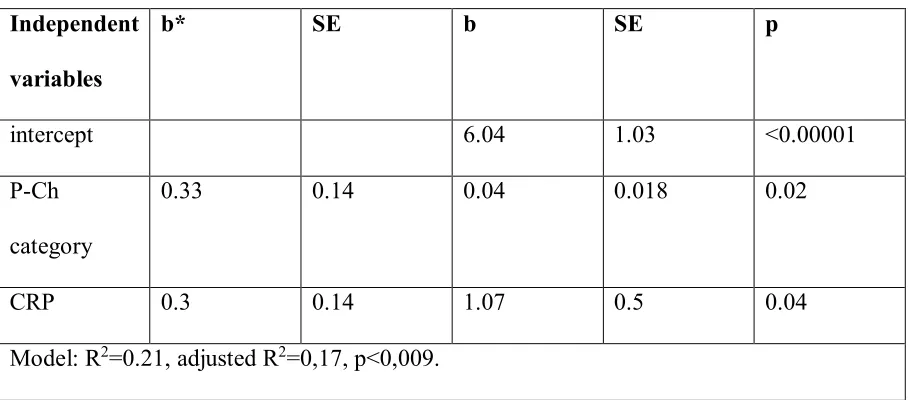
In the case of adropin, the regression model contained only two independent variables: stage of cirrhosis according to the P-Ch score and concentration of CRP. The model accounted for 17% of variability of serum adropin concentration and the highest relative effect on this variability was attributable to the stage of disease according to the P-Ch score (Table 5).
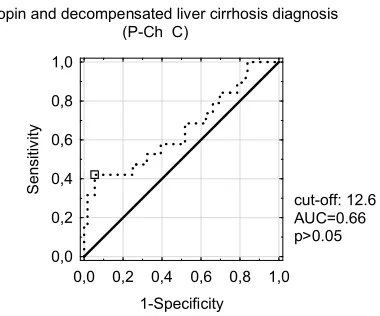
Receiver-operators characteristic (ROC) curves used for diagnostic accuracy of afamin and adropin are given in Figure 2.
Discussion
8 similar to an albumin and which acts as a protein transporting vitamin E in plasma ix. Afamin circulating in plasma is primarily produced in the liverx.
Recent studies have proven that afamin is involved in the development of metabolic disorders. In the study involving > 20 000 patients, a strong correlation, independent of other metabolic risk factors, has been demonstrated between the concentration of afamin versus the concentration of insulin and type 2 diabetes mellitusxi.
The studies in patients with ovarian cancer and stomach cancer have demonstrated significantly reduced levels of afaminxii. Moreover, the concentration of afamin was found to be significantly decreased in patients with sepsis and pneumoniaxiii. Otherwise, no changes in
concentrations of afamin were observed in patients with chronic obstructive pulmonary disease (COPD) and chronic renal disease. In cases of heart failure, concentrations of afamin were only slightly reduced [Dieplinger 2015]. According to literature data, the concentration of afamin has been reversely correlated with the concentration of C-reactive protein (CRP) and of interleukin-6xiv. Therefore, afamin is considered a negative acute phase protein.
9 damaged due to increased inflammatory and pro-oxidative processes, which characterise advanced liver cirrhosisxv.
The second protein analysed in our study was adropin. Adropin is a factor involved in regulation of homeostasis of carbohydrates and lipids and is associated with energy homeostasis of the bodyxvi. Adropin protects against fatty liver and obesity-related hyperinsulinaemia and is a factor regulating lipogenesis - affecting the gene expression in the liver and peroxisome proliferator-acivated receptor gamma in the adipose tissue [Kumar 2008].
Adropin is produced not only in the liver but also in the pancreas and brainxvii [Kumar
2008]. Its concentration can change in various pathological conditions. The available data regarding the role of adropin and relationships with the development with metabolic diseases, are inconsistent. Reduced levels of adropin have been observed in obesity-associated insulin resistance, gestational diabetes, nonalcoholic fatty liver disease (NAFLD), acute myocardial infarction and endothelial dysfunction [Marczuk]. Sayin et al. have demonstrated that low adropin concentrations were associated with the risk of NAFLDxviii. It should be stressed, however, that their study involved children and not adults. However, existing data are conflicting. Increased adropin concentrations have been found in patients with heart failure, type 2 diabetes and diabetic nephropathyxix, xx.
10 Considering the complex nature of metabolic disorders in compensated liver cirrhosis, it cannot be excluded that elevated adropin concentrations noted in our study resulted from feedback mechanisms leading to increased extra-hepatic synthesis.
Receiver-operator characteristic (ROC) curves showed that adropin is not a valuable diagnostic marker for alcoholic cirrhosis. On the other hand, afamin is characterized by relatively high specificity but low sensitivity (Figure 2). It may result in false positive results therefore its clinical utility requires further investigations.
Our study had several limitations. Firstly, this was a single-centre study and the sample size was insufficient to come to final conclusions. Therefore, further prospective studies in a large population are needed. Moreover, it should be emphasised that multi-factorial models accounted only for a small part of variability (<20%) of plasma concentrations of afamin and adropin; therefore, some other factors potentially affecting their concentrations should be search for. Our study did not involve patients with other than alcoholic liver cirrhosis; thus, it cannot be determined whether the observed relationships also regard some other group of patients.
Conclusions
The concentration of afamin decreases with the severity of alcoholic liver cirrhosis, which most likely results from impaired hepatic synthesis. Otherwise, the higher the stage of disease according to the Child-Pugh score, the higher the concentration of adropin. Further prospective studies are required to explain the role of both these proteins in alcoholic liver cirrhosis.
11 Authors thank Anna Misiuna M.A., who provided medical writing services on behalf of Medical University of Lublin, Poland.
Conflicts of Interest
The authors declare no conflicts of interest.
TABLES & FIGURES
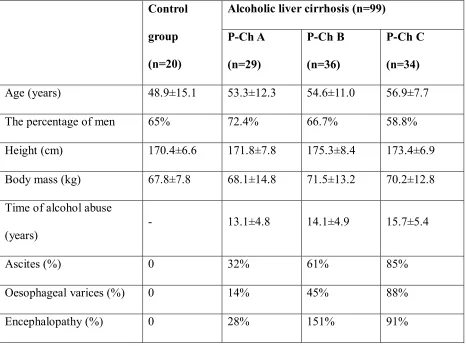
Table 1. Demographic and clinical characteristics of study and control groups.
Control
group
(n=20)
Alcoholic liver cirrhosis (n=99)
P-Ch A
(n=29)
P-Ch B
(n=36)
P-Ch C
(n=34)
Age (years) 48.9±15.1 53.3±12.3 54.6±11.0 56.9±7.7
The percentage of men 65% 72.4% 66.7% 58.8%
Height (cm) 170.4±6.6 171.8±7.8 175.3±8.4 173.4±6.9
Body mass (kg) 67.8±7.8 68.1±14.8 71.5±13.2 70.2±12.8 Time of alcohol abuse
(years)
- 13.1±4.8 14.1±4.9 15.7±5.4
Ascites (%) 0 32% 61% 85%
Oesophageal varices (%) 0 14% 45% 88%
12
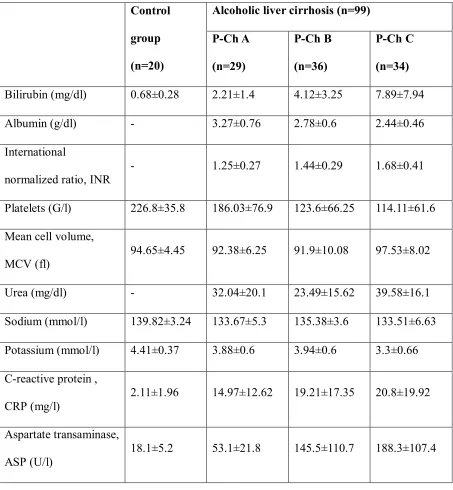
Table 2. Biochemical characteristics of study and control groups.
Control
group
(n=20)
Alcoholic liver cirrhosis (n=99)
P-Ch A
(n=29)
P-Ch B
(n=36)
P-Ch C
(n=34)
Bilirubin (mg/dl) 0.68±0.28 2.21±1.4 4.12±3.25 7.89±7.94
Albumin (g/dl) - 3.27±0.76 2.78±0.6 2.44±0.46
International
normalized ratio, INR
- 1.25±0.27 1.44±0.29 1.68±0.41
Platelets (G/l) 226.8±35.8 186.03±76.9 123.6±66.25 114.11±61.6
Mean cell volume, MCV (fl)
94.65±4.45 92.38±6.25 91.9±10.08 97.53±8.02
Urea (mg/dl) - 32.04±20.1 23.49±15.62 39.58±16.1
Sodium (mmol/l) 139.82±3.24 133.67±5.3 135.38±3.6 133.51±6.63
Potassium (mmol/l) 4.41±0.37 3.88±0.6 3.94±0.6 3.3±0.66
C-reactive protein , CRP (mg/l)
2.11±1.96 14.97±12.62 19.21±17.35 20.8±19.92
Aspartate transaminase, ASP (U/l)
13
Table 3. Afamin and adropin in cirrhotic patients and controls.
Control
group
(n=20)
Alcoholic liver cirrhosis (n=99)
p P-Ch A
(n=29)
P-Ch B
(n=36)
P-Ch C
(n=34)
Afamin (μg/ml)
135.9±43.6 124.8±72.4 85.1±40.6 56.4±32.3 <0.0001
Adropin (ng/ml)
14
Table 4. Factors influencing afamin concentration – multiple linear regression analysis
Independent
variables
b* SE b SE p
intercept 171.1 22.6 <0.00001
P-Ch category
-0.27 0.07 -10.4 2.9 <0.001
Urea -0.2 0.08 -0.4 0.17 0.01
ASP -0.16 0.07 -0.06 0.03 0.04
Model: R2=0.18, adjusted R2=0.15, p<0.0001.
15
Table 5. Factors influencing adropin concentration – multiple linear regression analysis.
Independent
variables
b* SE b SE p
intercept 6.04 1.03 <0.00001
P-Ch category
0.33 0.14 0.04 0.018 0.02
CRP 0.3 0.14 1.07 0.5 0.04
Model: R2=0.21, adjusted R2=0,17, p<0,009.
16
Figure 1. Afamin (A) and adropin (B) concentrations in patients with liver cirrhosis and controls.
A B C Controls
Pugh-Child category 20 40 60 80 100 120 140 160 180 A fa m in [ µ g /m l]
A B C controls
Pugh-Child category 5 6 7 8 9 10 11 12 13 14 A d ro p in [ n g /m l] Mean Mean±SE Mean±1.96*SE
*
**
**
Tukey`s test: * p<0.01 ** p<0.001*
*
Tukey`s test: * p<0.05
17
Figure 2. Receiver-operator characteristic (ROC) curves for diagnostic accuracy of afamin and adropin.
Adropin and liver cirrhosis diagnosis (P-Ch A-C)
10,492
0,0 0,2 0,4 0,6 0,8 1,0 1-specificity 0,0 0,2 0,4 0,6 0,8 1,0 s e n s iti v ity
Adropin and decompensated liver cirrhosis diagnosis (P-Ch C)
12,619
0,0 0,2 0,4 0,6 0,8 1,0 1-Specificity 0,0 0,2 0,4 0,6 0,8 1,0 S e n s iti v ity
Afamin and decompensated liver cirrhosis diagnosis (P-Ch C)
28,2
0,0 0,2 0,4 0,6 0,8 1,0 1-Specificity 0,0 0,2 0,4 0,6 0,8 1,0 S e n s iti v ity
Afamin and liver cirrhosis diagnosis (P-Ch A-C)
89,5
18
References
i Mokdad A, Lopez A, Shahraz S, et al. Liver cirrhosis mortality in 187 countries between
1980 and 2010: a systematic analysis. BMC Medicine 2014; 12: 145.
ii Seth, D.; D’Souza El-Guindy, N.B.; Apte, M.; Mari, M.; Dooley, S.; Neuman, M.; Haber,
P.S. Alcohol, signaling, and ECM turnover. Alcohol Clin. Exp. Res. 2010, 34, 4–18.
iii Zhou W-C, Zhang Q-B, Qiao L. Pathogenesis of liver cirrhosis. World J Gastroenterol.
2014; 20(23): 7312–7324.
iv Ishii H, Horie Y, Yamagshi Y, Ebinuma H. Alcoholic Liver Disease and Its Relationship
with Metabolic Syndrome. JMAJ 53(4): 236–242, 2010.
vv Seeber B, Morandell E, Lunger F, Wildt L, Dieplinger H. Afamin serum concentrations are
associated with insulin resistance and metabolic syndrome in polycystic ovary syndrome. Reproductive Biology and Endocrinology 2014, 12:88
vi Kronenberg F, Kollerits B, Kiechl S, Lamina C, Kedenko L, Meisinger C, Willeit J, Huth C,
Wietzorrek G, Altmann ME, Thorand B, Melmer A, Dähnhardt D, Santer P, Rathmann W, Paulweber B, Koenig W, Peters A, Adham IM, Dieplinger H: Plasma concentrations of afamin are associated with the prevalence and development of metabolic syndrome. Circ Cardiovasc Genet 2014, doi:10.1161/CIRCGENETICS.113.000654.
vii Marczuk N, Cecerska-Heryć E, Jesionowska A, Dołęgowska B. Adropin – physiological
and pathophysiological role. Postepy Hig Med Dosw (online), 2016; 70: 981-988
viii Pugh R, Murray-Lyon I, Dawson J, Pietroni M et al. Transection of the oesophagus for
19
ix H.S. Lichenstein, D.E. Lyons, M.M. Wurfel, et al.Afamin is a new member of the albumin,
a-fetoprotein, and vitamin D-binding protein gene family. J Biol Chem, 269 (1994), pp. 18149-18154
x Dieplinger H, Dieplinger B. Afamin--A pleiotropic glycoprotein involved in various disease
states. Clin Chim Acta. 2015 Jun 15;446:105-10. doi: 10.1016/j.cca.2015.04.010.
xi Kollerits B, Lamina C, Huth C, Marques-Vidal P, Kiechl S, Seppälä I, Cooper J, Hunt S,
Meisinger C, Herder C et al. Plasma Concentrations of Afamin Are Associated With Prevalent and Incident Type 2 Diabetes: A Pooled Analysis in More Than 20,000 Individuals. Diabetes Care 2017 Aug; dc170201. https://doi.org/10.2337/dc17-0201
xii H. Dieplinger, D.P. Ankerst, A. Burges, et al.Afamin and apolipoprotein A-IV: novel
protein markers for ovarian cancer. Cancer Epidemiol Biomarkers Prev, 18 (2009), pp. 1127-1133
xiii Dieplinger B, Egger M, Gabriel C, Poelz W, Morandell E, Seeber B, Kronenberg F,
Haltmayer M, Mueller T, Dieplinger H. Analytical characterization and clinical evaluation of an enzyme-linked immunosorbent assay for measurement of afamin in human plasma. Clin Chim Acta. 2013 Oct 21;425:236-41. doi: 10.1016/j.cca.2013.08.016.
xiv B. Dieplinger, M. Egger, C. Gabriel, et al. Analytical characterization and clinical
evaluation of an enzyme-linked immunosorbent assay for measurement of afamin in human plasma. Clin Chim Acta, 425 (2013), pp. 236-241
xv Lee JS. Albumin for End-Stage Liver Disease. The Korean Journal of Internal Medicine.
2012;27(1):13-19. doi:10.3904/kjim.2012.27.1.13.
xvi Kumar KG, Trevaskis J, Lam D, Sutton G, Koza R, Chouljenko V, Kousoulas K, Rogers P,
Kesterson R, Thearle M et al. Identification of Adropin as a Secreted Factor Linking Dietary Macronutrient Intake with Energy Homeostasis and Lipid Metabolism. Cell Metabolism 8, 468–481, December 3, 2008.
xvii Aydin S. Three new players in energy regulation: preptin, adropin and irisin. Peptides.
2014 Jun;56:94-110. doi: 10.1016/j.peptides.2014.03.021.
xviii Sayın, O., Tokgöz, Y. & Arslan, N. (2014). Investigation of adropin and leptin levels in
pediatric obesity-related nonalcoholic fatty liver disease. Journal of Pediatric Endocrinology and Metabolism, 27(5-6), pp. 479-484.doi:10.1515/jpem-2013-0296
xix Lian W, Gu X, Qin Y, Zheng X. Elevated Plasma Levels of Adropin in Heart Failure
20
xx Hu W, Chen L. Association of Serum Adropin Concentrations with Diabetic Nephropathy.