Comparative evaluation and implementation of
various kernel techniques for nonlinear data
classification in support vector machine.
Vivek verma1 ,Ram nivas giri2
1
.(Research scholar) 2.(Asst. professor) 1,2
Department of computer science Raipur institute of technology
Raipur ,India
Abstract—Data Mining is knowledge discovery process in
database designed to extract data from a dataset and transforms it in to desired data. data processing action is similarly acclimated in get of constant patterns and/or analytical relationships amid variables, and a new to validate the accusation by applying the detected patterns to new subsets of knowledge. Data categoryification is one in every of the info mining technique to map great amount of data set in to applicable class. Data categoryification is reasonably supervised learning that is employed to predict class for information input, wherever categories are predefined.Supervised learning is that part of automatic learning which focuses on modeling input/output relationship the goal of supervised learning is to identify an optimal mapping from input variables to some output variables, which is based on a sample of observations of the values of the variables. Data classification technique includes various application like handwriting recognition, speech recognition, iris matching, text classification, computer vision, drug design etc. objective of this paper is to survey major techniques of data classification. Several major classification techniques are Artificial neural network, decision trees, k-nearest neighbor(KNN), support vector machine, navie-bayesian classifier, etc .in this paper we make comparison of various kernel techniques and a user define kernel technique in svm for nonlinear data classification, which is applicable to general data including, in particular, imagery and other types of high-dimensional data.
Keywords—data mining; data classification; decision tree; support vector machine; KNN; kernel;
I.INTRODUCTION
Data classification [2]is kind of searching/deriving such kind
of function which map data set D ={t1,t2…..,tn} to set of
classes C= {c1,c2,c3…..cn} DC. data classification is kind
of supervised learning since we have to train our classification model in supervised manner in training phase we give information about predefine classes. However there are various methods available for data classification .but in this paper we throughout talk about only support vector machine and its variants for data classification techniquein machine learning, support vector machines square measure supervised learning models with associated learning algorithms that analyze information and acknowledge patterns, used for classification and multivariate analysis. Given a group of training examples, every marked as
happiness to at least one of two classes, An SVM training algorithmic program builds a model that assigns new examples into one class or the opposite, creating it a non-probabilistic binary linear classifier. An SVM model may be a illustration of the examples as points in space, mapped in order that the samples of the separate classes square measure divided by a transparent gap that's as wide as doable. New examples square measure then mapped into that very same space and expected to belong to a class supported that facet of the gap they fall on.
The original SVM algorithmic program was fictional by Vladimir N. Vapnik and Alexey Ya. Chervonenkis in 1963. In 1992, Bernhard E. Boser, Isabelle M. Guyon and Vladimir N. Vapnik steered the way to form nonlinear classifiers by applying the kernel trick to maximum-margin hyperplanes.[3] the present commonplace incarnation (soft margin) was projected by Corinna Cortes and Vapnik in 1993 and revealed in 1995.[1][14]
There are huge amount of literature available and research is still going on in the area of support vector machine .in the year of 2006 Yakoub Bazi, Student Member, IEEE, and Farid Melgani, Senior Member, IEEE presents” Toward an Optimal SVM Classification System for Hyperspectral Remote Sensing Images”[4] in this paper
they present an optimal SVM classification system for hyperspectral imagery has been presented. This system allows to detect the best discriminative features (without requiring their number to be set a priori by the user) and to estimate the best SVM parameters in a fully automatic way by means of a genetic optimization framework. In the year of 2007 Xiaoou Li, Jair Cervantes, and Wen Yu presents” Two-Stage SVM Classification for Large Data Sets via Randomly Reducing and Recovering Training Data”[5]in
this paper they present A random selection method and a two stage SVM classification approach for large data sets are proposed in this work.in the year of 2008 A. Mathur and G. M. Foody, Member, IEEE presents “Multiclass and Binary SVM Classification: Implications for Training and Classification Users”[6]in this paper the potential of
set. In the year of 2009 Begüm Demir,and Sarp Ertürk presents” Improving svm classification accuracy using a hierarchical approach for hyperspectral images”[7]in this
paper they found that a novel hierarchical classification approach which improves SVM classification accuracy and reduces computational time of SVM classification.in the year of 2012 Mahesh Pal and Giles M. Foody, Senior Member, IEEE “Evaluation of SVM, RVM and SMLR for Accurate Image Classification With Limited Ground Data”[8] in this paper they found that The potential of
SVM for accurate classification from small training sets has been established . Other classifiers such as RVM and SMLR, however, offer additional features, such as information on per-case classification uncertainty that may sometimes be useful. Here, it has been shown that the RVM and SMLR are able to classify data to similar accuracies to the SVM. in the year of 2013 YANG Banghua,HAN Zhijun,WANG Qian, HE Liangfei “A new classification method based on KF-SVM in Brain Computer Interfaces”[9] in this paper they found that a new
classification method combining the kernel fisher, and the SVM.in the year of 2014 Jie Xu, Yuan Yan Tang, Fellow, IEEE, Bin Zou, Zongben Xu, Luoqing Li, and Yang Lu presents” The Generalization Ability of Online SVM Classification Based on Markov Sampling”[10] in this paper they presents Online classification algorithm is one of the most widely used machine learning algorithms for classification problems, in particular for large size of training samples. In the year of 2014 Yue Shen, Hongqi Feng, Qiang Wang Member IEEE, Yipeng Liu, Zhi he presents “ QWT Enhanced SVM for Hyperspectral Image Classification” [11] in this paper they found that an
improved classification method based on QWT and SVM. We use QWT algorithm on the original mages to generate suitable features in efficiency and then combine SVM algorithm for further classification process. In the year of 2014 Jair Cervantes1, Xiaoou Li2, Wen Yu3 “SVM Classification for Large Data Sets by Considering Models of Classes Distribution”[12] in this paper they found that a
fast and efficient classification method called SMO+MCD algorithm for large data sets based on extraction of models of classes distribution. Its performance has been compared with other methods for large data sets such as LibSVM and Simple SVM algorithms.
Rest of the paper organized in such a way that section 2 describe data classification using support vector machine section 3 represents various kernel technique for nonlinear data classification. section 4 compares various data kernel techniques and discuss the result.at last section 4 is conclusion part of the paper.
II.SUPPORT VECTOR MACHINE
More formally, a support vector machine[12]constructs a
hyperplane or set of hyper planes in a very high- or infinite-dimensional space, which might be used for classification, regression, or different tasks. A Support Vector Machine (SVM) could be a discriminative classifier formally outlined by a separating hyperplane. In alternative words, given labeled training data , the algorithm outputs an optimal hyperplane that categorizes new examples. In
that sense is the hyperplane obtained optimal? Let’s
contemplate
thesubsequent straightforward
problem: For a linearly separable set of 2D-points which relates to one of two classes, finding a separating straight line is one of the major task .
Figure 1: separating data set using perfect straight line
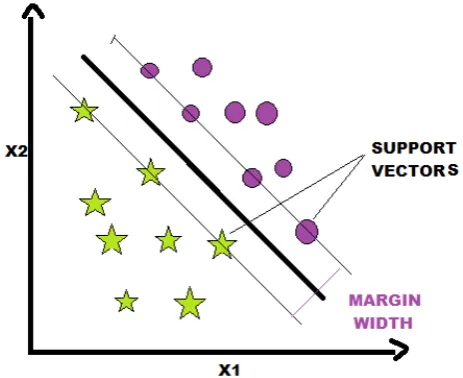
Intuitively, an honest separation is achieved by the hyperplane that has the biggest distance to the closest training-data purpose of any category (so-called purposeful margin), since generally the larger the margin the lower the generalization error of the classifier. A Support Vector Machine (SVM) performs classification by finding the hyperplane that maximizes the margin between the two classes. The vectors (cases) that define the hyper plane are support vectors. we can use a support vector machine (SVM) if dataset having two classes. Since SVM can classify dataset in only two classes. An SVM classifies data by finding the the simplest & best hyperplane that separates all data points of one class from those of the opposite class. The optimum hyperplane[13][28] for an SVM
suggest that the one with the biggest margin between the two classes. Margin suggest that the peak width of the block parallel to the hyperplane that has no interior data points
Let’s introduce the notation used to accustomed outline formally a hyperplane:
--1 where is known as the weight vector and as the bias.The optimum hyperplane are often diagrammatical in
an infinite variety of various ways in which by scaling of and . As a matter of convention, among all the possible representations of the hyperplane, the one chosen is
--2 where symbolizes the training examples nearest to the hyperplane. In general, the training examples that square measure nearest to the hyperplane square measure referred to as support vectors. illustration is thought because the canonical hyperplane we tend to use the results of geometry offers the space between some extent and a
hyperplane :
3 In particular, for the canonical hyperplane, the numerator is
equal to one and the distance to the support vectors is
here margin is denoted as , is twice the distance to the closest examples:
Finally, the problem of maximizing is reminiscent of the problem of minimizing a function subject to some constraints. The constraints model the necessity for the hyperplane to classify properly all the training examples . Formally,
where represents every of the labels of the training examples.This is a problem of Lagrangian optimization
that may be solved exploitation
Lagrange multipliersto get the weight vector and the bias of the best hyperplane.
III. BINARY CLASSIFICATION(LINEAR SVM)
Suppose that we have a two-class dataset , and we wish to train a classifier to predict the class labels of future data points. This is known as a "binary classification" problem, and can be cast as "Yes"/"No" questions . a support vector machine (SVM)[12][16] once dataset having
specifically two classes. An SVM classifies data by finding the most effective hyperplane that separates all data points of one class from those of the opposite class. the most effective hyperplane for an SVM suggests that the one with the biggest margin between the two classes. Margin suggests that the supreme breadth of the block parallel to the hyperplane that has no interior data points. The support vectors area unit the info points that area unit
nighest to the separating hyperplane; these points area unit on the boundary of the block
. The following figure illustrates these definitions, with + indicating data points of type 1, and – indicating data points of type –1.
Figure 3: A two-class, linearly separable dataset.
IV
ALINEARLY NONSEPARABLE DATASETData won't yield a separating hyperplane. therein case, SVM will use a soft margin, which means a hyperplane that separates several, however not all data points.Sometime we found nonlinear pattern in the data i.e. classes are not linearly separable, classes may not be separable by linear boundry.
Figure 4:nonlinear separable data [18]
We use kernel trick for nonlinear separable data to classify them
The Kernel Trick [19]The basic idea of the so called
kernel-methods is to first preprocess the data by some non-linear mapping and then to apply the same linear algorithm as before but in the image space of . More formally we apply the mapping
to the data and consider our algorithm in instead of , i.e. the sample is preprocessed as
Figure 5:imposing nonlinear data set into kernel function
IV
KERNEL FUNCTIONA Kernel function is a function
that obeys sure mathematical properties. I will not come in these properties straight away, except for currently consider a kernel as a function that computes a scalar product between , , .
Kernel methods [19]are a class of algorithms for pattern
analysis or recognition, whose best known element is the support vector machine (SVM). The general task of pattern analysis is to search out and study general types of relations (such as clusters, rankings, principal components, correlations, classifications) in general types of data (such as sequences, text documents, sets of points, vectors, images, graphs, etc). The most characteristic of Kernel strategies, however, is their distinct approach to the current downside Kernel strategies map the information into higher dimensional areas within the hope that during this higher-dimensional area the information might become a lot of simply separated or higher structured. There are also no constraints on the shape of this mapping, that might even cause infinite-dimensional spaces. This mapping function, however, hardly has to be computed due to a tool known as the kernel trick..
The Kernel trick[19] may be a terribly fascinating
and powerful tool. it's powerful as a result of it provides a bridge from one-dimensionality to non-linearity to any algorithmic program that may expressed entirely on terms of dot product between two vectors. It comes from the very fact that, if we tend to first map our input data into a higher-dimensional space, a linear algorithm operating in this space will behave non-linearly in the original input spa within the original input area . Now, the Kernel trick is really interesting because that mapping doesn't got to be ever computed. If our algorithmic program is expressed solely in terms of a scalar product between two vectors,,
all we want is replace this
inner product with theinner
product from another appropriate
space.that's
wherever resides the “trick”: where
a dot product isused, it is replaced with a Kernel function. The kernel function denotes an inner product in feature space and is usually denoted as:
K(x,y) = <φ(x),φ(y)>
V.
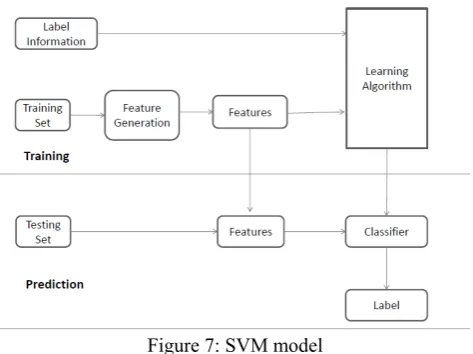
METHODOLOGY & ALGORITHMGiven a set of training data points along with associated training labels, determine the class label for an unlabeled test instance.
Numerous variations of this problem can be defined over different settings. Excellent overviews on data classification may be found in. Classification algorithms typically contain two phases:
• Training Phase: In this phase, a model is constructed
from the training instances.
• Testing Phase:In this phase, the model is used to assign
a label to an unlabeled test instance. In some cases, such as lazy learning, the training phase is omitted entirely, and the classification is performed directly from the relationship of the training instances to the test instance. Instance-based methods such as the nearest neighbor classifiers are examples of such a scenario. Even in such cases, a pre-processing phase such as a nearest neighbor index construction may be performed in order to ensure efficiency during the testing phase.
Figure 7: SVM model
There are three general steps for any classifier algorithm to classify data.
Step 1: Using a learning algorithm to extract rules from (create a model of) the training data. The training data are pre classified examples (class label is known for each example).
Step 2: Evaluate the rules on test data. Usually split known data into training sample and test sample.
Step 3: Apply the rules to (classify) new data (examples with unknown class labels).
Goals:
o create a model of data, explain or better understand data.
o predict the class label of (classify) new examples.
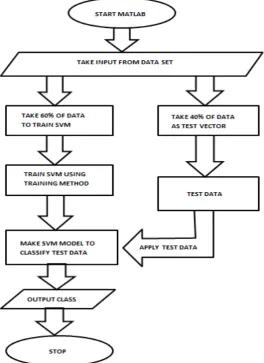
Figure 8: flow chart of non linear data classification
ALGORITHM: NONLINEAR DATA CLASSIFICATION USING SVM
1.Input:A data matrix of training examples A =[x1,x2,…,xn] a vector of class labels for the training
examples y =[y1,y2..yn]_, where yk = {1,2..M}, k = 1…n, a test example x Rp, and a selected kernel. 2.pass training data and selected kernel into svmtrain function
3.Estimate the class label for x using svmclassify function
4.output: estimated lable for x
V.
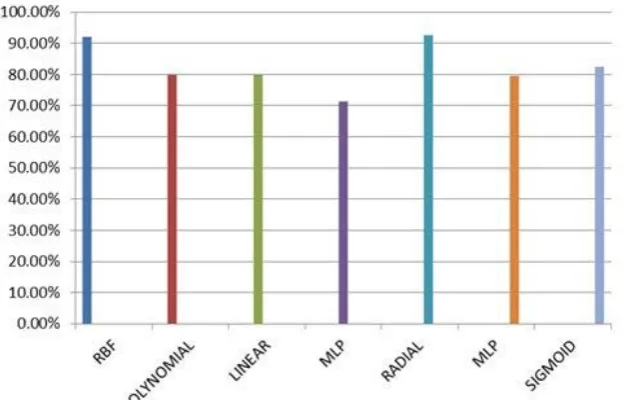
RESULTResult related to non-linear data classification has been depicted in tabular form in table 1 table shows average efficiency of various kernel function while applying various data sets (described in section) in non -linear classification model. the efficiency of various kernel function depicted clearly in graph-7 ,graph has been plotted between average efficiency & corresponding kernel.The
efficiency of any classification algorithm is based on how efficiently or effectively it classify the data set. Here we have calculated efficiency of SUPPORT VECTOR MACHINE using various predefine kernel and user define kernel . taking randomly selected data set.and data set is randomly selected from uci dataset.( http://archive.ics.uci.edu)
Table No.1 Result Analysis
DATASET/kernels rbf polynomial Linear quadratic Radial Mlp sigmoid
Wine 100% 86% 93.33% 73.33% 100% 86% 96.66%
Glass 98.92 93.45 92.43% 94.62% 98.92% 69.89% 69.89%
note authenticity 100% 100% 100% 62% 100% 77% 76%
Blood donation 86% 99% 100% 100% 86% 90% 90%
climate 100% 100% 100% 100% 100% 91% 97%
Diabeties 67% -- 79% -- 70% 64% 63%
Figure 7:graph plot between kernel efficiency & kernel function
VI.
CONCLUSIONIn this paper we have introduces nonlinear data classification using kernel trick in SVM. As per our need we can make our own kernel function beside given predefine kernel(rbf, polynomial, linear, quadratic etc) here we have chosen sigmoi function as kernel .& the classification result slightly changes from one dataset to another .i.e. the efficiency of kernel function function what we have chosen for classification is dependenon data set.But still it is difficult to recommend any one technique as superior to others as the choice of a dataset. Finally, there is no single kernel function is best for all kind of dataset. Classification algorithms are specific in their problem domain.
REFERENCES
[1] Cortes, C.; Vapnik, V. (1995). "Support-vector networks". Machine Learning 20 (3): 273. doi:10.1007/BF00994018. editJ. Clerk Maxwell, A Treatise on Electricity and Magnetism, 3rd ed., vol. 2. Oxford: Clarendon, 1892, pp.68–73.
[2] Smitha .T, V. Sundaram ―Comparative Study Of Data Mining Algorithms For High Dimensional Data Analysisǁ International Journal Of Advances In Engineering & Technology, Sept 2012.IJAET ISSN: 2231-1963.
[3] Yakoub Bazi, Student Member, IEEE, and Farid Melgani, Senior Member, IEEE “Toward an Optimal SVM Classification System forHyperspectral Remote Sensing Images” JIEEE TRANSACTIONS ON GEOSCIENCE AND REMOTE SENSING, VOL. 44, NO. 11, NOVEMBER 2006
[4] Xiaoou Li, Jair Cervantes, and Wen Yu” Two-Stage SVM Classification for Large Data Sets via Randomly Reducingand Recovering Training Data” 1-4244-0991-8/07/$25.00/©2007 IEEE. [5] A. Mathur and G. M. Foody, Member, IEEE” Multiclass and Binary
SVM Classification:Implications for Training and Classification Users” IEEE GEOSCIENCE AND REMOTE SENSING LETTERS, VOL. 5, NO. 2, APRIL 2008.
[6] Begüm Demir,and Sarp Ertürk” IMPROVING SVM CLASSIFICATION ACCURACY A HIERARCHICAL APPROACH FOR HYPERSPECTRAL IMAGES” 978-1-4244-5654-3/09/$26.00 ©2009 IEEE
[7] Mahesh Pal and Giles M. Foody, Senior Member, IEEE” Evaluation of SVM, RVM and SMLR for Accurate Image Classification With Limited Ground Data” IEEE JOURNAL OF SELECTED TOPICS IN APPLIED EARTH OBSERVATIONS AND REMOTE SENSING, VOL. 5, NO. 5, OCTOBER 2012.
[8] YANG Banghua,HAN Zhijun,WANG Qian,HE Liangfei” A new
classification method based on KF-SVM in Brain
ComputerInterfaces” 2013 Sixth International Symposium on Computational Intelligence and Design.
[9] Jie Xu, Yuan Yan Tang, Fellow, IEEE, Bin Zou, Zongben Xu,
Luoqing Li, and Yang Lu” The Generalization Ability of Online SVMClassification Based on Markov Sampling” IEEE TRANSACTIONS ON NEURAL NETWORKS AND LEARNING SYSTEMS.
[10] Yue Shen1, Hongqi Feng2, Qiang Wang1 Member IEEE, Yipeng Liu1, Zhi he1” QWT Enhanced SVM for Hyperspectral Image” 978-1-4673-6386-0/14/$31.00 ©2014 IEEE Classification”
[11] Jair Cervantes1, Xiaoou Li2, Wen Yu3” SVM Classification for Large Data Sets by Considering Models of Classes Distribution” Sixth Mexican International Conference on Artificial Intelligence,Special Session.
[12] air Cervantes1, Xiaoou Li2, Wen Yu3.—― SVM Classification for Large Data Sets by Considering Models of Classes Distributionǁ IEEE TRANSACTIONS ON NEURAL NETWORKS AND LEARNING SYSTEMS 2014
[13] Mark A. Davenport, Student Member, IEEE, Richard G. Baraniuk, Fellow, IEEE, and Clayton D. Scott, Member, IEEE,―Tuning Support Vector Machines for Minimax and Neyman-Pearson Classificationǁ. Cambridge, MA USA: Cambridge Univ. Press, 2010.
[14] V. N. Vapnik, Statistical Learning Theory. New York, NY, USA:
Wiley,1998
[15] I. Steinwart and A. Christmann, Support Vector Machines. New York,NY, USA: Springer-Verlag, 2008.
[16] D.-R. Chen, Q. Wu, Y. Ying, and D.-X. Zhou, “Support vector machinesoft margin classifiers: Error analysis,” J. Mach. Learn. Res., vol. 5,
[17] J. A. Gualtieri and S. Chettri, “Support vector machines for classificationof hyperspectral data,” in Proc. IGARSS, 2000, pp. 813–815
[18] Chang, Yin-Wen; Hsieh, Cho-Jui; Chang, Kai-Wei; Ringgaard, Michael; Lin, Chih-Jen (2010). "Training and testing low-degree polynomial data mappings via linear SVM". Journal of Machine Learning Research 11: 1471–1490.
[19] Hofmann, Thomas; Scholkopf, Bernhard; Smola, Alexander J. (2008). "Kernel Methods in Machine Learning"pp. 1143–1175, Apr. 2004.
[20] I. Steinwart and A. Christmann, Support Vector Machines. New York,NY, USA: Springer-Verlag, 2008.
[21] Mohri, Mehryar; Rostamizadeh, Afshin; Talwalkar, Ameet (2012). Foundations of Machine Learning. The MIT Press. ISBN 9780262018258.
[22] Rasmussen, C. E.; Williams, C. K. I. (2006). "Gaussian Processes for Machine Learning".
[24] Williams, C.K.I. and Seeger, M. (2001). "Using the Nyström method to speed up kernel machines". Advances in Neural Information Processing Systems.
[25] http://crsouza.com/2010/03/kernel-functions-for-machine-learning-applications/
[26] Aizerman, Mark A.; Braverman, Emmanuel M.; and Rozonoer, Lev I. (1964). "Theoretical foundations of the potential function method in pattern recognition learning". Automation and Remote Control 25: 821–837.
[27] Joachims, Thorsten; "Transductive Inference for Text Classification using Support Vector Machines", Proceedings of the 1999 International Conference on Machine Learning (ICML 1999), pp. 200-209.
[28] Boser, B. E.; Guyon, I. M.; Vapnik, V. N. (1992). "A training algorithm for optimal margin classifiers". Proceedings of the fifth annual workshop on Computational learning theory - COLT '92. p. 144. doi:10.1145/130385.130401. ISBN 089791497X.
[29] Meyer, D.; Leisch, F.; Hornik, K. (2003). "The support vector machine under test". Neurocomputing 55: 169. doi:10.1016/S0925-2312(03)00431-4
[30] Joachims, Thorsten; "Transductive Inference for Text Classification using Support Vector Machines", Proceedings of the 1999 International Conference on Machine Learning (ICML 1999), pp. 200-209.
[31] Dietterich, Thomas G.; and Bakiri, Ghulum; Bakiri (1995). "Solving Multiclass Learning Problems via Error-Correcting Output Codes" (PDF). Journal of Artificial Intelligence Research, Vol. 2 2: 263– 286. arXiv:cs/9501101.
[32] Mark A. Davenport, Student Member, IEEE,Richard G. Baraniuk, Fellow, IEEE, and Clayton D. Scott, Member, IEEE—―Tuning Support Vector Machines for Minimax and Neyman-Pearson Classificationǁ IEEE TRANSACTIONS ON PATTERN ANALYSIS AND MACHINE INTELLIGENCE, VOL. 32, NO. 10, OCTOBER 2010