ABSTRACT
CLAY, ROSS BENJAMIN. Enabling MapReduce to Harness Idle Cycles in Interactive-User Clouds. (Under the direction of Xiaosong Ma.)
Over the past few years, cloud computing has rapidly grown in popularity and it is now being applied to a wide range of computational problems. Yet, despite the extent and breadth of the activities that utilize cloud computing, the potential for energy savings with this hosting method has not been fully realized. Given that idle power often represents a significant portion of total, and that cloud installations frequently contain hundreds or thousands of nodes, an examination into the energy usage of such operations is a worthy endeavor.
To conduct research in this realm, we inspected NCSU’s VCL. We noted that Infrastructure as-a-service (IaaS) clouds that are hosting interactive users like NCSU’s VCL typically have a high degree of over-provisioning. This overcommitment results from the allocation of entire VMs to each user and the unpredictability of user access patterns. Therefore, NCSU’s VCL, and clouds that are of a similar structure, present a unique opportunity for energy efficiency optimization.
In order to improve energy efficiency in such clouds, we enable a small, dedicated MapReduce cluster to harvest idle cycles alongside interactive users. The core of our approach is the co-location of response-time sensitive interactive-user VMs with response-time insensitive batch workloads powered by MapReduce. To maximize MapReduce performance without disturbing the foreground user, we couple a custom configuration of Hadoop with an autonomous framework designed to dynamically tolerate user behavior and I/O bottlenecks. Our framework combines offline prediction with online learning to adapt to a wide range of MapReduce workload characteristics and foreground user behaviors.
© Copyright 2011 by Ross Benjamin Clay
Enabling MapReduce to Harness Idle Cycles in Interactive-User Clouds
by
Ross Benjamin Clay
A thesis submitted to the Graduate Faculty of North Carolina State University
in partial fulfillment of the requirements for the Degree of
Master of Science
Computer Science
Raleigh, North Carolina
2011
APPROVED BY:
Xiaohui Gu Frank Mueller
Xiaosong Ma
DEDICATION
BIOGRAPHY
ACKNOWLEDGEMENTS
TABLE OF CONTENTS
List of Tables. . . viii
List of Figures. . . ix
Chapter 1 Introduction . . . 1
Chapter 2 Background . . . 7
2.1 MapReduce . . . 7
2.1.1 Implementations . . . 8
2.1.2 Programming Paradigm . . . 8
2.1.3 Hadoop Framework and Filesystem . . . 9
2.2 The VCL . . . 11
Chapter 3 Hybrid Design . . . 14
3.1 Overview . . . 14
3.2 Active Volunteer Environment . . . 15
3.2.1 CPU . . . 16
3.2.2 Memory . . . 17
3.2.3 Disk I/O . . . 17
3.2.4 Network I/O . . . 18
3.3 MapReduce Volunteer Configuration . . . 19
3.3.1 HDFS . . . 20
3.3.2 Intermediate data . . . 20
3.3.3 Reducers . . . 20
3.3.4 Swap and memory . . . 21
3.3.5 Data compression . . . 22
3.3.6 LATE scheduler . . . 22
Chapter 4 Autonomic Management Framework . . . 23
4.1 Hadoop Phases . . . 24
4.2 Sensors . . . 25
4.3 Framework Overview . . . 26
4.3.1 Energy Minimization: Motivation . . . 28
4.4 Actuation Mechanics: Manipulating Volunteer Pool Size . . . 29
4.5 Energy Model Generation . . . 31
4.5.1 CPU . . . 31
4.5.2 Memory . . . 32
4.5.3 Disk . . . 33
4.6 MapReduce Job Profile Generation . . . 33
4.6.1 CPU . . . 34
4.6.2 Disk . . . 35
4.7.1 Foreground Load Characterization . . . 35
4.7.2 Volunteer Resource Availability Prediction . . . 36
4.8 Volunteer Count Enumeration . . . 37
4.9 I/O Bottleneck Compensation . . . 37
4.9.1 Offline methods . . . 38
4.9.2 Complexity of the I/O landscape . . . 39
4.9.3 Online approach . . . 39
4.10 Runtime Prediction . . . 44
4.11 Energy Prediction . . . 45
4.12 Actuation and Inhibition . . . 46
Chapter 5 Workloads . . . 48
5.1 Foreground (Interactive User) Workload Selection . . . 48
5.2 Foreground (Interactive User) Workload Creation . . . 49
5.2.1 generator . . . 49
5.2.2 VNCplay . . . 50
5.2.3 Dogtail . . . 51
5.2.4 Scripting . . . 52
5.2.5 Finalized Techniques . . . 52
5.3 Background (MapReduce) Workload Constraints . . . 52
5.3.1 Compute-Intensiveness . . . 52
5.3.2 Reducer Count . . . 53
5.3.3 Non-Iterative/Staged Jobs . . . 53
5.4 Background (MapReduce) Workloads Selected . . . 53
5.4.1 Matrix Multiplication . . . 53
5.4.2 Pi . . . 54
5.4.3 Streaming FASTA . . . 54
5.4.4 Word Co-occurrence . . . 54
5.4.5 Wordcount . . . 55
Chapter 6 Results. . . 56
6.1 Experimental Platform . . . 56
6.2 Hybrid Design: Runtime and Energy Gains . . . 57
6.2.1 Compute-bound workloads . . . 60
6.2.2 I/O-bound workloads . . . 60
6.2.3 Reducer-bound workloads . . . 60
6.3 Hybrid Design: Role of I/O Bottlenecks . . . 62
6.4 Hybrid Design: Hadoop Phases . . . 63
6.4.1 Identity Reducers . . . 64
6.4.2 Trivial Reducers . . . 64
6.4.3 Significant Reducers . . . 65
6.5 Hybrid Design: Impact of Foreground Workloads . . . 65
6.5.1 Pi Runtime . . . 67
6.5.4 Energy Savings . . . 68
6.6 Autonomic Framework: Overview . . . 70
6.7 Autonomic Framework: Energy Model Accuracy . . . 72
6.8 Autonomic Framework: Foreground CPU Prediction . . . 74
6.9 Autonomic Framework: I/O Bottleneck Prediction . . . 74
6.9.1 Prediction Accuracy . . . 76
6.9.2 SFASTA I6 . . . 78
6.10 Autonomic Framework: Runtime Minimization . . . 78
6.10.1 Accuracy Overview . . . 81
6.10.2 Wordcount . . . 81
6.10.3 SFASTA I6 . . . 82
6.10.4 Matrix Multiplication . . . 85
6.10.5 Word Cooccurrence . . . 85
6.10.6 Pi . . . 86
6.11 Autonomic Framework: Energy Minimization . . . 87
Chapter 7 Related Work . . . 90
7.1 Volunteer MapReduce . . . 90
7.1.1 MOON . . . 90
7.1.2 Ussop . . . 91
7.1.3 See Spot Run . . . 92
7.2 Profiling MapReduce . . . 93
7.3 MapReduce and Heterogeneity . . . 94
7.4 MapReduce and Energy . . . 95
7.5 Cloud Computing . . . 96
7.6 Volunteer Computing . . . 96
Chapter 8 Future Work. . . 98
8.1 Goals and Approaches . . . 98
8.2 Hadoop Modifications . . . 99
8.3 Management Framework Enhancements . . . 100
8.4 Volunteer Environment . . . 100
Chapter 9 Conclusion. . . 102
LIST OF TABLES
Table 4.1 Sensors employed by our framework. . . 26
Table 5.1 Most popular VCL reservation types . . . 49
Table 5.2 Foreground load recreation methods . . . 52
Table 5.3 Background workload characteristics . . . 54
Table 6.1 Runtime minimization experiments . . . 81
LIST OF FIGURES
Figure 1.1 VCL reservation CPU utilization . . . 3
Figure 1.2 Intel power consumption . . . 4
Figure 2.1 Hadoop overview . . . 10
Figure 2.2 VCL overview . . . 13
Figure 3.1 Node types used in our system . . . 15
Figure 3.2 VCL reservation hardware . . . 16
Figure 3.3 Hybrid cluster diagram . . . 19
Figure 3.4 Possible Reducer slot configurations. . . 21
Figure 4.1 Ideal volunteer pool sizes for Hybrid clusters . . . 24
Figure 4.2 Hadoop Phases . . . 25
Figure 4.3 Management Framework Overview . . . 27
Figure 4.4 Example marginal gains for cluster expansion . . . 30
Figure 4.5 Example behavior of the ondemand governor, which selects CPU frequency based on utilization patterns. . . 32
Figure 4.6 Example I/O bottleneck . . . 38
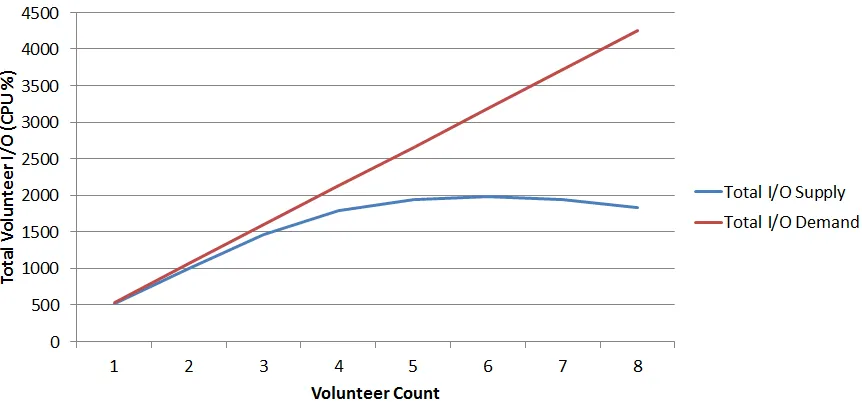
Figure 4.7 Example volunteer I/O supply and demand . . . 41
Figure 4.8 Example I/O regression artifacts. . . 43
Figure 4.9 Round-robin I/O distribution algorithm, shown in Python . . . 44
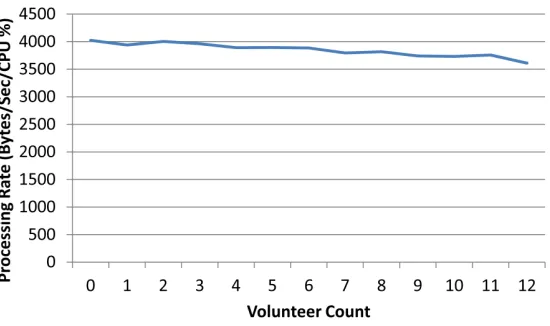
Figure 4.10 Dynamic processing rate . . . 45
Figure 6.1 Hybrid design energy cost comparison . . . 58
Figure 6.2 Hybrid design runtime comparison . . . 59
Figure 6.3 I/O-bound runtimes . . . 61
Figure 6.4 Matrix Multiplication Reduce time . . . 62
Figure 6.5 I/O-bound workload bottleneck behavior . . . 63
Figure 6.6 Reducer-bound workload bottleneck behavior . . . 64
Figure 6.7 Hybrid 2d SFASTA I6 phases . . . 65
Figure 6.8 Hybrid 2d Wordcount phases . . . 66
Figure 6.9 Hybrid 2d Matrix Multiplication phases . . . 66
Figure 6.10 Pi runtime under foreground loads . . . 68
Figure 6.11 Wordcount runtime under foreground loads . . . 69
Figure 6.12 Average Foreground CPU with Pi . . . 70
Figure 6.13 Energy consumption under foreground loads . . . 71
Figure 6.14 Energy model accuracy for various workloads . . . 73
Figure 6.15 Foreground Load Prediction Accuracy . . . 75
Figure 6.16 Average Foreground CPU experienced during accuracy testing. . . 76
Figure 6.17 I/O Prediction Root Mean Squared Deviation (RMSD) . . . 77
Figure 6.18 SFASTA I6 I/O Prediction Curves . . . 79
Figure 6.20 Wordcount runtime minimization results . . . 83
Figure 6.21 Available CPU for Wordcount with Photoshop . . . 83
Figure 6.22 SFASTA I6 runtime minimization results . . . 84
Figure 6.23 Matrix Multiplication runtime minimization results . . . 85
Figure 6.24 Word Cooccurrence runtime minimization results . . . 86
Figure 6.25 Pi runtime minimization results . . . 87
CHAPTER
1
Introduction
Cloud computing is a dynamic computing model with widespread popularity. It is attractive for both sides of the market: it frees consumers from costly, up-front investments and shifts billing to a pay-as-you-go model, while it offers providers a flexible mechanism for selling excess capacity and improving return on their infrastructure.
A diverse array of cloud implementations exist in a spectrum of user control and scalability:
• An application in Software as a Service (SaaS), such as in Google Docs[39]or Microsoft Office Live[73].
• A scalable computing/deployment environment in Platform as a Service (PaaS), such as Google App Engine[38].
• Fully-functional virtual machines (VMs) in Infrastructure as a Service (IaaS), such as Amazon EC2[1]and NCSU’s Virtual Computing Lab (VCL)[76].
Of these, SaaS is the highest level of abstraction and offers the most scalability to the client, while IaaS is the lowest level and offers the most flexibility. Because of IaaS’s usefulness for any workload, and the tendency for IaaS clouds to underpin higher-level cloud implementations such as PaaS or SaaS, it is a class of cloud which had broad appeal. IaaS clouds are particularly attractive for efficiency improvements due to their coarse-grained nature, which has potential for overprovisioning.
desktop-based graphical user interface (GUI) applications, are a prime target. Images containing Windows XP represent 92% of all unique users in NCSU’s VCL installation during the Fall 2010 semester [77], placing interactive-user sessions in the majority for this specific cloud platform.
After a brief analysis, we discovered that several typical VCL image types significantly underutilized the resources available to them, as shown by the residual CPU availability analysis in Figure 1.1. We selected the workloads in Figure 1.1 based on an analysis of the most popular VCL workloads, which is described in detail in Section 5.1. This low utilization is not exclusive to interactive-user IaaS clouds, and many datacenters show substantial under-utilization[15]. However, overprovisioning and subsequent under-utilization is especially likely in these clouds due to the unique demands and behavior patterns of human users, which yield opposing conclusions for resource management.
Interactive workloads, such as those involving web browsing and document editing, typically do not consume many resources because humans are slow workers relative to computers. Humans do not work steadily, instead spending significant amounts ofthink timereading webpages or contemplating the wording of sentences. Even in interactive workloads which have a significant computation component, such as Matlab scripting or software development, the user still spends substantial think time writing scripts, interpreting results and planning future actions. Interactive workloads will therefore be, at best, bursty and, at worst, idle for a large percentage of the timeline. Because of this low, unsteady utilization pattern, a naive conclusion could be that interactive workloads should be allocated a fraction of the resources which would be given to a fast-working batch workload.
The counterpoint to this conclusion arises from human expectations - although we spend a large portion of our time thinking, when we are actively using a computer we expect it to be fast. This is especially true of user interfaces and GUIs. If a source code compilation takes 35 seconds instead of 30, a human will not notice yet, if a menu takes 1500ms to appear instead of 150 she definitely will. The visual aspect of GUIs makes slowdowns more noticeable, as elements fail to perform actions quickly or as the dreaded “hourglass” or “beachball” cursors appear. The lesson is that interactive workloads demand fast response times, even if overall resource consumption is low.
Low resource consumption in clouds is typically treated with virtual machinepacking, where several workloads are placed in VMs and co-located on the same physical hardware. Unfortunately, the strict response time requirement of interactive workloads precludes the usage of packing, because simultaneous bursts in multiple VMs could degrade performance for all users. The NCSU VCL does not use packing because of this potential problem, instead allocating each user either dedicated hardware (processor cores and memory) or an entire physical node. While light packing may be appropriate, such as assigning interactive workloads a mix of dedicated and shared hardware, to some degree overprovisioning will always be present in these cloud types due to the nature of human demands.
(a): Average available CPU (b): Percentage of application execution time spent idle Figure 1.1: VCL interactive-user CPU utilization characteristics
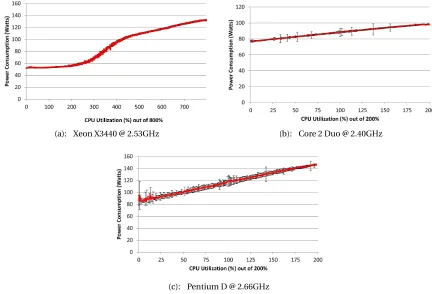
centage of the total cost of ownership (TCO) for datacenters[14], and the effects of declining hardware prices and increasing global energy costs will exacerbate this phenomenon. An examination of several generations of Intel processors, shown in Figure 1.2, demonstrates that idle power consumption is a significant portion of total power usage, indicating a possible area for improvement.
Two primary solutions exist to reduce the cost of idle power. One, which has been well-studied, is to power off orsleepphysical nodes when they are idle. This is a good solution if the nodes are truly idle and performing no work, and Wake-on-LAN (WoL) technologies provide a mechanism to quickly transition nodes in and out of sleep. However, this solution does not work for nodes have low utilization but are not idle, such as interactive workloads. Obviously these workloads cannot be put to sleep because the active user would notice that they no longer have a session. Instead, the available technique in this situation is to increase utilization, amortizing the idle power cost over the whole power range while performing useful work. In other words, maximizing energy efficiency can be accomplished by minimizing idle or wasted cycles.
To reduce wasted cycles, we turned to techniques developed for volunteer computing (VC). Volunteer computing is a well-established computing paradigm with a sizable following for primarily scientific workloads. For years,passivevolunteer computing has been the most-common form of VC, where the volunteer node is only utilized when the foreground user is not present. Example software packages include as CONDOR[69]and BOINC[6], and projects with large installation bases include SETI[7], Folding@Home[63]and World Community Grid[35].
(a): Xeon X3440 @ 2.53GHz (b): Core 2 Duo @ 2.40GHz
(c): Pentium D @ 2.66GHz
Figure 1.2: Power consumption of servers containing different generations of Intel CPUs
attractive because of two weaknesses in passive VC:
1. Passive VC does not harvest while the foreground user is present, even if the foreground user only requires a minor amount of resources (e.g. web-browsing or document editing).
2. Passive VC is inherently energy-inefficient, because it requires that nodes remain powered on and running when they could otherwise be powered down.
This second point is especially important when considering processor energy consumption profiles, as discussed above. Since active VC does not have these problems, we believe that it is an excellent mechanism to fully utilize idle cycles in an interactive-user IaaS cloud. To corroborate these conclusions, our group’s previous work found that energy efficiency of a physical machine can be substantially improved using active oraggressivevolunteer computing[66].
in modern datacenters, primarily in computation to communication ratio and data volume. Volun-teer computing workloads are designed to operate over slow, high-latency Internet links and thus are typically heavily compute-bound, which will not take full advantage of fast networks and high bisection bandwidth in typical cloud installations. An ideal workload would take advantage of not only the idle cycles in IaaS clouds, but the network infrastructure as well.
MapReduce[25]is a very popular programming paradigm and execution framework for data-intensive computing tasks which are typically embarrassingly parallel in nature. A number of imple-mentations exist[93, 45, 92, 28, 61], with Apache’s Hadoop[33]being the most popular. We believe MapReduce is an ideal workload for making use of idle cycles for a number of reasons:
1. MapReduce is embarrassingly parallel and fault-tolerant by design, which are attractive features in volunteer computing environments.
2. MapReduce is a generic framework supporting a substantial range of workloads in a spectrum ranging from data-intensive[18]to compute-intensive[98].
3. Many organizations which host public clouds of some form already use MapReduce for per-forming business-critical tasks, such as Google, Yahoo, and Facebook[10].
4. Augmentations of MapReduce to support volunteer computing[67]have received good recep-tion in the research community, indicating a broader interest in this topic.
Therefore, we propose to build a virtual MapReduce cluster to harness idle cycles from interactive-user IaaS clouds. To this end, the contributions of this work are:
• A hybrid MapReduce cluster design, implemented in Hadoop[33]and tailored to operate in active volunteer computing environments.
• A demonstration of the energy benefits of using our hybrid design to minimize idle cycles, saving 9−31% energy depending on the workload tested.
• A thorough examination of the difficulties in producing a one-size-fits-all solution under these conditions.
• An autonomous management framework prototype for predicting and maximizing performance of our hybrid cluster under diverse and changing workloads. Based on runtime minimization, our prototype achieves volunteer counts near the ideal target>80% of time.
CHAPTER
2
Background
As discussed in Chapter 1, our work is motivated by the inherent energy inefficiencies in interactive-user IaaS clouds, of which NCSU’s VCL is a prime example. We propose to reduce this energy inefficiency by harvesting unused cycles and leveraging them to drive a MapReduce cluster built on a hybrid design. Before we discuss our solution and its functionality in Chapters 3 and 4, we will give an overview of MapReduce and the VCL.
2.1
MapReduce
MapReduce is a programming paradigm and supporting framework first published by Google em-ployees in 2004[25]. This seminal work has profoundly influenced both the academic world and industry because its strengths dovetail well with the characteristics of today’s data-heavy computa-tional problems and the petascale datacenters that process them. The primary features of MapReduce include:
• Simple programming paradigm for embarrassingly parallel problems.
• Architecture conducive to data-intensive workloads by shipping computation to data.
• Robust management framework scalable to tens of thousands of nodes.
2.1.1 Implementations
There are many MapReduce implementations available, with Apache Hadoop[33]being a very popular distribution[10]that is written in Java and heavily supported by Yahoo!. We use Hadoop in this work and discuss the particulars of its management framework and distributed filesystem in Section 2.1.3.
Other implementations exist for distributed platforms, such as Amazon’s Elastic MapReduce[2] designed for execution in EC2, Nokia’s Disco[21]written in Python, Geni.com’s Skynet[36]written in Ruby, and MySpace’s qizmt[74]written in .NET. In addition, implementations have been developed for a variety of specialized hardware, such as GPUs[45, 16, 20, 31], Cell Broadband Engine[90, 91]and shared-memory architectures[94], as discussed in Chapter 7.
Finally, meta-languages and associated frameworks have been built on top of MapReduce for handling problems which can be expressed as one or more MapReduce workloads, such as Apache Pig[34]and Google’s Sawzall[89].
2.1.2 Programming Paradigm
The MapReduce paradigm has two main primitives, Map and Reduce, which, in accordance with MapReduce’s embarrassingly parallel nature, are repeatedly invoked. Figure 2.1 shows the typical operation and dataflow of Hadoop Map and Reduce tasks.
Map tasks operate directly on input data in the form of blocks which can be further divided intosplits, and produce intermediate data. Traditionally, input, intermediate and output data is represented as
<key, value>
tuples once inside the MapReduce framework. These tuples allow identification of similar data and sorting. For example, Wordcount is a workload which counts the occurrence of words in a large number of text files. In Wordcount, each Map task receives a single text file as input, divides the file by line into splits, and, in terms of intermediate data, produces a series of tuples indicating all of the words which occurred in that text file and their counts. Given the input:Two brown cows
the Wordcount Map task would produce the following intermediate data:
<Two, 1>,<brown, 1>,<cows, 1>
Reduce tasks operate on intermediate data and produce output data. Reducers have three sub-stages which are different in functionality:
• Shuffle, which copies intermediate data from Map tasks across the network
The Reduce function varies significantly across MapReduce workloads, and can exist in a spectrum from no computation, e.g. passing intermediate data through untouched, to performing critical calculations. In Wordcount, the Reducer has a consolidation role, and takes all the intermediate data tuples and combines them to form global counts for each word. For example, given two input files:
Two brown cows
andTwo white cows
and subsequent intermediate data:
<Two, 1>,<brown, 1>,<cows, 1>
and<Two, 1>,<white, 1>,<cows, 1>
the Wordcount reducer produces:
<Two, 2>,<brown, 1>,<white, 1>,<cows, 2>
and writes this to a text file, with one word per line. However, as mentioned, the reducer can have a broader role depending on the workload.
Finally, a third, less-significant primitive exists called a Combiner, which operates as an intermedi-ate data filter, performing consolidation across all the Map tasks running on each node. The primary benefit of this is reduction in network traffic during the Shuffle phase if the data yields duplicate or extraneous intermediate data. In the case of Wordcount, the Combiner would perform the same functionality as the Reducer, removing any duplicate words and incrementing counts.
2.1.3 Hadoop Framework and Filesystem
As stated previously, we selected Hadoop as our target MapReduce implementation. The Hadoop framework consists of two primary components: a MapReduce framework and a distributed filesystem called HDFS.
Hadoop’s MapReduce framework contains two types of nodes: theJobTracker, which are master nodes coordinating tasks at the Job level, and theTaskTracker, which run onslavesand perform the actual work. TaskTrackers hold a number of slots for performing Map or Reduce tasks, which are representations of capacity. The JobTracker is responsible for assigning input data blocks to Map slots on TaskTrackers, as well as instantiating Reducers in Reduce slots. As the job progresses, the JobTracker performs a number of book-keeping and failure-handling functions, such as:
• satisfying TaskTracker requests for additional work when slots become empty
• recording when Map tasks complete and where their intermediate data is stored
Figure 2.1: Hadoop MapReduce overview. Image credit: Yahoo! Developer Network Hadoop Tutorial - Module 4[78].
• noticing when tasks fail and rescheduling them
• noticing when slave nodes go offline unexpectedly
• blacklisting failing hardware
• accepting new jobs from a client
• enforcing a queuing policy across multiple jobs to ensure correct prioritization
NameN-actual data in the form of blocks on their native filesystem. Each block has a maximum size, set globally for HDFS, and filesystem accounting is done at the block level. When a client (or TaskTracker) wants to access a block, they contact the NameNode with their request, which gives them the address of a DataNode holding that block. The client then communicates directly with the DataNode to retrieve the block. Thus, HDFS is centralized for look-ups, but the data transfer is decentralized for scalability.
HDFS is designed for fault-tolerance, and makes use of block replication to ensure that node failures do not interrupt data access. The replication factor is set by the administrator, and block replication with the default factor of 3 works as follows: each block is written to the local DataNode, another DataNode in the same rack, and a third DataNode on a different rack. Block writes to replicas are pipelined, such that each DataNode only serves one additional DataNode in a chain, reducing the possibility of bottlenecks. The NameNode coordinates these actions, selecting replica targets, noting when nodes fail and re-triggering replication actions to ensure that the replication factor is enforced. Finally, the NameNode can initiate a global balancing action if instructed to do so by the administrator, which attempts to redistribute blocks in such a way that disk utilization on each node is equalized.
2.2
The VCL
NCSU’s Virtual Computing Lab (VCL)[76]is an Infrastructure-as-a-Service (IaaS) cloud which provides a centralized and scalable method for students of NCSU to access a variety of software for educational purposes. Started in the Spring of 2004, the VCL has hosted over 750,000 reservations as of October 2010, or over 300 reservations per day 7 days a week. In 2008, NCSU donated the VCL to Apache as an incubator project[8]. Figure 2.2 gives an overview of the VCL architecture.
Software in the VCL is packaged asimages, which are compressed copies of disks similar to those used for virtual machines. Educators or administrators can create custom images, containing an operating system, software packages and settings of choice, for a variety of purposes, such as a single lab, an entire course or as a general purpose base image from which other images can be built. Images can be designed to run on physical machines or as a virtual machine - the process is identical from the administrator’s and users’ perspectives.
the type of image. For Microsoft Windows images, Remote Desktop Connection is used, whereas Linux and Solaris images typically offer SSH. However, the image’s creator can install and configure additional remote capabilities if desired, such as VNC.
Images do not retain their local disk contents between reservations, although some efforts are taken to avoid re-imaging if multiple reservations occur in serial for the same image type. Even if this does happen, there is no guarantee offered that the disk will not be reformatted after a reservation completes. Therefore, users store personal files on a networked filesystem, such as NCSU’s AFS, so they can take advantage of data persistence over multiple reservations.
When a reservation’s time limit is reached, or the VCL detects that there has been no connection to an image for a predefined timeout, the reservation is terminated and the physical node or VM slot becomes available to satisfy another reservation. The node is not immediately re-imaged, as discussed above, in the chance that another reservation for the same image type may arrive soon.
In addition to 751 blades, NCSU’s VCL has the capability of using lab machines to host images. This functionality is enabled at night when the labs are physically closed and the machines are sitting idle. Intelligent handling of reservation lengths, which are known at the time of reservation creation, is used to ensure that all reservations terminate before the labs open in the morning.
CHAPTER
3
Hybrid Design
3.1
Overview
Our system was developed to facilitate the operation of a MapReduce cluster under active volunteer computing (AVC) conditions, and we tailored it to cope with the unique constraints that these condi-tions impose. Before discussing the features and strategies we use to achieve optimum performance, it is important to consider a brief overview of terms and motivations.
Our system is designed to facilitate of the coexistence of two types of workloads:
• Time-sensitive interactive workloads, driven by a human user, which we termforeground
• Time-insensitive batch workloads, driven by the Hadoop[33]MapReduce framework, which we termbackground
In designing a cluster to meet this goal, the primary issue we face is the unreliability of the background workers. Because we leverage active VC to harvest idle cycles, background workers or volunteersare at the mercy of the foreground user and will have dynamic availability over time. To cope with this, we take the approach employed in[67]of using volunteers to supplement a dedicated cluster, which is devoted full-time to the background workload. This provides an important performance baseline, especially with MapReduce’s well-established straggler weakness. In addition, as described below in Section 3.2.3, volunteers are prevented from using their local disks to avoid complications arising from their transience, making the dedicated cluster the sole location for data storage.
Figure 3.1: Node types used in our system
• Dedicated nodes, which are dedicated entirely to the background workload
• Shared nodes, which host both foreground and volunteer VMs:
– Foreground VMs, which host the foreground load and are given maximum priority
– Volunteer VMs, which exist within the foreground VMs’ unused CPU cycles
The coexistence of foreground and volunteer VMs on the same hardware necessitates a careful consideration of design choices to eliminate the possibility of interference, and to ensure that the interactive user (foreground) is always given priority over MapReduce (background). These issues are discussed in Section 3.2.
In order to best cope with active volunteer conditions, we have made a number of configuration changes to our Volunteer VMs to maximize performance. These choices are discussed in Section 3.3.
Finally, to minimize energy consumption with arbitrary foreground and background workload combinations, we have developed an autonomic management framework which uses online tech-niques to determine and dynamically adjust the ideal number of volunteers to supplement a given pool of dedicated nodes. This framework and its algorithms are discussed in Chapter 4.
3.2
Active Volunteer Environment
As discussed in Chapter 1, active volunteer computing (active VC) is highly attractive for maximizing the energy efficiency of IaaS clouds. While active volunteer computing has been demonstrated without virtualization and using only process prioritization[97], virtualization offers several significant benefits, making active VC ideal for large-scale cloud deployments:
• VM prioritization, allowing preferential access to CPU cycles at high resolution
• Uniform volunteer environment, allowing bulk deployment of custom libraries and settings
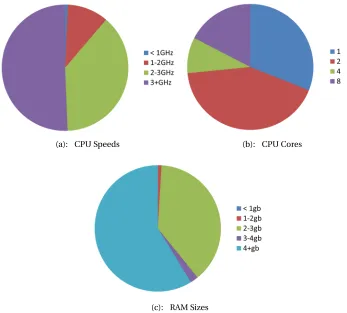
(a): CPU Speeds (b): CPU Cores
(c): RAM Sizes
Figure 3.2: Hardware characteristics of 750,000 VCL reservations, Sept. 2004 - Oct. 2010.
• Guaranteed isolation, providing security
• Migration, snapshots and other modern hypervisor features
Active volunteer computing has substantial benefits for IaaS clouds and is well-suited for virtu-alized environments, which form the backbone of many modern datacenters. However, it entails operating under more difficult conditions than passive VC due to the requirement that volunteers always defer to foreground user demands. The degree of difficulty varies per resource type, and we will discuss each in turn.
3.2.1 CPU
applications being used, the tasks being performed and the particular user. We investigated resource consumption of representative foreground workloads in Chapter 5, and found that significant residual CPU cycles are typically available, although burstiness varies.
As shown in Figure 3.2b, 68% of all VCL reservations have more than one core, which is highly conducive to multitasking and increases the probability of cycle availability.
3.2.2 Memory
Unlike CPU, memory is a resource which cannot be shared and which has relatively static demand characteristics. While techniques exist to reduce the memory footprint of VMs[44], based on the RAM sizes seen in Figure 3.2c, we assume that these methods are unnecessary. Given these RAM size values as well as experience with our test cluster, at least 1024MB is typically available per core, which, when divided evenly, is 512MB per core to both the volunteer and foreground VMs. Based on the most popular VCL workloads shown in Chapter 5, we believe that this allocation is sufficient. We therefore divide memory between foreground and volunteer VMs in a static and equal split.
A component of future work is to examine alternative strategies for memory-limited scenarios, such as large demand from either foreground or background workloads.
3.2.3 Disk I/O
Previous work has been published in the areas of VM disk I/O prioritization and isolation on hosts and within storage area networks (SANs) [42, 41, 46]. However, when we examined the unique environment and goals of this project, we found that the manner in which MapReduce utilizes disks is not conducive to our desired volunteer behavior.
When a new DataNode is added to HDFS, the cluster must bebalancedby the administrator in order to place blocks on the new node. Balancing forces replicas to be created on the new node and removes them from existing nodes. When the node needs to be removed from the cluster, the reverse must happen: the DataNode isdecommissionedby having its blocks transferred to the remaining nodes. During balancing and decommissioning actions, network traffic can be heavy as large volumes of data are transferred, which will compete with currently-running MapReduce jobs as well as the foreground user. Furthermore, this reliance on bulk data transfers significantly increases the time required to add and remove volunteers to our cluster, inhibiting our ability to react to changing foreground conditions in an agile manner.
there will be significant potential for data loss when multiple replicas of the same block go offline. [67]accounts for this phenomenon by setting separate replication factors for dedicated and volunteer nodes, ensuring that the dedicated nodes have a covering subset of replicas which guarantees data availability. However, the approach in[67]expects nodes to be unavailable for short periods while remaining available in the long-term, avoiding the issue of thrashing.
Because of the problems outlined above, we elected to make volunteer VMs operate disklessly. The volunteers are not purely diskless, and still use the local disk for storage of their image and during boot. However, once booted, all MapReduce-based disk I/O is redirected to the network. This has the practical benefit of a small, 8GB VM image, making deployment quick and enabling the possibility of VM migration in future work.
3.2.4 Network I/O
Network I/O isolation techniques exist at the hypervisor level, and consist mainly of restricting virtual network devices to lower-than-native throughput rates. We believe that this approach is sufficient, due to low anticipated network demand from foreground users and given the typical design of VCL-like IaaS clouds. For example, background VMs can be restricted to a portion of total available throughput, ensuring that foreground VMs will always receive adequate response time and some bandwidth.
Table 5.1 in Chapter 5 shows the top VCL reservation types, and based on expected usage character-istics of these applications, we believe that typical foreground network demands are low. Applications required by the foreground user are already installed on the image, and although input and output data may be required, we do not expect it to be in the multi-GB or TB range required by batch scientific workloads.
In addition, the VCL uses a private network to transfer images to compute nodes, eliminating the possibility of background VMs’ network traffic interfering with infrastructure operations. This is a typical approach, such as with Eucalyptus’s use of a storage network with ATA over Ethernet[81, 49], and should be broadly applicable to IaaS clouds.
Finally, gigabit Ethernet is common, and offers throughput far above that of an individual SATA disk. In typical cluster configurations, where a pool of dedicated nodes are supplemented with a larger number of volunteers, we expect disk I/O to be the primary bottleneck as long as the network is sufficiently fast (100Mbit or 1Gbit).
Figure 3.3: Hybrid cluster diagram, showing dedicated nodes supplemented with volunteer pool. One dedicated node acts as the Hadoop master.
3.3
MapReduce Volunteer Configuration
MapReduce was originally designed for homogeneous hardware and operating conditions, and, upon consideration of the targeted operating environment, it is clear that some changes in Hadoop’s configuration are required.
The unavailability of the local disk for data storage (input, intermediate or output) has wide-ranging implications for our system. Not only does Hadoop require an altered configuration to operate in this fashion, but dedicated nodes’ disks are the only source of storage and thus become the primary bottleneck. In this section we discuss necessary Hadoop configuration changes, and, in Chapter 4, we elaborate on our bottleneck detection and prevention strategies.
3.3.1 HDFS
For the reasons outlined above in Section 3.2.3, we disable HDFS DataNodes on volunteers. This means that volunteers must read and write HDFS blocks, which are located on dedicated nodes, and all input and output data traffic is redirected over the network. We still run Hadoop TaskTrackers on volunteers so that computation can occur, but input blocks are retrieved from remote DataNodes. This has implications on the types of workloads that we can use, as discussed in Chapter 5.
3.3.2 Intermediate data
We chose to redirect intermediate data traffic over the network using a parallel filesystem (PFS), MooseFS[95]. A system at Sun Microsystems[53]used Lustre[96, 83]for intermediate data stor-age. We took a similar approach, redirecting both intermediate data and log writes to the PFS. We selected MooseFS over Lustre due to Lustre’s requirement of kernel patches on OSS nodes, which was technically difficult due to our reliance on the Xen hypervisor.
Once we decided against Lustre, we considered GlusterFS[51], but discarded it due to its require-ment that brick servers be added in multiples of the replication factor[50]- i.e. if the replication factor is two, two brick servers must be added/deleted at a time, which was too inflexible for our target environment. We also briefly examined Ceph[100, 26]but deemed it too unstable at the time of examination. MooseFS appeared to have flexible replication factor rules and was stable enough to meet our needs.
3.3.3 Reducers
We disabled Reducer slots on volunteers for two reasons. First, we wanted to ensure that reducers scaled only with the dedicated cluster size, to reduce contention at the dedicated disks during the reduce phase. With high volunteer:dedicated ratios, and jobs which launch a large number of reducers, dedicated disks could quickly become overloaded during the reduce phase. Second, this allowed us to decrease the amount of RAM given to volunteer nodes, which is appropriate given that volunteers must share their hardware with foreground VMs. Figure 3.4 shows these two configurations.
One downside to this approach is that there is significant inefficiency in intermediate data delivery, due to the fact that data is actually stored on dedicated nodes in the form of MooseFS chunks and that it must be read from volunteer nodes to be retrieved in file form. This can be seen in Figure 3.4b. Thus at least one additional network hop must be added to the intermediate→reducer data transit, and if the chunks were local to the dedicated node, two hops must be added.
(a): Reducers enabled on all nodes.
(b): Reducers enabled only on dedicated nodes. Figure 3.4: Possible Reducer slot configurations.
3.3.4 Swap and memory
3.3.5 Data compression
We enabled Lzo native compression[29]on our cluster for all data - input, where available, along with intermediate and output. Compression has the useful property of converting disk and network I/Os, which are scarce, into CPU cycles, which are abundant. We opted to use native compression libraries due to reports[85]that Java-based compression was inefficient.
During the course of this project, Google released their Snappy[40]fast compression algorithm for MapReduce, and future work is to switch from Lzo to the Snappy library to increase compression speed. We believe that this release is indicative of a general acceptance of the usefulness of compression to reduce I/O footprints in MapReduce clusters.
3.3.6 LATE scheduler
CHAPTER
4
Autonomic Management Framework
Intelligently allocating a MapReduce cluster under volunteer computing conditions, while minimizing energy consumption, requires an examination of the factors related to performance and scalability. These factors must be isolated, observed and modeled prior to the allocation of an ideal cluster size. The scenario which this thesis examines is one in which the dedicated cluster size and the specific MapReduce job are provided as inputs by the administrator. Our framework accepts these two choices as givens and then attempts to predict the ideal number of volunteers which will minimize energy consumption for the entire cluster. Since energy consumption is heavily tied to the runtime of each MapReduce job, we estimate runtime in order to predict energy usage.
As shown in Figure 4.1, the ideal volunteer pool size which results in the lowest energy consump-tion varies widely, even when fixing either the dedicated cluster size or the specific MapReduce job. Some of the main environmental and workload factors which influence this “sweet spot” of energy usage include:
• processor speed and core count relative to disk subsystem
• processor architecture and productivity for the given workload
• aggregate disk bandwidth of the dedicated cluster
• network speed
• available CPU cycles on the shared nodes
• compression ratios achievable on input, intermediate and output data
• Reduce task characteristics and Reduce phase percentage of total runtime
Figure 4.1: Ideal volunteer pool sizes based on energy consumption for Hybrid configurations with no foreground load running.
To measure these factors and predict their impact on energy consumption, our management framework consists of two components. First, we leverage a suite of sensors which allow us to collect data about the foreground and background nodes in real-time. Second, we employ a set of models which allow us to predict and control MapReduce job runtime and energy consumption by dynamically adjusting volunteer count.
4.1
Hadoop Phases
Figure 4.2 shows the operation of a typical MapReduce job. Map and Reduce tasks both launch initially, with Reduce tasks starting with the Shuffle stage. As Map tasks complete, the Reduce tasks pull intermediate data, storing it until all of the Map tasks finish and the Sort and Reduce stages begin. We call this thebody phase, and it is characterized by all of the Map slots being full. During the last Map task round, Map slots become empty as the TaskTrackers run out of new Map tasks to work on. We call this thetail phase, and it is characterized by some empty Map slots. Finally, all of the Map tasks complete, and the Reduce tasks complete the Shuffle stage, proceed to Sort and then Reduce. We call this thereduce phase, since the Reduce tasks are the only tasks still running.
Figure 4.2: Hadoop Phases
Of these three phases, the body phase is the best candidate for optimization. The reduce phase cannot be optimized, as previously discussed, while the tail phase is not ideal due to the effect of stragglers and the fact that it is hard to predetermine which TaskTrackers will be running. Therefore, our framework is designed with the goal of minimizing cluster energy consumption using estimates of body phase runtime. We show in Section 6.4 that all of the MapReduce loads tested have a significant body phase, and that this phase represents the vast majority of total runtime in most cases.
4.2
Sensors
Table 4.1 lists the sensors that we employ, their target platform and the underlying utilities. Most system resource sensors are launched using SSH commands and then they push their values back to the management framework using
netcat. Hadoop-based sensors collect via persistent SSH
connections or by scraping the Hadoop web management framework. Each sensor instance uses its own thread for receiving pushed values or for polling Hadoop management interfaces.Our management framework is modularized and extensible, making heavy use of inheritance and utility functions to reduce code reuse, and leverages threading and optimized concurrency protection mechanisms to provide high degrees of scalability. For example, to passively monitor 10 physical nodes hosting 26 VMs, we employ 30 threads and consume less than 200MB of RAM even after several days of monitoring.
Table 4.1: Sensors employed by our framework.
Value Platform Mechanism
CPU Utilization All Domain 0s Xen CPU metrics
CPU Frequency All Domain 0s
cpufreq-info
utilityMemory Consumption All VMs
free
utilityMemory Page Allocation Rate All VMs
sar
utility Disk I/O Rate Dedicated Domain 0siostat
utility Disk I/O CPU impact (iowait) Dedicated VMsiostat
utilityPower Consumption All Domain 0s WattsUp? power meter utility Hadoop Job counters Hadoop Master Hadoop commandline utilities Hadoop Task details Hadoop Master Hadoop web interface
4.3
Framework Overview
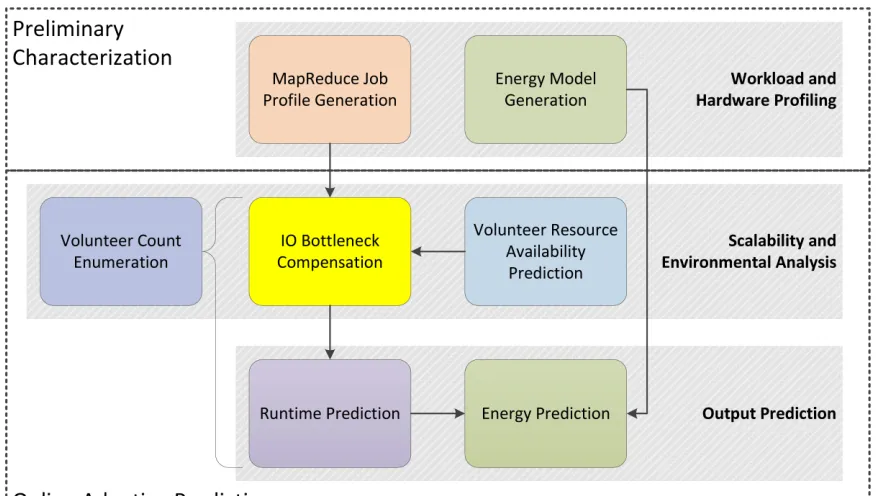
In this chapter, we discuss the design process behind our prototype framework. In order to accurately predict runtime and energy consumption under active volunteer conditions and the cluster design choices made in Section 3.3, we utilize several modules which each focus on one factor that may affect scalability and performance. Figure 4.3 shows each of these modules and the stages in which they are utilized.
Figure 4.3: Management Framework Overview
quickly react to changing foreground mixes.
To this end, we perform a preliminary, one-time characterization of the MapReduce job using only dedicated nodes. Such a characterization enables us to view the MapReduce workload with no interference from the foreground user, scalability issues or other volunteer dynamics. We also run a micro-benchmark on the cluster hardware in order to distill an energy model, so that we can predict power consumption for arbitrary CPU utilization levels and node counts.
Next, we make a series of periodic predictions of runtime and energy, updating our knowledge of the environment over time in order to improve accuracy. The three primary metrics that we update, based on observed behavior, are:
• Foreground CPU utilization, allowing us to react to dynamic active user behavior
• I/O scalability, allowing us to react to and predict the scalability of the given background workload and hardware characteristics
• Processing rate, allowing us to translate available CPU cycles into productivity
As a simple proof-of-concept, our period is currently a static, administrator-set length of time that does not change. An important component of future work is to make this adaptive, so that our framework can quickly react during early stages or stretches of foreground flux and can slow down when the environment stabilizes.
4.3.1 Energy Minimization: Motivation
As discussed above, the goal of our framework is to identify the point at which energy consumption is minimized. This point exists where the diminishing marginal return to runtime from adding an additional volunteer is outweighed by the marginal cost of that volunteer’s energy consumption.
When adding volunteers to a job of fixed input data size, the marginal returns decrease primarily due to thelaw of diminishing productivityfrom microeconomics. This law is relevant to our scenario if volunteers are considered to be analogous to a firm’s input:
The law of diminishing marginal returns (or diminishing marginal product) holds that, if a firm keeps increasing an input, holding all other inputs and technology constant, the corresponding increases in output will become smaller eventually. That is, if only one input is increased, the marginal product of that input will diminish eventually.[88]
However, in addition to those accruing from increased volunteer pool sizes, we will also realize diminishing returns in our cluster design from:
• disk and network contention at the dedicated pool
• the static number of reducer slots which typically yield fixed reduce phase lengths
• general parallelization overhead from the MapReduce framework
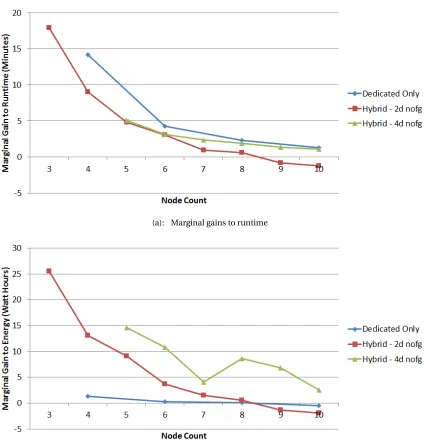
A typical example of this behavior is illustrated in Figure 4.4a and is universal to all workloads and cluster configurations, including those with only dedicated nodes. Variation in the slope of the curve across different configurations is due to the nature of the workload and how it performs on the given hardware.
The marginal energy gains from adding an additional volunteer are more complex, as shown in Figure 4.4b. The primary driver of energy gains is the relationship between runtime and energy cost. As described in Section 4.11, the background user pays full energy costs for dedicated nodes and incremental energy costs for volunteer nodes. Therefore dedicated energy costs are typically much greater than volunteer costs, but volunteers are still not free. Because of this, reductions in runtime translate into reduced dedicated energy cost, as the dedicated nodes run for a shorter period.
dedicated disks are unable to supply their I/O demand. This results in a balancing effect because energy consumption is highly dependent on CPU utilization. In other words, energy consumption typically increases because more volunteers are added to the cluster, but not as sharply as would be expected because of the effects of I/O bottlenecks.
Finally, issues related to HDFS balance and the peculiarities of a given workload can contribute to odd behavior, as seen in Figure 4.4b for the Hybrid cluster with 4 dedicated nodes, at the 7th marginal node. We assume that energy will trend with runtime and CPU consumption, but ignore these unpredictable artifacts because they are difficult to estimate and typically do not affect the overall trend of the curve.
4.4
Actuation Mechanics: Manipulating Volunteer Pool Size
Before describing the specifics of our prediction techniques, we think that it is important to consider the constraints surrounding actions that are taken by our framework. As discussed previously, we accept dedicated cluster size as a given and we attempt to select the volunteer pool size which will minimize energy consumption under dynamic foreground workloads.
We can change the volunteer pool size by adding and removing volunteers. To add volunteers, we simply start the TaskTracker daemon on a volunteer VM, and to remove volunteers we notify the JobTracker that the volunteer will no longer be available. However, while these actions are trivial, their consequences are not.
Unfortunately, Hadoop does not offer a way to terminate a TaskTracker in a manner that allows current tasks to finish and allows the output from previous tasks to be saved. The destruction of currently-running tasks has minor consequences. However, the inability to save the output from previous tasks has serious implications for our approach. As discussed in Chapter 2, TaskTrackers store the output of the Map tasks on the local disk. In our hybrid cluster design, as described in Chapter 3, we redirect this local storage to a parallel filesystem (MooseFS), but Hadoop is unaware of this change and it assumes that the intermediate data is still on the local disk of the terminated TaskTracker. Presently, Hadoop offers the functionality to notify the JobTracker that a TaskTracker will be going offline, but this action simply marks the TaskTracker as immediately failed, and the behavior for failed TaskTrackers is to recompute all of the Map tasks that have ever been completed. This occurs because of the nature of the local storage of intermediate data: if a TaskTracker has failed, the host node itself is assumed to have failed, and the intermediate data will not be available for retrieval by Reduce tasks. Furthermore, even if intermediate data has already been Shuffled, Hadoop does not keep track of it and therefore assumes it is lost when the TaskTracker goes offline.
(a): Marginal gains to runtime
(b): Marginal gains to energy
Figure 4.4: Example marginal gains from adding additional nodes to a Hadoop cluster. Marginal gains are the improvement in performance yielded from each added node. Shown for Wordcount MapReduce job under no foreground load, with both dedicated and hybrid cluster configurations.
unavailable.
appreciation of the work required for re-computation, and is discussed in Section 4.10.
4.5
Energy Model Generation
To model hardware energy usage, we examined recent publications and the dynamic power range of the three major hardware subsystems in modern computers: CPU, memory and disk. Based on the results of our investigations, we ultimately selected to model CPU alone, as our hardware only exhibited a high dynamic range for this subsystem. As a component of future work, we plan to relax this assumption and to model memory and disk, as well add additional prediction capabilities for specialist subsystems if necessary, such as GPU, Infiniband and SSDs.
4.5.1 CPU
Utilization is the primary driver of CPU power consumption[30, 56], and for older processors it is the most relevant metric. For newer processors, which have Dynamic Voltage and Frequency Scaling (DVFS) capabilities, the frequency and corresponding voltage level have relevance as well.
Under DVFS, the current frequency is dynamically selected in an online fashion, either by a kernel module or by a component of the BIOS, and changes over time in response to varying load. Higher utilization values typically correspond to higher frequency values, as the demand justifies additional energy expenditure. However, this correspondence is entirely dependent on the algorithm used to select frequency, and can vary widely depending on the algorithm used and the burstiness of the workload. Highlighting this variability, Figure 4.5 shows frequencies selected across the CPU utilization range for a quad-core Intel Xeon X3440 processor tested with CentOS 5.4’s defaultondemandgovernor.
Therefore, the metrics we choose to observe for creation of a CPU power model are:
• CPU utilization, collected using Xen monitoring tools
• CPU frequency, monitored using the
cpufreq-info
tool, if DVFS is available on the given architectureOther publications have made use of interrupt counts and other low-level processor metrics[27], but we found that the two higher-level metrics above are sufficient to yield acceptable accuracy as shown in Section 6.7.
Figure 4.5: Example behavior of the ondemand governor, which selects CPU frequency based on utilization patterns.
consumption available on the given hardware, from 0 to 100% on each core, allowing the hypervisor (or domain 0 in the case of Xen 3.4) to select the frequency that it believes is appropriate.
After repeating this process, we used least-squares linear regression to produce an energy model. In particular, we chose to use a curvilinear regression in the third degree for CPU utilization and in the first degree for CPU frequency. The equation produced by these choices is shown in Equation 4.1. We chose to use an equation of the third degree for CPU frequency because of the shape of the curves seen in Figure 1.2. Typically, utilization power curves show first or third degree behavior, and a third degree regression will easily handle a first degree relationship by weighting the second and third degree beta values very low. We chose first degree for frequency simply because it was weighted low in our regression. However, CPU frequency scaling is commonly used to reduce power consumption, and we believe that our hardware may gain abnormally small energy savings from using this technique, so we elected to keep it in the model.
We believe that these assumptions are safe to make, and if future processor architectures become available with more complex power curves, we can update our regression technique to compensate.
PowerC PU=Intercept+B1∗Utilization+B2∗Utilization2+B3∗Utilization3+B4∗Frequency (4.1)
4.5.2 Memory
and free/malloc traffic at the operating system level had no bearing on power consumption in our cluster, so we decided to investigate LLC misses further.
Determining LLC misses requires interfacing with processor performance counters, which presents unique difficulties in a virtualized environment. With one LLC counter per processor core, VM mul-tiplexing across cores by the hypervisor complicates ascertaining the source of the LLC misses. Nonetheless, tools exist to track hardware counters per VM, and we investigated two candidates which are complex but offer the desired functionality. Xenoprof[82]is an extension of the OProfile[65] profiling tool which provides both black box and white box hardware counter measurements for VMs. Perfctr-Xen[79]is a more recent tool which offers similar but more flexible capabilities as compared to Xenoprof via kernel and hypervisor patches.
Given the challenges associated with these tools, we decided against using them for our power model. We leave the inclusion of LLC misses in a comprehensive power model to future investigations.
4.5.3 Disk
Disk power has been simulated in prior publications[103], but is a fairly complex subject due to the behavior of modern disks. Not only do low-level mechanics need to be modeled, such as rotation speed, seek time, head movements and cache effects, but the access pattern needs to be known or available for simulation beforehand.
Based on the difficulty that we had with I/O prediction and simulation, described in Section 4.9, we elected to avoid estimation of disk power consumption. Instead, we assume that disk power has a low dynamic range and thus is represented in the idle power of our CPU model. While this approach has the potential of creating errors in energy prediction, it has been taken in prior work[30]and we feel that it is a fair compromise given the large degree of complexity in our I/O landscape.
4.6
MapReduce Job Profile Generation
Understanding how a MapReduce job performs on given hardware is critical to making accurate predictions about the scalability and effectiveness of volunteers. To gain this understanding as quickly as possible, we make use of a short profiling stage using only dedicated nodes during the body phase. The reason for this dedicated-only approach to profiling is that it gives us the purest example of workload behavior. It offers a 1:1 correspondence of TaskTrackers to disk subsystems, guaranteeing that I/O bottlenecks are at their minimum and eliminating any interference from foreground workloads. In other words, the behavior that we see during the profiling stage is the maximum possible performance that a volunteer could achieve, given no impediments such as I/O scalability and foreground load.
homoge-neous input data and low variability in Map task runtime, very short profiling stages are sufficient to capture typical activity. For jobs without this property, longer periods are needed to produce appro-priate averages. While our framework has the capability to empirically determine the homogeneity of input data, accuracy is highest after one full run of the job, which is typically much longer than that which is needed for a profiling period. For our purposes, the profiling of a MapReduce job consists of two separate components: characterizing general CPU behavior, and recording disk throughput.
4.6.1 CPU
We capture two primary CPU metrics during the profiling period: average CPU utilization and the processing rateof input data.
Average CPU utilization is important because it represents the maximum CPU demand of the MapReduce workload, and offers us a way to quantify the impact of impediments on volunteer and dedicated node performance. For example, if the profiled CPU utilization is 75% and we estimate that the average foreground workload on a given volunteer will be 10%, then we can assume that the foreground workload will have no impact (100%−10%>75%). Further, this method of quantification can be used to judge the impact of I/O contention, by adjusting the expected CPU utilization given some sub-optimum level of sustainable I/O. These estimation techniques are discussed further in Section 4.9.
Processing rateis a metric that we use to determine the effectiveness of each CPU cycle available to the MapReduce job, and is described in Equation 4.2. In essence, it represents the performance of the cluster’s processors while completing the specific tasks required by the MapReduce workload.
While the immutability of this metric is not perfect, as discussed in Section 4.10, it has sufficient accuracy to allow our framework to convert available CPU cycles into runtime. Further, it has the desirable property of capturing non-input data behaviors, such as odd reading patterns or intermedi-ate data traffic. Although we judge processing rintermedi-ate in terms of input bytes, this accuracy is possible because the true performance bottleneck can still be expressed using input volume. For example, if the Map task design is such that all data in the input chunk is discarded except for the last byte, for which a long computation is performed, we will still capture the correct processing rate as long as the chunk size is homogeneous. In the case of large volumes of intermediate data causing contention during the profiling period, this interference will be reflected by a slower input processing rate since the input requests must wait in the disk queue. While scenarios exist that break this approach, it is a good coarse-grained metric that can be quickly captured during the profiling period and that has important applications in judging the overall throughput of a cluster.
4.6.2 Disk
As discussed in Section 4.9, we found that predicting cluster I/O behavior based on the profiling stage is too difficult and too inaccurate to be practical. However, at the beginning of a MapReduce job, we do not have the opportunity to observe I/O scalability in action, so during the profiling period we record the I/O throughput at the dedicated disks as a rough estimate of future volunteer demand. Later on, as we build our knowledge of the given workload and cluster layout, we replace this early estimate with a more grounded approach to estimating I/O scalability.
4.7
Volunteer Resource Availability Prediction
Predicting resource availability for volunteers is critical to assessing the value that a given volunteer will add to the cluster, both in terms of runtime and energy savings. In Section 4.7.1, we discuss the logic behind using CPU utilization for characterization, and, in Section 4.7.2, we discuss the approach used for prediction.
4.7.1 Foreground Load Characterization
Because our cluster design dictates that volunteers exist within residual CPU cycles left over by the foreground VMs, collecting data on foreground load behavior is crucial to making accurate predictions of volunteer performance.
CPU
CPU is the primary resource harvested from shared nodes, and understanding the current availability of cycles is important to accurately predict a volunteer’s potential contribution as well as I/O demands. We sample CPU utilization of foreground VMs on each shared node across the profiling period, and use this history to estimate future utilization and energy consumption.
Network
Although network bandwidth is also harvested at the shared nodes, we do not observe foreground utilization of this resource for two reasons.
First, the design of our cluster is such that volunteers will rarely use all local bandwidth, because the dedicated cluster will be unable to deliver I/O at such a high rate. This follows from the following assumptions that we make about the cluster:
• the volunteer pool is generally at least as large as the dedicated pool
• the network speed is at least 100Mbit
Under these assumptions, the only way that one direction (inbound or outbound) of a shared node’s full-duplex network link can be fully occupied is if the volunteer’s I/O demand is 100Mbit in one direction and the following conditions hold:
1. The workload must have a very low computation component, such that 100Mbit data rates are constrained by I/O and not CPU
2. The dedicated:volunteer ratio must be at or very close to 1:1, such that a single volunteer is reading/writing from each dedicated node
3. The dedicated disk must be able to sustain 200+Mbit of throughput, with 100Mbit demanded by the volunteer and the remainder by the local (dedicated) TaskTracker
MapReduce jobs which produce this combination of factors are outside the scope of this project. As discussed in Section 5.3, we have targeted MapReduce jobs which are marginally compute-intensive and not wholly dependent on I/O, as our diskless volunteer architecture is not well-suited to handle these demands.
Second, the foreground applications which are described in Section 5.1 do not have heavy band-width requirements and are unlikely to need more than a small portion of a 100Mbit or 1Gbit link.
As a component of future work, we plan to examine the effect of network topology and heteroge-neous network speeds, which will require a more intelligent approach in this area.
Memory and Disk
As discussed in Sections 3.2.2 and 3.2.3, we presently offer no functionality for sharing memory and disk with foreground VMs. As such, the availability of these resources is not considered when placing a volunteer on a shared node.
4.7.2 Volunteer Resource Availability Prediction
Based on the foreground VM CPU history collected during each period, we estimate the availability of CPU cycles on each volunteer node for the length of the MapReduce job. The first period is collected during the MapReduce profiling stage, and subsequent periods are collected and analyzed in an online fashion.
using the foreground VM. A component of future work is the enhancement of this technique to estimate future cycle availability in a more intelligent way.
In addition, the burstiness of the foreground workload and its impact on the volunteer is an area which warrants further study. Ideally, burstiness should only negatively affect the volunteer if it occurs at the end of a MapReduce job by causing the volunteer to straggle. The effect should be minimal mid-job, due to the batch nature of MapReduce and the timescales of the MapReduce job relative to typical burst lengths. However, the affect of any burstiness on the Hadoop framework and its underlying JVM is not well-understood, and needs evaluation.
4.8
Volunteer Count Enumeration
The Volunteer Count Enumeration module generates the possible volunteer pool sizes which should be considered in subsequent calculations. For each potential pool size, calculations are performed in all subsequent modules, from Volunteer Resource Availability Prediction to Energy Prediction. This is illustrated in Figure 4.3 with the curly brace extending from the Volunteer Count Enumeration module. Repeating this process for each volunteer count allows our framework to:
• account for individual foreground users at each shared node
• estimate the I/O bottleneck that will be experienced due to additional volunteer demand
• estimate runtime gains from an additional volunteer
• ultimately determine the point of minimum energy consumption
Presently, we use administrator-set limits to determine which counts to enumerate. A component of future work is altering our enumeration approach to intelligently select volunteer counts in an autonomous fashion.
4.9
I
/
O Bottleneck Compensation
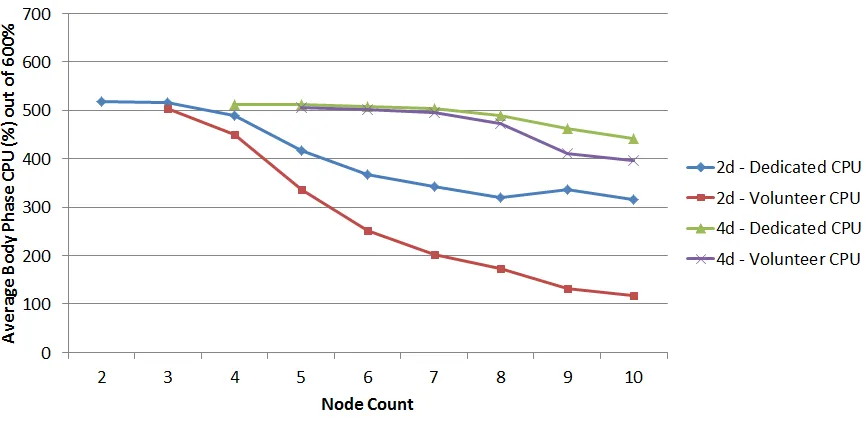
I/O bottlenecks, primarily at the dedicated disks, have a significant impact on the productivity of volunteers. Figure 4.6 shows the impact of I/O bottlenecks due to increased volunteer counts, as manifested by lower volunteer CPU utilization averages. Since there is no foreground load in this example, the decrease in CPU consumption can only be due to an inability of the dedicated cluster to service volunteer I/O demand, whether reading input data or writing intermediate data.
![Figure 2.1:Hadoop MapReduce overview. Image credit: Yahoo! Developer Network Hadoop Tutorial- Module 4 [78].](https://thumb-us.123doks.com/thumbv2/123dok_us/1405290.1173152/22.612.94.540.73.457/figure-hadoop-mapreduce-overview-developer-network-hadoop-tutorial.webp)
![Figure 2.2: Apache VCL overview. Image credit: Apache VCL Conceptual Overview [8].](https://thumb-us.123doks.com/thumbv2/123dok_us/1405290.1173152/25.612.150.475.248.476/figure-apache-overview-image-credit-apache-conceptual-overview.webp)