DEVELOPMENT OF EVALUATION METHOD FOR SEISMIC
ISOLATION SYSTEMS OF NUCLEAR POWER FACILITIES
-SEISMIC PRA FOR THE SEISMIC ISOLATED NUCLEAR
PLANT-Go Tanaka1, Masakazu Jimbo1, Takashi Ueki1, Akihito Otani2, Teruyoshi Otoyo2,
Ryusuke Haraguchi3, Kunihiko Sato3, Tetsuo Imaoka4, Shigenobu Onishi5
1
Toshiba Corporation Power Systems Company, Japan 2
IHI Corporation, Japan 3
Mitsubishi Heavy Industries, Ltd., Japan 4
Hitachi-GE Nuclear Energy, Ltd., Japan 5
Chubu Electric Power Co. Inc., Japan
ABSTRACT
This study is part of a series titled “Development of an evaluation method for seismic isolation systems of nuclear power facilities”. In this study, a seismic level 1 probabilistic risk assessment (PRA) was performed for a nuclear power plant equipped with a seismic isolation system in order to evaluate its effects under the design basis and also design extension conditions. The study also clarifies the risk feature of the seismically isolated plant and suggests ways to improve the plant reliability by comparing the results of PRA with those of a conventional nuclear power plant.
INTRODUCTION
The study series titled “Development of an evaluation method for seismic isolation systems of nuclear power facilities” has developed methods to estimate the performance characteristics of the isolation system and crossover pipes between an isolated building and a non-isolated building, and the effects on the plant. In addition, risk studies have been conducted for facilities, such as fragility analysis for the important components for safe shutdown of the plant. However, a study on the total risk for the plant has not yet been performed. Therefore, this study carries out a seismic level 1 PRA to quantify the effects of installing the seismic isolation system in the nuclear power plant and identifies the weaknesses by calculating the core damage frequency (CDF) and Fussell Vesely (FV) importance.
METHOD
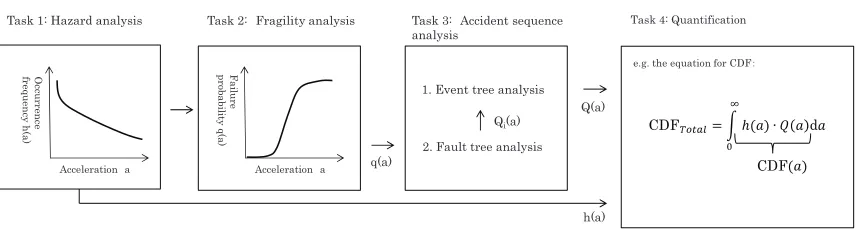
Figure 1. Evaluation process of level 1 seismic PRA
Task 1: Hazard analysis
In this task, the seismic hazard curve, which is the annual probability of exceedance of the seismic acceleration a, is evaluated, and then used to calculate the seismic frequency, h(a).
Task 2: Fragility analysis
In this task, the responses of the building and equipment to earthquake motion are evaluated. From this, the conditional failure probability of the building or equipment at each seismic acceleration (fragility curve) is calculated as q(a).
Task 3: Accident sequence analysis
This task includes the following two subtasks.
Subtask 1: Event tree analysis
Event trees are developed to identify accident sequences leading to core damage. Also, Q(a), which is the conditional core damage probability of the plant at a seismic acceleration a, is calculated by using the inputs obtained through the next subtask 2.
Subtask 2: Fault tree analysis
Fault trees are developed for a system i whose failure affects the plant operation, or for a system i for plant safe shutdown to calculate its failure probability Qi(a) at acceleration a with the fragility data q(a) evaluated in task 2.
Task 4: Quantification
To obtain CDF at a seismic acceleration a, CDF(a), Q(a) is multiplied by seismic frequency, h(a), and CDF(a) are integrated over all seismic accelerations:
!"#$%& ' ($%& ) *$%& (1)
!"#+,+-.' / !"#$%&10 23 (2)
O cc u rr en ce fr eq u en cy h (a ) Acceleration a
Task 1: Hazard analysis Task 4: Quantification
e.g. the equation for CDF䠖
q(a) Q(a) h(a) F a ilu re p ro b a b ili ty q (a )
Task 2: Fragility analysis
Acceleration a
1. Event tree analysis
2. Fault tree analysis
Qi(a)
Task 3: Accident sequence analysis
h(a): seismic frequency of a seismic acceleration a
where,
h(a): seismic frequency at acceleration a
Q(a): conditional core damage probability at acceleration a CDF(a): core damage frequency at acceleration a
CDFtotal: core damage frequency over all accelerations
Also, FV importance is evaluated by:
#4 ' !"#+,+-.56
!"#+,+-.
7 (3)
where,
CDFtotal, i: core damage frequency due to failure of component i CDFtotal: total core damage frequency
PRA MODEL
The event trees and fault trees for PWR and BWR plants are developed based on the following assumptions:
! Only the reactor building is seismically isolated.
! Even though some of the seismic isolation devices composing the isolation system are destroyed partly or completely by an earthquake, they are all considered to be unreliable (perfect correlation).
! The influence of failure of the reactor building itself is ignored since its failure probability is much lower than that of the seismic isolation system.
! Random failures of mitigation systems are ignored.
! Failure of any critical components for which fragility analysis is performed leads to core damage.
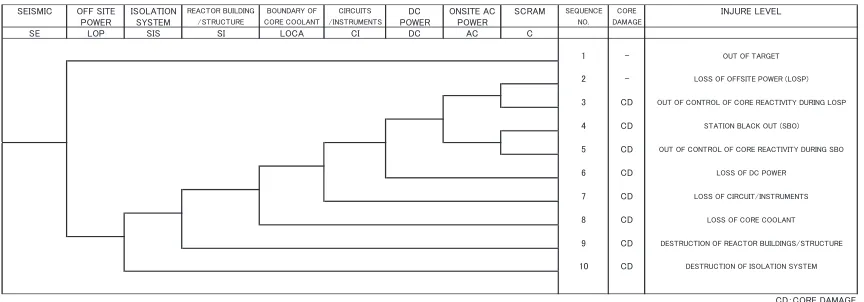
For example, the developed event tree and fault tree for failure of the reactor building or structures for the seismically isolated BWR plant are shown in Figures 2 and 3 respectively. In this case, eight sequences are recognized as accident sequences.
sequence 3: In this sequence, failure of control of core reactivity occurs during loss of offsite power (LOSP*) since the systems for scram function or components inside RPV whose destruction results in interrupting scram function are seismically destroyed even though other structures such as seismic isolation system, reactor building, primary containment vessel (PCV) and reactor pressurized vessel (RPV) survive, and onsite power is available.
*: If LOSP is not caused by an earthquake, other critical components for safe shutdown must survive such earthquake since offsite power system is one of the seismically weakest systems. Under such condition, core damage should not occur.
sequence 5: In this sequence, failure to control core reactivity occurs during SBO since the AC power systems lose their functions because of an earthquake, and additionally, scram simultaneously fails because of loss of the scram system or interruption caused by destruction of the structures inside RPV.
sequence 6: In this sequence, loss of onsite DC power occurs because of an earthquake, which results in loss of almost all mitigation systems and then core damage.
sequence 7: In this sequence, loss of circuit or instruments for mitigation systems is caused by an earthquake, which results in loss of almost all mitigation systems and then core damage.
sequence 8: In this sequence, such loss of coolant (LOCA) occurs that it is impossible to mitigate because of destruction of pipes connecting to RPV in PCV by an earthquake, which results in core damage.
sequence 9: In this sequence, destruction of the reactor building or important structures for the plant such as PCV, RPV and suppression pool occurs because of an earthquake, which results in LOCA and simultaneously loss of mitigation systems, and then core damage occurs.
sequence 10: In this sequence, destruction of the seismic isolation system occurs because of an earthquake, which results in destruction of other structures on it such as the reactor building and PCV, and finally leads to core damage. This sequence is specific to the seismically isolated plant, and this is the only difference between the conventional plant and the seismically isolated plant.
On the other hand, in sequences 1 and 2, core damage should not occur since many mitigation systems are available.
Figure 2. Example of the event tree (BWR plant)
The fault tree in Figure 3 is for failure of the reactor building or critical structures composing the plant such as PCV and RPV. It is conservatively assumed that destruction of each structure due to an earthquake results in core damage since actual effects on the plant have not been clarified sufficiently.
㻿㻱㻵㻿㻹㻵㻯 㻻㻲㻲㻌㻿㻵㼀㻱 㻵㻿㻻㻸㻭㼀㻵㻻㻺 㻾㻱㻭㻯㼀㻻㻾㻌㻮㼁㻵㻸㻰㻵㻺㻳 㻮㻻㼁㻺㻰㻭㻾㼅㻌㻻㻲 㻯㻵㻾㻯㼁㻵㼀㻿 㻰㻯 㻻㻺㻿㻵㼀㻱㻌㻭㻯 㻿㻯㻾㻭㻹 㻿㻱㻽㼁㻱㻺㻯㻱 㻯㻻㻾㻱 㻵㻺㻶㼁㻾㻱㻌㻸㻱㼂㻱㻸 㻼㻻㼃㻱㻾 㻿㼅㻿㼀㻱㻹 㻛㻿㼀㻾㼁㻯㼀㼁㻾㻱 㻯㻻㻾㻱㻌㻯㻻㻻㻸㻭㻺㼀 㻛㻵㻺㻿㼀㻾㼁㻹㻱㻺㼀㻿 㻼㻻㼃㻱㻾 㻼㻻㼃㻱㻾 㻺㻻㻚 㻰㻭㻹㻭㻳㻱
㻿㻱 㻸㻻㻼 㻿㻵㻿 㻿㻵 㻸㻻㻯㻭 㻯㻵 㻰㻯 㻭㻯 㻯
㻝 㻙 㻻㼁㼀㻌㻻㻲㻌㼀㻭㻾㻳㻱㼀 㻞 㻙 㻸㻻㻿㻿㻌㻻㻲㻌㻻㻲㻲㻿㻵㼀㻱㻌㻼㻻㼃㻱㻾㻌㻔㻸㻻㻿㻼㻕
㻟 㻯㻰 㻻㼁㼀㻌㻻㻲㻌㻯㻻㻺㼀㻾㻻㻸㻌㻻㻲㻌㻯㻻㻾㻱㻌㻾㻱㻭㻯㼀㻵㼂㻵㼀㼅㻌㻰㼁㻾㻵㻺㻳㻌㻸㻻㻿㻼 㻠 㻯㻰 㻿㼀㻭㼀㻵㻻㻺㻌㻮㻸㻭㻯㻷㻌㻻㼁㼀㻌㻔㻿㻮㻻㻕
㻡 㻯㻰 㻻㼁㼀㻌㻻㻲㻌㻯㻻㻺㼀㻾㻻㻸㻌㻻㻲㻌㻯㻻㻾㻱㻌㻾㻱㻭㻯㼀㻵㼂㻵㼀㼅㻌㻰㼁㻾㻵㻺㻳㻌㻿㻮㻻 㻢 㻯㻰 㻸㻻㻿㻿㻌㻻㻲㻌㻰㻯㻌㻼㻻㼃㻱㻾
㻣 㻯㻰 㻸㻻㻿㻿㻌㻻㻲㻌㻯㻵㻾㻯㼁㻵㼀㻛㻵㻺㻿㼀㻾㼁㻹㻱㻺㼀㻿
㻤 㻯㻰 㻸㻻㻿㻿㻌㻻㻲㻌㻯㻻㻾㻱㻌㻯㻻㻻㻸㻭㻺㼀 㻥 㻯㻰 㻰㻱㻿㼀㻾㼁㻯㼀㻵㻻㻺㻌㻻㻲㻌㻾㻱㻭㻯㼀㻻㻾㻌㻮㼁㻵㻸㻰㻵㻺㻳㻿㻛㻿㼀㻾㼁㻯㼀㼁㻾㻱
㻝㻜 㻯㻰 㻰㻱㻿㼀㻾㼁㻯㼀㻵㻻㻺㻌㻻㻲㻌㻵㻿㻻㻸㻭㼀㻵㻻㻺㻌㻿㼅㻿㼀㻱㻹
Figure 3. Example of the fault tree (BWR plant)
Inputs for quantification are summarized below.
Seismic hazard
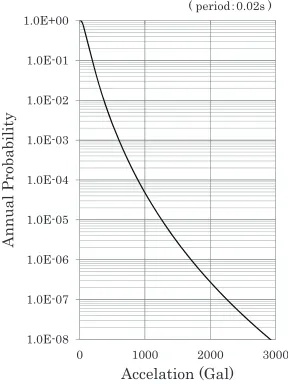
Typical hazard data at a certain nuclear power plant site in Japan are used (shown in Figure 4).
Figure 4. Seismic hazard curve
Fragility
The fragility data of the most critical components for core damage estimated in another paper [1] are used. The failure probabilities for other components are ignored. Additionally, the possibility of destruction of the reactor building is not considered. The fragility data are shown in Tables 1 and 2 for the PWR plant and the BWR plant, respectively.
1.0E-08 1.0E-07 1.0E-06 1.0E-05 1.0E-04 1.0E-03 1.0E-02 1.0E-01 1.0E+00
0 1000 2000 3000
A
n
n
u
a
l
P
ro
b
a
b
il
it
y
Table 1: Fragilities for components of PWR plant
Component Seismically isolated plant
(Am*1, !r*2, !u*3, HCLPF*4)
Component A 1.80, 0.15, 0.15, 1.11
Component B 2.60, 0.13, 0.13, 1.67
Component C 1.93, 0.10, 0.10, 1.41
Auxiliary component A 2.12, 0.07, 0.07, 1.67
Auxiliary component B 1.94, 0.07, 0.07, 1.55
Electric board A 2.47, 0.14, 0.23, 1.34
Electric board B 1.67, 0.07, 0.15, 1.16
Electric board C 2.26, 0.14, 0.23, 1.22
Electric board D 2.26, 0.14, 0.23, 1.22
Main steam pipe (crossover pipe) 5.26, 0.134*5, 3.84
Cooling seawater pipe (crossover pipe) 8.83, 0.203*5, 5.50
Seismic isolation system 1.81, 0.075*5, 1.52
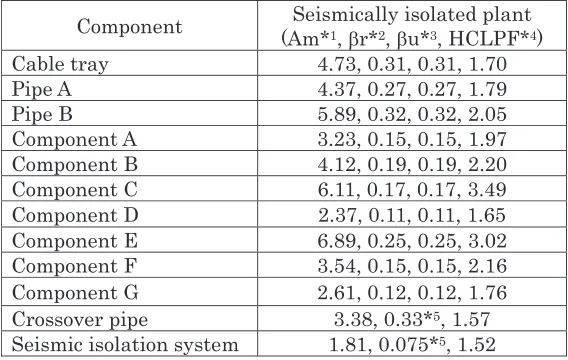
*1: acceleration in G corresponding to median failure probability with 50% confidence level *2: logarithmic standard deviation for aleatory uncertainty
*3: logarithmic standard deviation for epistemic uncertainty
*4: acceleration in G corresponding to low failure probability (5%) with high confidence (95%) level *5: combined logarithmic standard deviation, 89' :;<= ;>
Table 2: Fragilities for components of BWR plant
Component Seismically isolated plant
(Am*1, !r*2, !u*3, HCLPF*4)
Cable tray 4.73, 0.31, 0.31, 1.70
Pipe A 4.37, 0.27, 0.27, 1.79
Pipe B 5.89, 0.32, 0.32, 2.05
Component A 3.23, 0.15, 0.15, 1.97
Component B 4.12, 0.19, 0.19, 2.20
Component C 6.11, 0.17, 0.17, 3.49
Component D 2.37, 0.11, 0.11, 1.65
Component E 6.89, 0.25, 0.25, 3.02
Component F 3.54, 0.15, 0.15, 2.16
Component G 2.61, 0.12, 0.12, 1.76
Crossover pipe 3.38, 0.33*5, 1.57
Seismic isolation system 1.81, 0.075*5, 1.52
*1~5: see Table 1 notes
RESULTS and DISCUSSION
The results of the PRA for PWR plant and BWR plant are shown in Tables 3, 4 and 5.
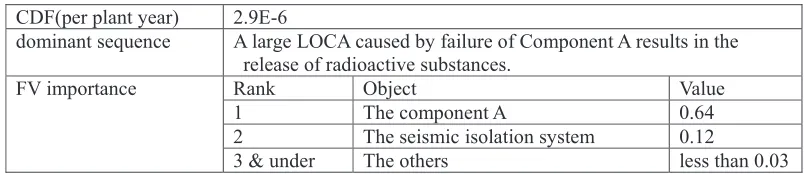
CDF is estimated as 2.9E-6 per reactor year which is comparable to a conventional PWR plant in Japan whose CDF is around 2.8E-6 per reactor year despite using severer hazard data than that of the aseismic PWR plant site. This is because the fragilities of the components of the seismically isolated plant are improved, thereby decreasing their failure probabilities. According to FV importance, the event that has the highest contribution to CDF is the failure of Component A having the lowest seismic capacity. The failure of a component causing a large loss of coolant accident (LOCA) exceeding the mitigating capability of the emergency core cooling systems (ECCSs) results in the release of radioactive substances. The event with the second-highest contribution to CDF is the failure of the seismic isolation system causing an accident sequence specific to the seismically isolated plant.
Additionally, sensitivity analysis is performed, taking into consideration the design improvement of Component A against vertical vibration that is amplified by the isolation system and so is a crucial factor for the fragility of main Component A. The results are shown in Table 2. CDF changes to 1.4E-6 per plant year. Besides, the failure of the seismic isolation system has the highest contribution to CDF.
Table 3: Analysis results for PWR plant
CDF(per plant year) 2.9E-6
dominant sequence A large LOCA caused by failure of Component A results in the release of radioactive substances.
FV importance Rank Object Value
1 The component A 0.64
2 The seismic isolation system 0.12
3 & under The others less than 0.03
Table 4: Sensitivity analysis results for PWR plant
CDF(per plant year) 1.4E-6
dominant sequence The failure of the seismic isolation system leading to destruction of the reactor building and loss of the critical components of the seismically isolated plant.
FV importance Rank Object Value
1 The seismic isolation system 0.32
2 The component A 0.22
3 & under The others less than 0.08
Results for BWR plant
damaged simultaneously, while breaking of the seawater pipe might cause only SBO with loss of function of some mitigation systems activated by AC power.
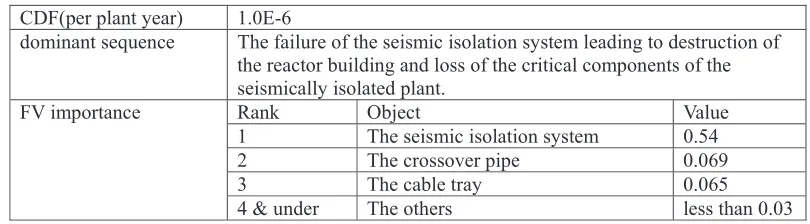
The above results indicate characteristics similar to those indicated by the sensitive analysis result of the PWR plant.
Table 5: Analysis results for BWR plant
CDF(per plant year) 1.0E-6
dominant sequence The failure of the seismic isolation system leading to destruction of the reactor building and loss of the critical components of the seismically isolated plant.
FV importance Rank Object Value
1 The seismic isolation system 0.54
2 The crossover pipe 0.069
3 The cable tray 0.065
4 & under The others less than 0.03
CONCLUSION
The results of the PRA for PWR and BWR plants show that installation of the seismic isolation system for nuclear plants improves their reliability. However, the unique accident sequence caused by failure of the seismic isolation system has the highest contribution to CDF for both types of plants. Therefore, in order to improve plant reliability, it is necessary to develop a fail-safe seismic isolation system or to perform fragility analysis for the system itself in greater detail.
ACKNOWLEDGEMENT
This technology development has been carried out as the Japan national project “Development for Evaluation Methods of Seismic Isolation Systems” with the participation of Chubu Electric Power, Japan Atomic Power, Hokkaido Electric Power, Tohoku Electric Power, Tokyo Electric Power, Hokuriku Electric Power, Kansai Electric Power, Chugoku Electric Power, Shikoku Electric Power, Kyushu Electric Power, J Power, Toshiba, Hitachi-GE Nuclear Energy, Mitsubishi Heavy Industries, and the Institute of Applied Energy. We thank Dr. Nishikawa, professor emeritus at Tokyo Metropolitan University; Dr. Kubo, professor emeritus at the University of Tokyo; Dr. Fujita, professor emeritus at the University of Tokyo, Dr. Kasahara, a Professor at the University of Tokyo; and Dr. Yabana, Central Research Institute of Electric Power Industry for their advice.
REFERENCES
[1]Haraguchi, R. et.al. (2015). “Development of an evaluation method for seismic isolation systems of nuclear power facilities - Seismic fragility evaluation of equipment -”, SMiRT23, Manchester [2]Atomic Energy Society of Japan. (2007). “Implementation Standard Concerning the Seismic