Scholarship at UWindsor
Scholarship at UWindsor
Electronic Theses and Dissertations Theses, Dissertations, and Major Papers
2012
Development, validation, and reliability of the Kinect-Ed survey
Development, validation, and reliability of the Kinect-Ed survey
tools
tools
Ashley Kirby
University of Windsor
Follow this and additional works at: https://scholar.uwindsor.ca/etd
Recommended Citation Recommended Citation
Kirby, Ashley, "Development, validation, and reliability of the Kinect-Ed survey tools" (2012). Electronic Theses and Dissertations. 5581.
https://scholar.uwindsor.ca/etd/5581
This online database contains the full-text of PhD dissertations and Masters’ theses of University of Windsor students from 1954 forward. These documents are made available for personal study and research purposes only, in accordance with the Canadian Copyright Act and the Creative Commons license—CC BY-NC-ND (Attribution, Non-Commercial, No Derivative Works). Under this license, works must always be attributed to the copyright holder (original author), cannot be used for any commercial purposes, and may not be altered. Any other use would require the permission of the copyright holder. Students may inquire about withdrawing their dissertation and/or thesis from this database. For additional inquiries, please contact the repository administrator via email
122
By:
Ashley R. Kirby
A Thesis
Submitted to the Faculty of Graduate Studies through the Faculty of Human Kinetics in Partial Fulfillment of the Requirements for the Degree of Master of Human Kinetics at the
University of Windsor
Windsor, Ontario, Canada 2012
122
by
Ashley R. Kirby
APPROVED BY:
______________________________________________ Dr. D. Jackson
Department of Psychology
______________________________________________ Dr. K. Chandler
Department of Kinesiology
_____________________________________________ Dr. S. Woodruff, Advisor
Department of Kinesiology
______________________________________________ Dr. T. Loughead, Chair of Defense
Department of Kinesiology
122
DECLARATION OF ORIGINALITY
I hereby certify that I am the sole author of this thesis and that no part of this
thesis has been published or submitted for publication.
I certify that, to the best of my knowledge, my thesis does not infringe upon
anyone’s copyright nor violate any proprietary rights and that any ideas, techniques,
quotations, or any other material from the work of other people included in my thesis,
published or otherwise, are fully acknowledged in accordance with the standard
referencing practices. Furthermore, to the extent that I have included copyrighted material
that surpasses the bounds of fair dealing within the meaning of the Canada Copyright
Act, I certify that I have obtained a written permission from the copyright owner(s) to
include such material(s) in my thesis and have included copies of such copyright
clearances to my appendix.
I declare that this is a true copy of my thesis, including any final revisions, as
approved by my thesis committee and the Graduate Studies office, and that this thesis has
ABSTRACT
To assess the future success of the Kinect-Ed nutrition and cooking intervention, the
purpose of the current study was to develop the Kinect-Ed pre-test, post-test, and parental
surveys, establish content and face validity, as well as test-retest reliability and internal
consistency. Content validity was examined using an expert panel (n=7) and face validity using
cognitive interviews (n=8). Test-retest reliability of the Kinect-Ed pre-test (n=129) and post-test
(n=107) was completed with young adolescents (9-14 years), while the parent survey was
followed up a telephone interview (n=20 parents). Test-retest correlations ranged from
.499-1.000 with the majority of t-tests revealing non-significant differences while the chi square
analyses revealed significant associations (Phi= .377-1.000). Results indicate that the Kinect-Ed
surveys have content and face validity and are reliable and, therefore, can be used in the
upcoming years to examine the effectiveness of the program for improving family meals, food
ACKNOWLEDGEMENTS
First, this thesis would not have been possible without the guidance and support of my
advisor, Dr. Sarah Woodruff. Sarah, thank you for seeing the potential in me and accepting me as
your first graduate student, for that I will always be grateful. The last two years have been a great
experience, thank you!
To my committee members Dr. Krista Chandler and Dr. Dennis Jackson, thank you for
your comments and suggestions. You both have been valuable resources and I thank you for your
contributions to my thesis.
To Sandi Richard, thank you for allowing me to be a part of the Kinect-Ed program. Your
enthusiasm for this is evident and I know the program will be successful in the future.
I would like to thank my fellow graduate students from room 220: Jill, Brad and Neil for
your encouragement and laughs, a special thank you to Jill for your help with data collection. I
would also like to thank Sara Santarossa for her help during participant recruitment and data
collection your hard work was much appreciated. Lastly, thank you to Jodi for listening to all
things thesis related throughout this process and for your continuous support and encouragement.
I would like to thank the participants for this project, those who were part of the expert
panel, and especially all of the centers who took time out of their busy schedules and allowed me
to visit their locations to collect data (YMCA after-school programs, Town of Essex, Rose City
Gymnastics, Windsor Essex Swim Team, and the Windsor-Essex Catholic District School
Board).
Lastly, I would especially like to acknowledge my parents for their continuous love and
122
confidence needed to do so. If it was not for your patience, guidance and support I would not be
122
TABLE OF CONTENTS
DECLARATION OF ORIGINALITY ... iii
ABSTRACT ... iv
ACKNOWLEDGEMENTS ... v
LIST OF TABLES ... xi
LIST OF APPENDICES ... xii
LIST OF ABBREVIATIONS ... xiii
RESEARCH ARTICLE ... 1
Introduction ... 1
Family Meals ... 1
Food Preparation ... 2
Kinect-Ed Program ... 3
Purpose ... 4
Methods ... 4
Phase 1: Survey Development ... 5
Parental Survey ... 6
Pre-Test Survey ... 7
Post-Test Survey ... 10
Phase 2: Content Validity ... 13
Methods ... 13
Participants ... 14
122
Kinect-Ed parent survey ... 14
Kinect-Ed pre-test survey ... 14
Kinect-Ed post-test survey ... 14
Phase 3: Face Validity ... 15
Methods ... 15
Participants ... 15
Results ... 16
Kinect-Ed pre-test survey ... 16
Kinect-Ed post-test survey ... 16
Phase 4: Test-Retest Reliability ... 17
Methods ... 17
Validity of the sample size. ... 17
Data Analysis ... 18
Test-retest reliability. ... 18
Internal consistency reliability. ... 19
Participants ... 19
Results ... 20
Kinect-Ed Pre-Test Survey. ... 20
Kinect-Ed Post-Test Survey. ... 25
Internal Consistency Reliability ... 29
Phase 5: Parent Survey and Follow-Up Interview ... 29
122
Participants ... 30
Results ... 30
Face Validity ... 30
Discussion ... 31
Validity ... 31
Reliability ... 32
Parent survey ... 36
Future Directions ... 37
Limitations ... 38
Conclusion ... 40
References ... 42
REVIEW OF LITERATURE ... 50
Child Obesity ... 50
Energy balance ... 52
Physical Activity and Sedentary Behaviours ... 52
Nutrition ... 54
Food Behaviours ... 55
Beverage Consumption ... 55
Snacking ... 57
Meal Skipping ... 58
Fast Food Consumption ... 59
122
Definition and Prevalence ... 62
Family Meals and Food Intake ... 63
Family Meals and Other Behaviours ... 64
Family Meal Environment ... 65
Food Preparation and Cooking Interventions ... 66
Kinect-Ed Program ... 71
Nutrition Assessment ... 72
Methods of Evaluating Food Consumption ... 74
Measuring Food Consumption of Individuals ... 76
Quantitative methods ... 76
Qualitative methods ... 77
Validity ... 78
Content validity ... 78
Face validity ... 79
Other types of validity ... 79
Reliability ... 80
Test-retest reliability ... 80
Internal consistency reliability ... 82
Other types of reliability ... 83
References ... 84
APPENDICES ... 102
122
LIST OF TABLES
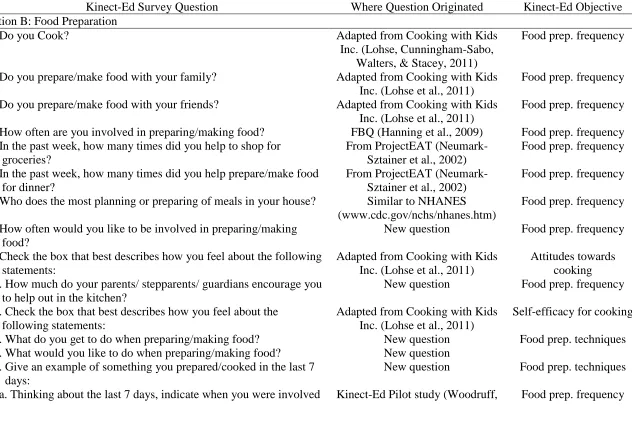
Table 1.Origination of the Kinect-Ed Pre-Test survey questions...8
Table 2.Origination of the Kinect-Ed Post-Test survey questions...12
Table 3.Test-Retest Reliability Scores of Kinect-Ed Pre-Test Survey Demographics
Section...21
Table 4.Test-Retest Reliability Scores of Kinect-Ed Pre-Test Survey Food Preparation and
Family Meal Section...22
Table 5.Test-Retest Reliability Scores of Kinect-Ed Post-Test Survey Sandi Richard’s Visit
Section...26
Table 6.Test-Retest Reliability Scores of Kinect-Ed Post-Test Survey Did Cook One of Sandi
Richard’s Recipes Section...27
Table 7.Test-Retest Reliability Scores of Kinect-Ed Post-Test Survey Didn’t Cook One of Sandi
122
LIST OF APPENDICES
APPENDIX A Kinect-Ed Parent Survey Content Validity Version………102
APPENDIX B Kinect-Ed Pre-Test Survey Content Validity Version……….104
APPENDIX C Kinect-Ed Post-Test Survey Content Validity Version………...110
APPENDIX D Expert Recruitment Email………118
APPENDIX E Expert Letter of Information and Consent Form……….119
APPENDIX F Content Validity Survey Changes………121
APPENDIX G Kinect-Ed Face Validity Surveys……….………123
APPENDIX H Parent Letter of Information and Consent Form for Validity…………..140
APPENDIX I Face Validity Interview Scripts……….…………..143
APPENDIX J Child Assent Form- Face Validity……….………..146
APPENDIX K Face Validity Survey Changes………...147
APPENDIX L Kinect-Ed Reliability Surveys ………148
APPENDIX M Parent Letter of Information and Consent Form for Reliability………..166
APPENDIX N Child Assent Forms- Reliability……….……….169
APPENDIX O Post-Test Reliability Scores……….………170
APPENDIX P Internal Consistency Reliability Scores……….………..172
APPENDIX Q Parent Interview Script……….………...174
122
LIST OF ABBREVIATIONS
BMI Body Mass Index
CCHS Canadian Community Health Survey
CFLRI Canadian Fitness and Lifestyle Research Institute
CPAG Canadian Physical Activity Guide
CSEP Canadian Society Exercise Physiology
LNDF Low nutrient dense food
METS Metabolic equivalent of a task
MVPA Moderate to vigorous physical activity
NHANES National Health and Nutrition Examination Survey
SCT Social Cognitive Theory
RESEARCH ARTICLE
Introduction
Due to the increase in childhood obesity rates researchers, clinicians, and health
professionals are currently striving to improve physical activity and nutritional
behaviours among children and adolescents (Ball & McCargar, 2003; Shields, 2005;
Tremblay, Katzmarzyk, & Willms, 2002). Physical activity rates of Canadian children
and adolescents have dramatically declined (Canadian Fitness and Lifestyle Research
Institute, CFLRI, 2009) with a sedentary lifestyle being adopted (Tremblay et al., 2011),
as only 7% of children and adolescents are meeting the recommendations proposed by the
Canadian Physical Activity Guide (CPAG; Colley et al., 2011). Overall diet quality of
children and adolescents is also concerning (Garriguet, 2006; Veugelers, Fitzegerald, &
Johnston, 2005; Woodruff & Hanning, 2010) and is likely impacting energy balance.
Family Meals
Studies have illustrated that eating dinner at home with family is associated with
increased nutrition among children and adolescents (Neumark-Sztainer et al., 2003;
Veugelers et al., 2005; Woodruff, Hanning, & McGoldrick, 2010a) such as a greater
consumption of fruits and vegetables as well as several beneficial nutrients such as fibre,
folate, calcium, iron, and vitamins B6, B12, and E and lower consumption of saturated and
trans fat as well as soda and fried foods (Gilman et al., 2000). Research has indicated
anywhere from one-quarter to two-thirds of children and adolescents consume family
meals on 5 to 7 days per week (Neumark-Sztainer, Hannan, Story, Croll & Perry, 2003;
Neumark-Sztainer, Larson, Fulkerson, Eisenberg, & Story, 2010; Woodruff, Hanning,
122
decrease with increasing age (Gillman et al., 2000) likely as a result of adolescents
gaining autonomy from the family. Family meals are not only associated with increased
nutrition behaviours, but increased frequency may also be associated with other health
constructs such as a decrease in high risk behaviour, negative associations with substance
abuse, depression/ suicide, violence and school problems (Esienberg, Olson,
Neumark-Sztainer, Story, Bearinger, 2004; Fulkerson, Neumark-Neumark-Sztainer, & Story, 2006).
Food Preparation
The importance of family meals is ranked high among parents (Boutelle et al.,
2001; Fulkerson et al. 2011), however, the increased number of dual working parent
families (Statistics Canada, 2010) often leads to a time constraint as a barrier for meal
preparation. Working parents suggested that they would like their children to be more
involved in meal preparation but often avoid involving their children due to the time
commitment and mess involved (Fulkerson et al., 2011). Children and adolescents who
are involved in food preparation are thought to have better diet quality than their peers
(Brown & Hermann, 2005; Larson, Story, Eisenberg, & Neumark-Sztainer, 2006) and
greater self-efficacy for healthy eating (Chu et al., 2012). The lack of food preparation
skills among this generation may result in scratch cooking skills being lost if parents
and/or schools fail to teach children and adolescents how to prepare food and meals
(Agriculture and Agri-Food Canada, 2005; Dougherty & Silver, 2007).
Due to the decline in diet quality and food preparation involvement, there has
recently been a greater focus on cooking interventions geared towards the children and
adolescents. However, there seems to be a lack of cooking interventions which are
122
involvement in preparing food. Many of the cooking interventions focus on improving
overall diet quality outcomes such as increasing fruit and vegetable consumption or food
preferences, rather than an increase in food preparation. Interestingly, two recent cooking
intervention studies, which mainly focused on participant’s involvement in food
preparation, have found an increased involvement in meal preparation (Blake, Smith,
Harmon, & Beets, 2012; Fulkerson et al., 2010).
Kinect-Ed Program
The potential to use cooking skills to teach nutrition and possibly improve
children’s and adolescent’s dietary intakes as well as family meal frequency has led to the
creation of the Kinect-Ed Program. The program was developed by Sandi Richard, a
Food Network Host and international best selling author, and Sarah Woodruff, a
professor at the University of Windsor. The program is based on Social Cognitive Theory
(SCT), recognizing the reciprocal relationship between the individual and their
environment (Bandura, 2004). The interaction between ones’ knowledge base, their
self-efficacy to change their behaviour, the goals and outcomes they foresee, and the
perceived facilitators and obstacles that may influence the change are important
considerations (Bandura, 2004). Further, the SCT posits that knowledge acquisition can
be directly related to observing others within the context of social interactions,
experiences, and outside media influences. Becoming more involved in food/dinner
preparation depends not only on the motivation of the individual to want to cook (or learn
how to cook), but also on the social norms of cooking/eating within the family context.
The Kinect-Ed program targets Canadian children from grades 6 to 8 with its
122
grade 6 to 8 age group was chosen since the frequency of family meals seems to decrease
after this age as young adolescents are trying to gain autonomy from their parents and are
beginning to make decisions for themselves. It is thought that if this age group gets
involved in cooking, family meals will improve which may result in better diet quality.
The Kinect-Ed program includes a motivational presentation consisting of information
and interactive demonstrations focusing mainly on the effects of consuming fat, sugar,
and salt. After the in-school visit, the program will continue on-line, which will feature
weekly discussions and how to videos from Richard, a guest celebrity of the week,
nutrient/food analysis software, and moderated asynchronous discussion boards. More
specifically, the objectives of the Kinect-Ed program include measuring and improving
participant’s food preparation frequency and techniques/skills, self-efficacy for cooking,
family meal frequency, family meal attitudes and behaviours, and their motivation to
cook based on the Kinect-Ed presentation.
Purpose
The purpose of this study was to develop the Kinect-Ed survey tools and establish
validity and reliability. The specific objectives of this study were: (1) to develop and
design a pre-test survey, post-test survey and parental survey, (2) establish content and
face validity of the surveys and (3) establish test-retest reliability and internal consistency
of the surveys.
Methods
This manuscript has been formatted into 4 phases, including (1) Survey
122
Parent survey and follow-up interview. Prior to data collection, all procedures were
approved by the University of Windsor Research Ethics Board.
For the purpose of this study, a shortened video was created by Sandi Richard to
introduce Kinect-Ed to those participating in phases 3 and 4 since a personal visit was not
possible. A ~12 minute video was pre-recorded by Sandi Richard, which included a
shortened version of the original presentation that will be delivered in future years. The
message was meant to be motivational and educational, with an overall attempt to get
participants excited about getting in the kitchen and helping out with food preparation for
themselves and their families.
Each participant in phase 3 and 4 also received a copy of the Teen Chefs
Cooking, Be In Charge Eat Forward booklet (Cooking For the Rushed Inc., 2012). This
booklet was developed by Sandi Richard and Sarah Woodruff as a resource tool for the
Kinect-Ed program. The booklet contains cooking tips, family-friendly recipes, and
healthy messages regarding food consumption and body image. Participants were
introduced to the booklet during the video presentation and were encouraged to bring it
home and share it with their family.
Phase 1: Survey Development
The three surveys were developed based on existing tools involving nutrition and
food behaviour studies: Project EAT (www.sph.umn.edu/epi/research/eat/index.asp), the
Food Behaviour Questionnaire (www.uwfbq.ca; Hanning et al., 2009), Cooking With
Kids (www.cookingwithkids.net; Lohse, Cunningham-Sabo, Walters, & Stacey, 2011),
and NHANES (www.cdc.gov/nchs/nhanes.htm). A literature search was conducted to
122
Kinect-Ed program. Questions were also taken from a pilot study (which was similar in
nature) conducted in May, 2011 among grade 6 and 7 students (n =154) from
Windsor-Essex County (Woodruff et al., 2012). Lastly, where suitable question were not available,
existing questions were modified or original questions were developed based on the
current objectives of the Kinect-Ed program.
Parental Survey
A short five question survey was developed (see Appendix A) based on the
current study objectives and designed to be distributed and collected with the parental
consent form. The purpose of this survey was to collect information regarding family
meal frequency and of family meal behaviours and attitudes, as well as to gauge how
comfortable parents are with having their children in the kitchen preparing meals. This
survey is a multiple response style survey where the parents need to check the most
appropriate answers.
The Kinect-Ed Parent Survey includes 4 questions and a tracking identifier (to be
able to match their survey with their child’s). The first question examines the frequency
of family dinner; two questions examine the parent’s comfort level with having their
children involved in meal preparation; and the final question examines attitudes and
behaviours of the family meal. Family meal frequency is responded to with 3 items
depicting the total number of days/week. The first of the two questions for parental
comfort is a 4 point Likert question (response options range from not comfortable to very
comfortable). The subsequent question asks parents for possible reasons for this comfort
level with several pre-determined responses and an option for “other” with space to
122
10 item question (responses range from strongly disagree to strongly agree on a 4 point
Likert Scale). The 11 items are split up into 5 categories; importance (2 items),
communication (2 items), scheduling (3 items), environment (3 items) and enjoyment (1
item) and will be summed and a score out of 40 will be calculated (i.e., higher numbers
indicate better family meals). The identical question is asked on the participants surveys
(see below for details).
Pre-Test Survey
The main goal of this survey was to establish baseline values for food preparation
frequency and techniques, family meal frequency, and family meal behaviours and
attitudes among children and adolescents. Data from this survey will provide researchers
with baseline data and the ability to measure the effects of the intervention (see Appendix
B).
The Kinect-Ed Pre-Test survey (see Table 1) contains 24 questions and is divided
into 3 sections. Section A, Demographics, has 6 questions specific to age, gender, grade,
ethnicity, who lives in their household, and whether adults are home in the early and late
evening. Section B, Food Preparation, contains 15 questions. The first 3 questions (#B1,
#B2, #B3) ask whether the individual cooks and who they cook with, responses range
from Yes, often to No, never. Four questions (#B4, #B6, #B8, #B15a) examine the
frequency of food preparation in different ways/time frames, and two questions (#B5,
#B7) ask about grocery store visits and meal planning. Question #B9 contains 5 items
which examine the individual’s attitudes towards food preparation on a 4 point Likert
scale (response options range from Really don’t like to Really like). Question #B10 asks
Table 1
Origination of Kinect-Ed Pre-Test Survey Questions
Kinect-Ed Survey Question Where Question Originated Kinect-Ed Objective
Section B: Food Preparation
1. Do you Cook? Adapted from Cooking with Kids
Inc. (Lohse, Cunningham-Sabo, Walters, & Stacey, 2011)
Food prep. frequency
2. Do you prepare/make food with your family? Adapted from Cooking with Kids
Inc. (Lohse et al., 2011)
Food prep. frequency
3. Do you prepare/make food with your friends? Adapted from Cooking with Kids
Inc. (Lohse et al., 2011)
Food prep. frequency
4. How often are you involved in preparing/making food? FBQ (Hanning et al., 2009) Food prep. frequency
5. In the past week, how many times did you help to shop for groceries?
From ProjectEAT (Neumark-Sztainer et al., 2002)
Food prep. frequency
6. In the past week, how many times did you help prepare/make food for dinner?
From ProjectEAT (Neumark-Sztainer et al., 2002)
Food prep. frequency
7. Who does the most planning or preparing of meals in your house? Similar to NHANES
(www.cdc.gov/nchs/nhanes.htm)
Food prep. frequency
8. How often would you like to be involved in preparing/making food?
New question Food prep. frequency
9. Check the box that best describes how you feel about the following statements:
Adapted from Cooking with Kids Inc. (Lohse et al., 2011)
Attitudes towards cooking 10. How much do your parents/ stepparents/ guardians encourage you
to help out in the kitchen?
New question Food prep. frequency
11. Check the box that best describes how you feel about the following statements:
Adapted from Cooking with Kids Inc. (Lohse et al., 2011)
Self-efficacy for cooking
12. What do you get to do when preparing/making food? New question Food prep. techniques
13. What would you like to do when preparing/making food? New question
14. Give an example of something you prepared/cooked in the last 7 days:
New question Food prep. techniques
15a. Thinking about the last 7 days, indicate when you were involved Kinect-Ed Pilot study (Woodruff, Food prep. frequency
122
in preparing/making food? Richard, Kirby, & Holash, 2012)
15b.When making meals, what type of food preparation do you get to do?
Kinect-Ed Pilot study (Woodruff et al., 2012)
Food prep. techniques
Section C: Family Meals
1. Typically, how many days per week do you eat dinner/supper with at least one parent/guardian?
FBQ (Hanning et al., 2009) Family meal frequency
2. How strongly do you agree or disagree with the following statements about mealtimes in your family?
Adapted from ProjectEAT (Neumark-Sztainer et al., 2002)
Family meal behaviours and attitudes 3.How strongly do you agree or disagree with the following
statements about mealtimes in your family?
Adapted from ProjectEAT (Neumark-Sztainer et al., 2002)
Family meal behaviours and attitudes
Note. Cooking with Kids (www.cookingwithkids.net), FBQ (Food Behaviour Questionnaire; www.uwfbq.ca), ProjectEAT (http://www.sph.umn.edu/epi/research/eat/surveys/), NHANES (National Health and Nutrition Examination Survey; www.cdc.gov/nchs/nhanes.htm).
ranging from Strongly encourage to Strongly discourage. Question #B11 has 8 items
(answered on a 4 point Likert scale) that will make up a self-efficacy for cooking scale.
Questions #B12, #B13 and #B14 are open ended questions which ask about what the
participant gets to do when making/preparing food, what they would like to do, and to
provide examples of the types of foods they get to prepare/cook. Question #B15b has 11
items with Breakfast, Lunch, Dinner, and Do not do optionsbased on different types of
food preparation techniques. This question will be used (i.e., summed out of 33) to
provide a measure of meal preparation techniques (i.e., higher scores will represent being
involved in more food preparation techniques).
Section C, Family Meals, includes three questions. The first question (#C1)
investigates the frequency of family dinners (identical to the parent survey), while the last
two questions examine the attitudes and behaviours surrounding family meals (as
reported above in the parent survey). Three additional attitude and behaviour questions
were added to the pre-test (yet asked in a similar fashion). In this case, the 14 items fall
into 5 categories; importance (3 items), communication (2 items), scheduling (4 items),
environment (3 items) and enjoyment (2 items). Therefore, the behaviours and attitudes
scale will be a score out of 56 (rather than 40 on the parent survey.
Post-Test Survey
The purpose of this survey (Appendix C) is to measure changes in food
preparation frequency and techniques, family meal frequency, and family meal
behaviours and attitudes, as a result of the Kinect-Ed presentation by Sandi Richard. By
comparing the data from the pre- and post-test surveys the effects of the intervention will
122
The Kinect-Ed Post Test Survey (see Table 2) has 32 questions which are divided
into 6 sections. The post-test contains all three sections of the pre-test (as described
above with identical questions, minus #A5 and #A6 which are not expected to change
over the course of the follow up testing), plus the addition of Sandi Richard’s visit
(section C), and whether or not the participant tried out any of the recipes from the
resource booklet (Sections D-cooked a recipe and E-didn’t cook a recipe).
Section C, Sandi Richards’s Visit, contains a total of 6 questions. Questions #C1,
#C2 and #C3 ask how much the individual enjoyed Sandi Richards’s visit, what they
liked best about the visit, and if Sandi Richard’s visit motivated them to start
preparing/making meals, respectively. Question #C4 and #C6 investigates whether the
individual talked with their parents about helping out in the kitchen, if they shared the
booklet and, if so, with whom. Lastly, Question #C5 inquires whether the individual has
changed any of the health behaviours as a result of Sandi Richard’s visit.
Depending on whether the participant cooked a recipe from the booklet,
participants will either answer Section D or Section E. Section D contains 5 questions
asking if the individual cooked one of Sandi Richard’s recipes in the booklet. Question
#D1 is an open-ended question asking what the individual liked about the recipe.
Questions #D2 asks about which food preparation techniques the participant employed
when cooking the recipe (i.e., check all that apply with 9 items). Question #D3 is a 4
point Likert scale question which asks how easy the recipe was to prepare with responses
ranging from Very Hard to Very Easy. Question #D4 is a 7 item check all that apply
question asking who ate the meal. Question #D5 asks whether or not the participant
Table 2
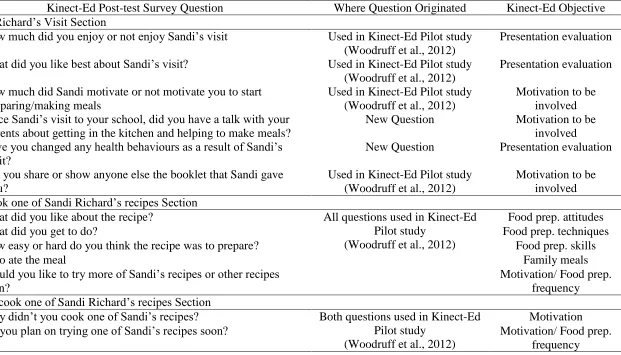
Origination of Kinect-Ed Post-Test Survey Questions
Kinect-Ed Post-test Survey Question Where Question Originated Kinect-Ed Objective
Sandi Richard’s Visit Section
1. How much did you enjoy or not enjoy Sandi’s visit Used in Kinect-Ed Pilot study
(Woodruff et al., 2012)
Presentation evaluation
2. What did you like best about Sandi’s visit? Used in Kinect-Ed Pilot study
(Woodruff et al., 2012)
Presentation evaluation
3. How much did Sandi motivate or not motivate you to start preparing/making meals
Used in Kinect-Ed Pilot study (Woodruff et al., 2012)
Motivation to be involved 4. Since Sandi’s visit to your school, did you have a talk with your
parents about getting in the kitchen and helping to make meals?
New Question Motivation to be
involved 5. Have you changed any health behaviours as a result of Sandi’s
visit?
New Question Presentation evaluation
6. Did you share or show anyone else the booklet that Sandi gave you?
Used in Kinect-Ed Pilot study (Woodruff et al., 2012)
Motivation to be involved Did cook one of Sandi Richard’s recipes Section
1. What did you like about the recipe? All questions used in Kinect-Ed
Pilot study (Woodruff et al., 2012)
Food prep. attitudes
2. What did you get to do? Food prep. techniques
3. How easy or hard do you think the recipe was to prepare? Food prep. skills
4. Who ate the meal Family meals
5. Would you like to try more of Sandi’s recipes or other recipes soon?
Motivation/ Food prep. frequency Didn’t cook one of Sandi Richard’s recipes Section
1. Why didn’t you cook one of Sandi’s recipes? Both questions used in Kinect-Ed
Pilot study (Woodruff et al., 2012)
Motivation
2. Do you plan on trying one of Sandi’s recipes soon? Motivation/ Food prep.
frequency
asking why or why not. Section E contains 2 questions for those participants that did not
cook one of the recipes from the booklet. The first question (#E1) is a check all that apply
8 item question asking why they did not prepare a recipe (7 potential reasons given with
an 8th option for other and space to provide their own explanation). Question #E2 asks if
they plan on trying one of the recipes soon, and is followed by an open ended question to
explain why or why not.
Phase 2: Content Validity
Methods
The purpose of the expert panel was to ensure the surveys possessed content
validity. This stage helped to identify subject matter areas and/or content domains related
to food preparation and family meals that may have been overlooked or missed
(Townsend, 2006). A total of 13 experts (PhD’s or Registered Dietitians) working in the
field of nutrition and food behaviours involving children and adolescents were invited to
participate via email (Appendix D). The list of experts was generated from authors of
current published manuscripts and those known to be working in the area of childhood
and adolescent nutrition behaviours. The email instructed the experts as to what was
expected from their participation in the study and provided them with a consent to
participate and information letter (Appendix E). The experts were asked to return their
signed consent form along with their comments after reviewing and critiquing the surveys
(Appendix A, B, and C) for content and clarity as well as to provide input and
suggestions in order to improve the surveys. After the surveys were reviewed by the
expert panel, modifications and adjustments were made to the Kinect-Ed survey in order
122
Participants
The Kinect-Ed Parental, Kinect-Ed Pre-test and Kinect-Ed Post-test surveys were
sent out via email to 13 identified experts in childhood/ adolescent nutrition (PhD’s and
registered dietitians). A total of 7 experts (representing 54%) reviewed the surveys and
participated in the study.
Results
Kinect-Ed parent survey. As a result of the expert panel’s critique, a total of 6
changes were made to the Kinect-Ed parental survey (Appendix F for specific
changes).These changes include the rewording of two questions, addition of one option to
questions #3, and the addition of three items to question #4.
Kinect-Ed pre-test survey. From the expert panel’s review, a total of 17 changes
were made to the pre-test survey (Appendix F). Questions were re-arranged so that they
appeared in the same order on both the pre- and post-test surveys. Changes to questions
included four questions/option being reworded, the addition of eight options, the removal
of three options from scale questions and the combination of two questions to create the
family meal behaviours and attitudes scale.
Kinect-Ed post-test survey. As a result of the expert panel review, a total of 10
changes were made to the post-test survey (Appendix F). Questions that appear on both
the pre- and post- test were edited to reflect the results of the expert panel’s suggestions.
The changes were a result of the addition of five options, the removal of neither from
122
Phase 3: Face Validity
Methods
In order to determine whether the pre- and post-test surveys (Appendix G for
updated surveys) were understandable and answerable by the intended target audience,
cognitive testing interviews were employed (Townsend, 2006; Willis, 1994) with one of
the after school programs (See Appendix H for Parent Consent Form- Validity). Using
Willis’s qualitative testing strategies for questionnaire development, think aloud, probing,
and paraphrasing techniques were used after the participants completed the pre- and
post-test surveys individually (on separate weeks). Refer to Appendix I for the detailed
interview scripts which were used during data collection. The cognitive interviews were
conducted in a group setting; rather than individually, and attempted to understand the
participants’ comprehension and interpretation of the questions, how they came up with
their answers, their ability to repeat items in their own words, and give possible
suggestions for wording changes. Notes were taken by the primary researcher, as well as
a research assistant, in order to capture all information. More specifically, Session 1
included participants completing the child assent form (See Appendix J), pre-test survey,
cognitive interview, followed by watching the Ed video and receiving the
Kinect-Ed Booklet. Session 2 included completing the post-test survey and cognitive interview.
Each session took approximately 30-45 minutes, and modifications to the surveys were
made to wording of items that are not well understood.
Participants
Cognitive interviews were used with one after school program. The cognitive
122
moderator (a professor who had experience with focus groups and was responsible for
note taking). For the Kinect-Ed Pre-test, participants (n =8) included 4 males and 4
females with a mean age of 10.25 years (ranging from 9 to 12 years, SD =1.04). They
identified themselves as White (n =1), Black (n =1), Chinese (n = 1), South Asian (n = 2),
and Other (n =3; Pakistani and Eritean). One week later the Kinect-Ed post-test survey
underwent the same procedures as the pre-test. Since it was not imperative that the same
participants were present, only 3 participants were present for both the pre- and post-test
cognitive interviews and 4 new participants were included. Participants (n =7) included 5
females and 2 males with a mean age of 10.57 years (ranging from 9 to 12 years, SD
=1.13). Participants identified themselves as White (n =3), Black (n =2), Chinese (n =1)
and South Asian (n =1).
Results
Kinect-Ed pre-test survey. As a result of the cognitive interview, a total of 23
changes were made to the Kinect-Ed pre-test survey (See Appendix K for the specific
changes). The changes included the reformatting the tracking identification code, adding
examples to the ethnicity question, nine questions/options were reworded, the addition of
six options and one question. Questions that appeared on both the pre- and post-test
surveys were edited to reflect the results of the cognitive interview.
Kinect-Ed post-test survey. As a result of the group cognitive interview, six
changes were made to the post-test survey (Appendix K). The tracking identification code
and ethnicity question were further reworded as well as the rewording of three other
122
Phase 4: Test-Retest Reliability
Methods
In order to establish reliability of the surveys, participants (from after school
programs, youth programming, and a school) completed each survey two separate times,
one week apart (see Appendix Lfor updated surveys). According to Townsend (2006), if
any test items are consistent/reliable, then respondents will reply to the item with the
same answer, with no educational intervention. Test-retest reliability procedures took
four weeks in total with parent consent being obtained before week 1 of data collection
(See Appendix M for Parent Consent Forms). Week 1 included an introduction to the
researchers and protocol (how to complete the survey), followed by the participants
completing the child assent form (See Appendix N), and the pre-test (session took 10~20
minutes). Given this was a validation study, it was important that the participant’s
answers were trackable, therefore, participants created individual tracking identifiers by
creating a four digit number on top of their survey. The ID’s were created based on their
date of birth (01-31) and the last 2 digits of their phone number (00-99). This code
ensured answers were kept anonymous to the researchers and traceable over the weeks.
Week 2 included completing the pre-test again and watching the Kinect-Ed video
(session took ~20 to 35 minutes). Weeks 3 and 4 included completing the post-test
(session took 10 ~20 minutes).
Validity of the sample size. Previous nutrition and food behaviour validity and
reliability studies were taken into account when deciding on sample size. As the greatest
number of participants would be needed for the test-retest reliability portions of the study,
122
calculate sample size for a Pearson Correlation. It was estimated that, with a null Rho of
.50 and an alternative Rho of .70, a sample size of 81 participants was required to obtain
a power level of .80 at an alpha level of .05. Further, based on other nutrition and food
behaviour surveys (Gower, Moyer-Mileur, Wilkinson, Slater, & Jordan, 2011; Lohse et
al., 2011; Neuhouser, Lilley, Lund, & Johnson, 2009; Turconi et al., 2003) which used
Pearson’s correlation to determine test-retest reliability, significant r values from .49 to
.90 were reported. From this it was decided, that an r value from .50 to .69 will be
classified as moderate and r values from .70 to 1 as high.
Data Analysis
Data collected as part of the reliability portion of the study was analyzed using
Statistical Package for the Social Sciences (SPSS version 20.0 for Windows, Somers,
NY, USA, 2011). An alpha level of .05 was set for all statistical analysis.
Test-retest reliability. Questions which contained ordinal data were coded and
bivariate correlations using the Pearson’s correlation coefficient. Paired t-tests were
computed to test the difference in means from pre-test survey time one (T1) and time two
(T2) as well as post-test survey T1 and T2 in order to establish test-retest reliability.
Crosstabs using the chi square analysis and Phi coefficients (or Cramers V for the
ethnicity question #A4) were computed on survey questions containing nominal data in
order to compare the scores from T1 and T2. The Crosstabs analysis also allowed for the
number of participants whose answers changed from T1 and T2 to be calculated. Effect
sizes were calculated for significant differences in t values between T1 and T2 and were
122
of ≤.20 considered small, .50 considered moderate and ≥.80 considered large (Cohen,
1988).
Internal consistency reliability. In order to assess the homogeneity of some of
the questions and to determine if all questions are necessary on the survey, internal
reliability was calculated on the scale-types questions (pre-test T1 and T2) using
Cronbach’s coefficient alpha (Cronbach, 1951; Nunnally & Bernstein, 1994). This
analysis provided information about the relationships between individual items in the
scale and was used to determine if all questions are needed. George and Mallery (2003)
classify Cronbach’s alpha as ≥.9 as excellent, ≥.8 as good, ≥ .7 acceptable, ≥.6
questionable, ≥.5 poor and ≤.5 unacceptable.
Participants
Test-retest reliability participants were recruited from 6 centers: the YMCA
afterschool programs (n =2), youth programming and sport clubs within Windsor Essex
County (n =3) and a school from the Windsor Essex Catholic District School Board (n
=1). The participants included young adolescents who filled out the pre-test survey at T1
(n =145) and T2 (n =129). Of the 129 participants 57% were female (n=74) and 43%
were male (n=55). Participants were in grades 4 (n =7), 5 (n =10), 6 (n =13), 7 (n =49),
and 8 (n =50). Participants identified themselves as White (n=103), Black (n=3), Chinese
(n =3), Arabic (n =6), South Asian (n =1), or Other (n =13). Among the participants who
filled out the Kinect-Ed post-test survey at T1 (n =126) and T2 (n =107) included 107
young adolescents. Of the 107 participants 57% were female (n =61) and 43% were male
122
Participants identified themselves as White (n =84), Black (n =3), Chinese (n =3), Arabic
(n =5), South Asian (n =1), or Other (n =11).
Results
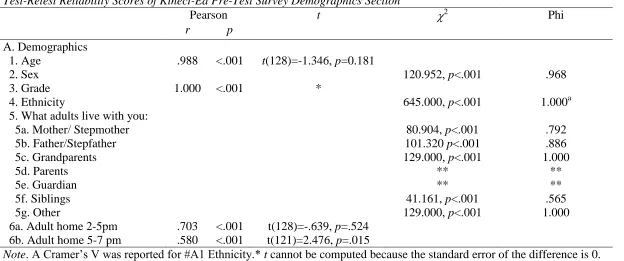
Kinect-Ed Pre-Test Survey.
Section A: Demographics. Data from all six questions which make up the
Demographic section of the survey were in good agreement between T1 and T2 (see
Table 3). Pearson correlations values ranged from moderate to high (r=.580 to 1.000, p
<.001) indicating a good linear agreement between responses. Paired t-tests revealed
non-significant differences between T1 and T2 with the exception of question #A6b (adults
home b/t 5-7 pm) (t(121)=2.476, p=.015, cohen’s d=.22, M: T1= 3.57, T2=3.41, SD
=.76). Chi square analyses revealed statistically significant associations between T1 and
T2 (p <.001). Phi coefficient values ranged from 0.565 (adult siblings at home) to 1.000
(grandparents). Cramers V coefficient for question #A4 (ethnicity) revealed a strong
agreement between T1 and T2 scores (Cramers V= 1.000, p <.001).
Section B: Food preparation. Data from all questions in the Food Preparation
section were deemed to be in good agreement between T1 and T2 except for question
#B15b (See Table 4). For example, Pearson’s correlations ranged from .479 to .854
(p<.001) with the majority of the paired t-tests revealing non-significant differences for
scores on T1 and T2. The self-efficacy scale question (#B11) also showed good
agreement (r=0.854, p<.001) between T1 and T2. A significant paired t-test for the
combined food preparation technique scale question (i.e., all of the food preparation
techniques added together to form a score out of 33) suggesting that scores differed
21
Table 3
Test-Retest Reliability Scores of Kinect-Ed Pre-Test Survey Demographics Section
Pearson t 2 Phi
r p
A. Demographics
1. Age .988 <.001 t(128)=-1.346, p=0.181
2. Sex 120.952, p<.001 .968
3. Grade 1.000 <.001 *
4. Ethnicity 645.000, p<.001 1.000a
5. What adults live with you:
5a. Mother/ Stepmother 80.904, p<.001 .792
5b. Father/Stepfather 101.320 p<.001 .886
5c. Grandparents 129.000, p<.001 1.000
5d. Parents ** **
5e. Guardian ** **
5f. Siblings 41.161, p<.001 .565
5g. Other 129.000, p<.001 1.000
6a. Adult home 2-5pm .703 <.001 t(128)=-.639, p=.524
6b. Adult home 5-7 pm .580 <.001 t(121)=2.476, p=.015
121
Table 4
Test-Retest Reliability Scores of Kinect-Ed Pre-Test Survey Food Preparation and Family Meal Section
Pearson t 2 Phi
r p
B. Food Preparation
1. Do you cook? .613 <.001 t(127)=-.506, p=.314
2. Do you cook with family? .591 <.001 t(128)=-1.185, p=.238
3. Do you cook with friends? .711 <.001 t(128)=-1.135, p=.258
4. How often do you make food? .791 <.001 t(126)=.576, p=.566
5. In the past week did you help shop for groceries? .479 <.001 t(127)=.894, p=.373
6. In the past week how many times did you help make dinner? .645 <.001 t(127)=-1.130, p=.261 7. Who does the planning or preparing of meals in your house: .591 <.001 t(128)=-1.185, p=.238
7a. Mother/Stepmother 57.489, p<.001 .670
7b. Father/ Stepfather 74.350, p<.001 .762
7c. I do 62.984, p<.001 .701
7d. Grandparent 40.971, p<.001 .566
7e. Sibling 30.992, p<.001 .492
7f. Nanny/ babysitter 128.000, p<.001 1.000
7g. Other * *
7h. I don’t know * *
8. How often would you like to be involved in food preparation? .683 <.001 t(127)=.115, p=.909 9. How do you feel about:
9a. Cooking .741 <.001 t(128)=.506, p=.614
9b. The taste of food you have to prepare/make .723 <.001 t(128)=.111, p=.120
9c. Making food with friends .675 <.001 t(126)=-.080, p=.936
9d. Making food with family .665 <.001 t(126)=.106, p=.916
9e. Making snacks .533 <.001 t(124)=-1.581, p=.116
10. How much are you encouraged to help out in the kitchen .714 <.001 t(126)=-1.096, p=.275
11. Self-Efficacy Scale .854 <.001 t(121)=-1.148, p=.253
12. I don’t make food 59.163, p<.001 .683
13. What would you like to do when preparing/making food? ** **
122
14. I didn’t make food in past 7 days 28.763, p<.001 .472
15a. I wasn’t involved in preparing foods in the last 7 days 24.178, p<.001 .435
15a. Meal total Scale (out 21) .611 <.001 t(87)=.236, p=.814
15b. I am not involved in making food 18.422, p<.001 .379
15b. Food Preparation (Total out of 11) .753 <.001 t(89)=-2.721, p=.008
C. Family Meals
1. How many nights per/wk do you eat dinner with one parent/ guardian
.669 <.001 t(128)=.925, p=.357
2. Family Meal Scale (out of 56) .906 <.001 t(123)=1.447, p=.150
Note. *Measures of association cannot be computed because at least one variable is constant. The df for all 2 =1. **Open ended question no stats computed.
121 SD =5.85), because of this, the question was also analyzed out of 11 (one point was
awarded if the participant had checked off that they did the technique at breakfast, lunch
or dinner) which again resulted in a significant difference between T1 and T2 scores
(t(89)=2.721 p=.008, cohen’s d=.20, M: T1 = 7.31, T2 = 7.81, SD =2.47). The scales
were found to be correlated for both analyses (r=.724 and r=.753), however, a significant
t-test resulted (p=.008), since the options did not change and data was just recoded so
there was still a lot of variation between scores. Lastly, chi square analyses suggested
good agreement between T1 and T2 with all p values <.001 and phi coefficients ranging
from .377 to 1.000.
Section C: Family meals. The frequency of family meals was found to be
significantly correlated (r=.669, p<.001) between T1 and T2 (see Table 4). The family
meal behaviours and attitude scale (combined scale of 14 items from questions #C2 and
#C3) revealed significant correlations. Paired t-tests revealed non-significant difference
between T1 and T2 scores for all questions, with the overall total of the family meal scale
was found to be highly correlated (r=.906, p <.001).
Kinect-Ed Post-Test Survey.
A total of 19 identical questions appeared on the pre- and post-test surveys. The
majority of questions from the Food Preparation section revealed higher correlation
values on the post-test than the pre-test analysis (see Appendix O for full analyses).
Pearson correlations ranged from .593 to.863 (p>.001) with all paired t-tests revealing
non-significant differences between T1 and T2. Chi square analyses revealed statistically
significant associations between T1 and T2 (p <.001; Phi ranging from .505 to 1.000).
122
was found for question #B15b (food preparation technique scale). The paired t-test
performed on the overall total of food preparation technique scale (out of 11) revealed a
non-significant difference between post-test T1 and T2 (t(80)=1.146, p=.255) compared
to significant difference between pre-test T1 and T2. Furthermore, the majority of
questions from the Family Meal section revealed higher correlations on the post-test than
the pre-test with r values ranging from .642 to .891 (p>.001) with all paired t-tests
revealing non-significant differences, except for question #C2b (mealtime is a time for
talking with other family members: t(105)=-2.749, p=.007, cohen’s d=.14, M: T1 =3.40,
T2 =3.50, SD =.71).
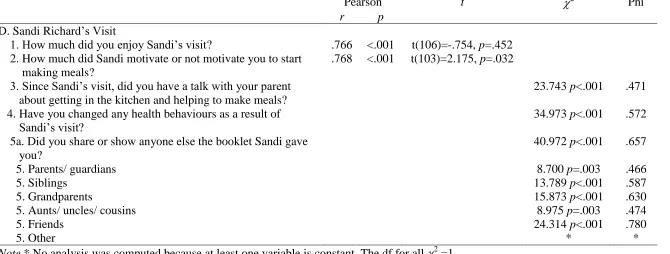
Section D: Sandi Richard’s visit. Questions #D1 (How much did you enjoy the
visit) and #D2 (How much were you motivated by the visit?) revealed significant
correlations (r=.766, .768, p <.001). Paired t-tests revealed non-significant differences
between T1 and T2 for all questions except #D2 (How much were you motivated?)
(t(103)=2.175, p=.032, cohen’s d=.14, M: T1 =2.78, T2 =2.65, SD =.88). Chi square
analyses revealed statistically significant associations between T1 and T2 (p <.001 to
p=.003). Phi coefficients for question #D5 (Did you share the booklet?) ranged from
.466 (parents/guardians) to .780 (friends; see Table 5).
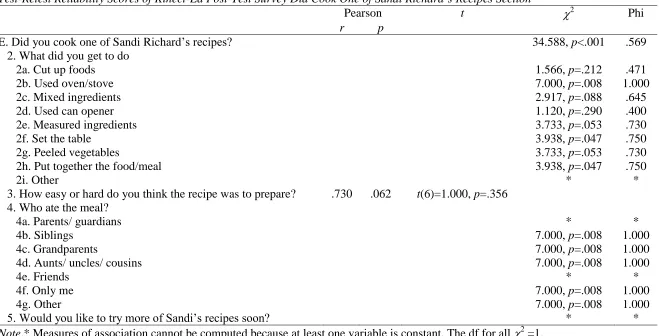
Section E: Did cook one of Sandi Richard’s recipes. Chi square analyses
revealed statistically significant associations between T1 and T2 for all of question #E4
(Who ate the meal) as well as #E2b (used oven/ stove), #E2f (set the table) and #E2h (put
together food/ meal) (See Table 6). Phi coefficients ranged from .400, p=.290 (#E2d-
121
Table 5
Test-Retest Reliability Scores of Kinect-Ed Post-Test Survey Sandi Richard’s Visit Section
Pearson t 2 Phi
r p
D. Sandi Richard’s Visit
1. How much did you enjoy Sandi’s visit? .766 <.001 t(106)=-.754, p=.452
2. How much did Sandi motivate or not motivate you to start making meals?
.768 <.001 t(103)=2.175, p=.032
3. Since Sandi’s visit, did you have a talk with your parent about getting in the kitchen and helping to make meals?
23.743 p<.001 .471
4. Have you changed any health behaviours as a result of Sandi’s visit?
34.973 p<.001 .572
5a. Did you share or show anyone else the booklet Sandi gave you?
40.972 p<.001 .657
5. Parents/ guardians 8.700 p=.003 .466
5. Siblings 13.789 p<.001 .587
5. Grandparents 15.873 p<.001 .630
5. Aunts/ uncles/ cousins 8.975 p=.003 .474
5. Friends 24.314 p<.001 .780
5. Other * *
Note.* No analysis was computed because at least one variable is constant. The df for all 2 =1.
121
Table 6
Test-Retest Reliability Scores of Kinect-Ed Post-Test Survey Did Cook One of Sandi Richard’s Recipes Section
Pearson t 2 Phi
r p
E. Did you cook one of Sandi Richard’s recipes? 34.588, p<.001 .569
2. What did you get to do
2a. Cut up foods 1.566, p=.212 .471
2b. Used oven/stove 7.000, p=.008 1.000
2c. Mixed ingredients 2.917, p=.088 .645
2d. Used can opener 1.120, p=.290 .400
2e. Measured ingredients 3.733, p=.053 .730
2f. Set the table 3.938, p=.047 .750
2g. Peeled vegetables 3.733, p=.053 .730
2h. Put together the food/meal 3.938, p=.047 .750
2i. Other * *
3. How easy or hard do you think the recipe was to prepare? .730 .062 t(6)=1.000, p=.356
4. Who ate the meal?
4a. Parents/ guardians * *
4b. Siblings 7.000, p=.008 1.000
4c. Grandparents 7.000, p=.008 1.000
4d. Aunts/ uncles/ cousins 7.000, p=.008 1.000
4e. Friends * *
4f. Only me 7.000, p=.008 1.000
4g. Other 7.000, p=.008 1.000
5. Would you like to try more of Sandi’s recipes soon? * *
Note.* Measures of association cannot be computed because at least one variable is constant. The df for all 2 =1.
121
high correlation (r=.730, p=.062) for question #E3 (How hard/easy did you think the
recipe was to prepare). Paired t-tests revealed non-significant differences between T1 and
T2 scores (See Table 6).
Section F: Didn’t cook one of Sandi Richard’s recipes. All questions in this
section were found to be in good agreement between T1 and T2, except #F1e (I didn’t
think I could do it well enough; see Table 7). Chi square analysis revealed a statistically
significant association between T1 and T2 (p<.001) for all questions except #F1e (I didn’t
think I could do it well enough) (2 (N=91, 1) = 2.330, p=.127). Phi coefficients ranged
from 0.160 (#F1e-I didn’t think I could it do it well enough) to 0.840 (#F1c- We don’t
usually have those ingredients).
Table 7
Test-Retest Reliability Scores of Kinect-Ed Post-Test Survey Didn’t Cook One of Sandi Richard’s Recipes Sections
2 Phi
F. Didn’t cook one of Sandi Richard’s recipes: 1. Why didn’t you cook one of Sandi’s recipes?
a. I was too busy 43.362, p<.001 .698
b. I didn’t like the foods in the booklet 40.557, p<.001 .668
c. We don’t usually have those ingredients in my house 64.263, p<.001 .840
d. I don’t like cooking 34.370, p<.001 .615
e. I didn’t think I could do it well enough 2.330, p=.127 .160
f. I have food allergies * *
g. I was too lazy 37.994, p<.001 .646
h. Other 16.058, p<.001 .418
Note. *No analyses were computed because at least one variable is constant. The df for all 2 =1.
Internal Consistency Reliability.
Cronbach’s alpha calculations were calculated for 3 scales (self-efficacy for
121
pre-test T1 and T2 (see Appendix P for complete analyses). Self-efficacy for cooking
(#B11) was found to have a good level of internal consistency (pre-test Cronbach’s α
T1=.811, pre-test Cronbach’s α T2=.875) and all items in the scale were found to be
relevant to the scale. The food preparation technique scale was found to have an
acceptable level of internal consistency (pre-test T1 Cronbach’s α=.725, and pre-test T2
Cronbach’s α=.761). The removal of item #B15b j (grilling/BBQ; Cronbach’s α=.731)
and k (putting together a pre-made meal; Cronbach’s α=.745) would lead to a small
improvement of the Cronbach’s alpha value, however, this improvement was not deemed
large enough. The family meal scale (#C2, #C3) was also found to have an acceptable
level of internal consistency (pre-test T1 Cronbach’s α=.776, and pre-test T2 Cronbach’s
α=.823). The removal of item #C20c would lead to a small improvement of the
Cronbach’s alpha value (Cronbach’s α=.779) for the family meal scale, however, the
effect of removing this item form the scale was not deemed large enough.
Phase 5: Parent Survey and Follow-Up Interview
Methods
In order to assess face validity and test-retest reliability of the parent survey, those
parents who provided a phone number on the consent form agreeing to be contacted for a
follow-up interview were called (n =20; see Appendix Q for the parent follow-up
interview script). The interviews were conducted following all procedures with their
children and parents were asked questions, such as Why is dinner important to your
family?; What do you allow your kids to do during meal preparation?. Further, think
aloud, probing, and paraphrasing techniques (Willis, 1994) were employed during the
121
similar to a study by Jago et al. (2011) who contacted 25% which gave the researchers a
more accurate representation of both parent’s and children’s views. Responses to the
Kinect-Ed Parental survey (T1) were then compared with the responses to the parent
follow-up interview (T2). The approximate time between T1 and T2 was 6 weeks.
Participants
A total of 20 parents were contacted for follow-up via phone interviews (out of a
possible 57 parents who left a phone number). Two parents had 2 children in the study,
thus representing 22 parent surveys.
Results
Face Validity. The frequency of family dinners was found to be in good
agreement between the parental survey and the follow-up interview (r=0.798, p<.001),
and no significant difference was found between T1 and T2 (t(21)=1.000, p=.329). In
total, family dinner frequency of 4 participants differed from T1 to T2 (i.e., 1 participant
changed from 3-5 days per week at T1 to 6-7 days per week as T2, and 3 participants
changed from 6-7 days at T1 to 3-5 days at T2). Parent’s comfort level with having their
children in the kitchen was also found to be in good agreement between Parental survey
and follow-up interview (r=.733, p<.001) and no significant difference was found
between T1 and T2 (t(21)=1.449, p=.162). Responses to the parental survey and
follow-up interview questions #2 and #3 were found to be highly related with 70% (n =14) of the
responses matching. The other 30% (n =6) of responses were found to be similar;
however, the parents did leave out some information on the parent survey that was
122
Internal Consistency Reliability. Based on the paper-based survey (n=134), the
family meal scale (#4) was found to have a questionable level of internal consistency
(Cronbach’s α=.681). The removal of item #4g would lead to a small improvement to the
Cronbach’s alpha of the family meal scale (Cronbach’s α=.687), however, the effect of
removing the item was not considered large enough.
Discussion
The development, validity, reliability, and internal consistency of the Kinect-Ed
survey tools were conducted with an expert panel and a sample of young adolescents and
their parents from Windsor-Essex County, Ontario, Canada. The development of the
surveys was based on existing tools used in other nutrition and food behaviour studies
(Project EAT, FBQ, Cooking with Kids, and NHANES) and the current objectives of the
Kinect-Ed program. Although other surveys and measurement tools have asked
questions related to food preparation frequency, cooking skills and family meal
dynamics, the current study is believed to be the first set of surveys to combine all these
dimensions.
Validity
Content validity was established using a panel of experts (n=7) which was similar
to a number of studies that examined the content validity of surveys (Gower et al., 2010;
Li & Levy-Milne, 2008; Schembre et al., 2009). As a result of the expert panel review
there were 6 improvements made to the Kinect-Ed parent survey, 17 to the Kinect-Ed
pretest survey, and 10 to the Kinect-Ed post-test survey, with changes reflecting
questions which appear on both surveys. The improvement mainly consisted of wording
122
Face validity was established using group cognitive interviews which resulted in
23 changes to the pre-test survey and 6 changes being made to the post-test survey. The
improvements included rewording of questions and options, addition or removal of
options, and the addition of questions. Cognitive interviews are a common way of testing
the face validity of nutrition and food behaviours surveys and tools (Hanning et al. 2009;
Li & Levy-Milne, 2008) as it allows researchers to measure the comprehension of the
survey tools among the target audience. As a result of the content and face validity
methods, the Kinect-Ed surveys were edited to reflect the recommendations of the
participants improving the overall comprehension and content of the surveys.
Reliability
Test-retest reliability was completed among young adolescents who completed the
pre-test and post-test surveys twice one week apart (pre-test n =129, post-test n=107).
The Demographics section of the Kinect-Ed pre-test was found to be highly reliable for
all questions within this section except for question #A6b (adults home b/t 5-7 pm) which
is a result of 39 participants changing their answer between T1 to T2, with 17 participants
changing their answer from Almost always at T1 to Usually at T2. It is not understood
why participants changed their answer from T1 and T2, however, a change in schedules
(e.g., shift work) may have occurred during this time period. Responses for question #A5f
(What adults live with you the majority of the time?- Brothers/Sisters) at T1 and T2 also
resulted in a low r value (r=.565) as 25 participants changed their answers at T1 and T2.
It is believed participants may have not fully read and/or understood that the question was
122
recommended that the option be changed to read Adult Brother/Sister for better
clarification in the future (see Appendix R for the final version of the Kinect-Ed surveys).
The Food Preparation section of the Kinect-Ed pre-test survey was found to be
reliable for all questions, except #B15b (food preparation technique scale). This might be
a result of the number of options presented (Breakfast, Lunch, Dinner, Do Not Do) for
each preparation technique leading to greater variability in responses between T1 and T2.
It is, therefore, recommended that this question be changed to include a Do and Do Not
Do option as opposed to the breakfast, lunch, and dinner options. This would effectively
create a scale out of 11 points instead of 33, which might lead to an increase in the
test-retest reliability of the question (higher r and insignificant t values) as participants may
be more tentative when answering the question with the reduction of options decreasing
the variability between responses. When analyzing the question out of 11 opposed to 33 a
slightly higher correlation was found (r=.753 vs. r= .724). Both analyses did result in a
small effect sizes (cohen’s d= .27 and .20) suggesting low practical significance. Further,
it is recognized that some techniques are not necessarily appropriate at meals (e.g.,
BBQ/grilling at breakfast) so the reduced number of options (Do and Do not do) may
help the respondents and will provide more meaningful results. Interestingly, the majority
of the survey questions which asked “in the past week...” (e.g., #B5 How many times did
you help shop for groceries, #B14 I didn’t prepare food in the past 7 days, #B15a I was
involved in making food during...) were found to have lower correlation values between
T1 and T2 (r= .479, .472, and .435 respectively), then the other questions. The low