Parametric Study of Vortex Generators on a Super Critical Infinite-Wing
to Alleviate Shock-Induced Separation
By Nobuo NAMURA1Þand Shinkyu JEONG2Þ 1ÞInstitute of Fluid Science, Tohoku University, Sendai, Japan
2ÞKyunghee University, Yongin, South Korea (Received February 13th, 2013)
A parametric study of vortex generators (VGs) on the transonic infinite-wing with two types of airfoil is performed using computational fluid dynamics to identify the effects of five parameters: height, aspect ratio, incidence angle, spac-ing and chord location, on the aerodynamic characteristics. First, an SC(2)-0518 airfoil with large thickness ratio and leading-edge radius is employed. The VG spacing significantly affects the shock wave location. If the spacing is narrow, the shock wave moves downstream, which increases the lift coefficient at a high angle of attack. In contrast, broad spac-ing suppresses the fluctuation of the pitchspac-ing moment coefficients. This difference is caused by the interactions among vortices. The VG height changes the drag coefficients and is correlated with the VG spacing. The other airfoil considered is a cross-section airfoil of a NASA common research model with small thickness ratio and leading-edge radius. The spacing effect with this airfoil is almost the same as that of the SC(2)-0518 airfoil. The VG location has little influence, but the VG located more upstream would be better. In addition, an appropriate incidence angle and aspect ratio exist for generating the vortex efficiently.
Key Words: Vortex Generators, Aerodynamic Characteristics, Shock Waves, Computational Fluid Dynamics
Nomenclature
c: chord length of airfoil
CD: drag coefficient Cf: skin friction coefficient
CL: lift coefficient
CM: pitching moment coefficient
Cp: pressure coefficient
D: distance between vortex generators
h: height of vortex generator
l: length of vortex generator
M: Mach number
Pt: non-dimensional total pressure Re: Reynolds number
t: thickness of vortex generator
xVG: chord location of vortex generator
x=c: non-dimensional chord location : angle of attack
VG: angle of incidence of vortex generator to mean flow
direction
1. Introduction
Shock-induced separation can be caused by small incre-ments in angle of attack and Mach number in transonic flight. This phenomenon decreases lift and markedly in-creases drag and the pitching moment, as in the case of a stall at high angle of attack in subsonic flight. To alleviate shock-induced separation, an array of vortex generators (VGs) is frequently employed. A small vane, the height of
which is almost the same as the thickness of the boundary layer, is often used as the VG, and generates the vortex that supplies fresh flow into the boundary layer. VGs can be applied without any changes in the primary design of the air-craft. However, the design of a VG array strongly depends on the engineer’s experience because the scale difference between the VG and the wing makes it difficult to perform the experiment and numerical analysis. In the experiment, the size of the VG becomes too small to properly measure the effect because the wing model is usually scaled down. On the other hand, numerical analysis requires a high-reso-lution mesh so that the shape of the VG and the vortex from it are captured. For these reasons, there have been few stud-ies regarding the effects of VGs on the wing.
Wik and Shaw1)compared the results of computational fluid dynamics (CFD) with different turbulence models to the experimental data using the vortex from one VG on a flat plate. They reported that the Spalart Allmaras model with rotation correction (SA-R)2,3)and thek–!shear stress trans-port (SST) model4)could predict the vortex well and further improvements were obtained using the Reynolds stress model. Bur et al.5)created a shock wave using a ramp in a transonic wind tunnel. They tested six types of VG arrays and investigated the effects of the VGs on the shock wave. However, it was not mentioned how VGs affect the aerody-namic characteristics of the transonic aircraft because these studies were performed on flat and ramp planes. Huang et al.6)performed Reynolds-averaged Navier-Stokes (RANS) analysis of a three-dimensional transonic wing and con-firmed that a VG array could improve the aerodynamic char-acteristics. However, it was not clear how VG parameters Ó2013 The Japan Society for Aeronautical and Space Sciences
(shape, height, spacing, location, incidence angle and aspect ratio) affect the aerodynamic characteristics because the three-dimensional analysis was performed in only one case of the angle of attack, and VG arrangements were limited to three cases. Dandois et al.7)performed a parametric study of VGs on a transonic wing using 2.5D RANS computation. They tested the effects of the VG spacing, incidence angle and chord location, and reported that the spacing and inci-dence angle are sensitive. However, only a high angle of attack with shock-induced separation was computed, and the aerodynamic characteristics at low angle of attack were not mentioned. On the other hand, Lee et al.8)studied VGs on a transonic inlet using CFD. They performed multi-objective optimization in which design variables were the VG height, location and incidence angle. The results indi-cated that the inlet performance was improved relative to the baseline model with VGs. However, there has not been sufficient research on either optimization or the parametric study of VGs on the transonic wing, especially using CFD. To optimize the VG array on the wing, it should first be determined how each VG parameter affects the aerody-namic characteristics. Here, a parametric study of VGs on a transonic infinite-wing is performed using CFD to allevi-ate the shock-induced separation. We use the models in which one VG is equipped on a super-critical rectangular wing and the periodic boundary condition is adopted because CFD analysis of the three-dimensional wing with VGs requires large computational time. Two types of air-foils are employed to investigate whether the results obtained from this parametric study can be applied to actual aircraft design regardless of the airfoil differences.
2. Computational Method
2.1. Numerical method of the flow field
A three-dimensional unstructured mesh flow solver named the Tohoku University aerodynamic simulation (TAS) code is used to simulate the flow field. Compressible Navier-Stokes equations are computed using the cell-vertex finite-volume scheme. Numerical flux is computed using the approximate Riemann solver of Harten-Lax-van Leer-Einfeldt-Wada (HLLEW).9)Second-order spatial accuracy is achieved through a linear reconstruction of the primitive variables with Venkatakrishnan’s limiter.10)The lower/upper symmetric Gauss-Seidel (LU-SGS) implicit method11) is used for time integration. The turbulence model used in this study is the Spalart Allmaras model without the ft2 term with rotation correction (SA-noft2-R).2,3,12) A hybrid vol-ume mesh consisting of tetrahedrons, prisms and pyramids is used to resolve the boundary layer accurately in unstruc-tured mesh computation.
2.2. Periodic boundary and mesh generation
To sustain the second-order spatial accuracy at the nodes on periodic boundaries, a special treatment is adopted. Figure 1 shows the simplified two-dimensional mesh with periodic boundaries. As preprocessing, ghost cells are created beside the periodic boundaries by pushing out the
nodes on the periodic boundaries. In the calculation, varia-bles and gradients at calculated nodes are copied to corre-sponding non-calculated nodes. Using this periodic bound-ary condition, it is desirable that the corresponding nodes on both periodic boundaries are at the same position on each boundary surface. To meet this condition with an unstruc-tured mesh, the mesh is generated according to Fig. 2. First, a half-span mesh is generated (left-side mesh in Fig. 2(a)). Second, the mesh is mirrored at the half-span position (right-side mesh in Fig. 2(b)) and a symmetric mesh is gen-erated. Finally, one VG is added and a mesh is regenerated around the VG (closed domain in Fig. 2(c)).
3. Model Geometry and Flow Conditions
Two types of airfoils are applied to identify the effects of the VG. The first is a super-critical airfoil SC(2)-0518 with a thickness ratio of 18% and a large leading-edge radius. The other is a cross-section airfoil of a NASA common research model (CRM)13)at 65% span length, with a smaller thick-ness ratio and leading-edge radius than the SC(2)-0518 air-foil. This airfoil is called the CRM2D airfoil in this paper. The shapes of these two airfoils are shown in Fig. 3 along with meshes around them.
The free stream Mach numbers areM ¼0:7 for SC(2)-0518 and M¼0:85cosð31:5Þ ¼0:725 (31.5 [deg] is the sweepback angle of CRM) for CRM2D. The Reynolds number based on the chord length isRe¼5106in both
models. Angles of attack are in the range from 0 to 5 [deg] Fig. 1. Periodic boundary condition.
(a) Half mesh (b) Mirror (c) Regeneration
for SC(2)-0518 and from 4 to 7 [deg] for CRM2D. In CFD analysis, one VG is equipped on a rectangular wing because the periodic boundary condition is adopted, while several VGs are equipped on a finite-wing in the experiment. Flow conditions and model geometry are chosen based on the experiments performed by the Japan Aerospace Exploration Agency (JAXA).
First, a baseline model of the VG is defined according to the empirical rule.14–16)The VG is equipped at 20% of the chord length (xVG=c¼0:20) with an incidence angle of 20 [deg] to the mean flow direction (VG¼20[deg]) in
the baseline model. The shape of the VG is shown in Fig. 4. Two parameters are defined by the ratio as l=h¼4 andt=h¼0:12. The height of the VG,h, and the spacing between two VGs,D, are important parameters in this study. Generally,hhas the same order as the 99% boundary layer thickness at the VG location. Based on the results of our prior analysis, the thickness at 20% of the chord length is estimated as 0.4% of the chord length in both airfoils. On the other hand,Dmeans the span length of the wing because the periodic boundary condition is adopted. The height and spacing are defined as h=c¼0:006 and D=h¼10 in the baseline model. In addition, the baseline models with each airfoil have the same VG arrangement.
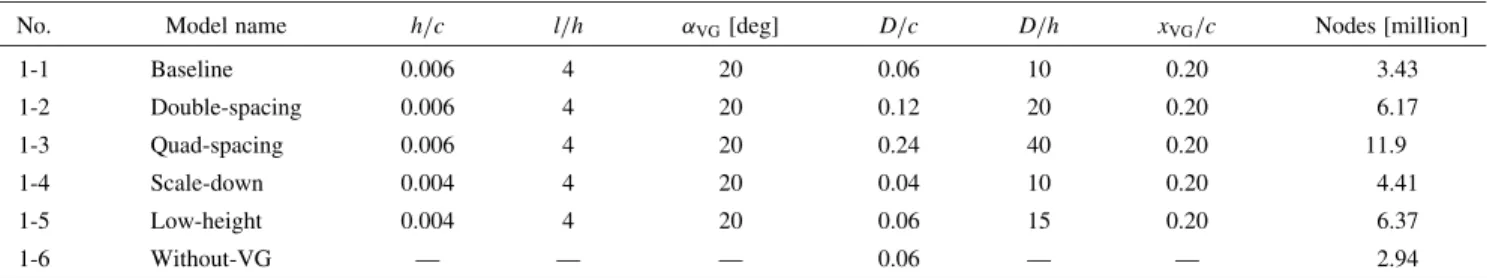
The effects of two parameters (spacing and height) are examined with the SC(2)-0518 airfoil. The combination of parameters is summarized in Table 1. The effects of the spacing are confirmed by comparing the three models (base-line, double-spacing and quad-spacing), which have
differ-ent spacing values (D=h¼10, 20 and 40) and the same values of the other parameters. The effects of height are determined by comparing the baseline, scale-down and low-height models. The heights of the scale-down and low-height models are the same, while their spacing values differ. The baseline and scale-down models have different values ofh=cand the same value ofD=h, while the baseline and low-height models have different values ofh=cand the same value ofD=c.
Four parameters (spacing, location, incidence angle and aspect ratio) are tested with the CRM2D airfoil. The combi-nation of parameters is summarized in Table 2. The quad-spacing model is defined in the same way as with the SC(2)-0518 airfoil to identify the effects of spacing and location by comparison with the baseline and quad-upstream models, respectively. Three values of incidence angle (VG¼10, 20 and 30 [deg]) are compared among the
low-angle, baseline and high-angle models. The effects of aspect ratio (l=h) are examined by comparing the baseline and low-aspect models, which have the same surface areas.
Unstructured meshes are generated for each model via MEGG3D.17–20)Three types of computational meshes with different numbers of nodes (coarse: 0.807 million nodes; medium: 3.43 million nodes; fine: 10.6 million nodes) are prepared for the baseline model with the SC(2)-0518 airfoil to evaluate the grid convergence. Figure 5 shows the medi-um mesh of the baseline model with the SC(2)-0518 airfoil. The upper surface of the wing has 13 times more nodes than the lower surface to capture the vortex from the VG. The outer boundary is located 25 chord lengths away from the wing centroid. Figures 5(a) and (b) show the meshes around the wing and VG, respectively. In Fig. 5(b), the mesh corre-sponding to the cross-section atx=c¼0:21is included. The parametric study is performed with medium meshes while the number of nodes is varied in accordance with the size of the VG and the spacing between VGs among all models, as shown in Tables 1 and 2. The without-VG model, the mesh of which is generated by skipping the procedure shown in Fig. 2(c), is employed for each airfoil to confirm the effects of the VG.
4. Results and Discussion 4.1. SC(2)-0518 airfoil 4.1.1. Grid convergence
The baseline models with the fine, medium and coarse meshes and the without-VG model with the medium mesh
(a) SC(2)-0518 (b) CRM2D
Fig. 3. Geometry of airfoils.
Fig. 4. Geometry of the VG.
Table 1. Combination of VG parameters with the SC(2)-0518 airfoil.
No. Model name h=c l=h VG[deg] D=c D=h xVG=c Nodes [million]
1-1 Baseline 0.006 4 20 0.06 10 0.20 3.43 1-2 Double-spacing 0.006 4 20 0.12 20 0.20 6.17 1-3 Quad-spacing 0.006 4 20 0.24 40 0.20 11.9 1-4 Scale-down 0.004 4 20 0.04 10 0.20 4.41 1-5 Low-height 0.004 4 20 0.06 15 0.20 6.37 1-6 Without-VG — — — 0.06 — — 2.94
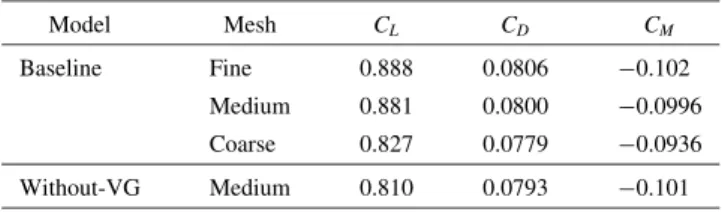
are compared to evaluate the grid convergence. The CFD analysis is performed only at ¼5[deg] (the baseline model obtains the maximumCLat this angle of attack) be-cause the CFD analysis with the fine mesh requires large computational time. Table 3 and Fig. 6 show the aerody-namic coefficients and the Cp distributions, respectively. The Cp distributions are represented by those at the VG equipped cross-section (center of the wing in the span direc-tion), because those at any cross-sections are the same while the shock wave locations are slightly different. Table 3 shows that the baseline models with the fine and medium meshes have similar values which are extremely different from those with the coarse mesh. However, comparing the baseline models and the without-VG model, the differences ofCDandCMbetween the baseline model and the without-VG model with the medium meshes are the same order as those between the baseline models with the fine and medium meshes. Note that CD andCM are so sensitive to the grid density that small differences of these coefficients have no meaning in the following parametric study. On the other hand, theCpdistributions of the baseline models with three
meshes are entirely different from that of the without-VG model as shown in Fig. 6. Additionally, theCpdistributions of the baseline models with the fine and medium meshes
have the same characteristics while the shock wave of the baseline model with the coarse mesh locates more upstream than those with the fine and medium meshes.
Generally, the VG effect is evaluated byCL, which means
that the medium mesh is sufficient for the parametric study of VGs becauseCLand theCpdistributions with the fine and medium mesh are almost the same.
4.1.2. Spacing effect
Model numbers 1-1, 1-2, 1-3 and 1-6 in Table 1 are com-pared to explore the effects of the VG spacing, D=h. Figures 7 to 10 represent the CL–, CD–, CM– and
CL–CD curves, respectively. Between ¼0 and 1 [deg],
shock-induced separation does not occur. The baseline model has higher CL than the without-VG model, while the other models with the VG have lowerCL in Fig. 7 due to the shock wave location affected by the VG. Figure 11 Table 2. Combination of VG parameters with the CRM2D airfoil.
No. Model name h=c l=h VG[deg] D=c D=h xVG=c Nodes [million]
2-1 Baseline 0.006 4 20 0.06 10 0.20 3.89 2-2 Quad-spacing 0.006 4 20 0.24 40 0.20 13.3 2-3 Quad-upstream 0.006 4 20 0.24 40 0.15 13.3 2-4 Low-angle 0.006 4 10 0.06 10 0.20 3.89 2-5 High-angle 0.006 4 30 0.06 10 0.20 3.89 2-6 Low-aspect 0.012 1 20 0.06 5 0.20 3.76 2-7 Without-VG — — — 0.06 — — 3.28
Table 3. Aerodynamic coefficients of each mesh at¼5[deg].
Model Mesh CL CD CM
Baseline Fine 0.888 0.0806 0.102
Medium 0.881 0.0800 0.0996
Coarse 0.827 0.0779 0.0936
Without-VG Medium 0.810 0.0793 0.101
Fig. 6. Pressure coefficient distributions of each mesh at¼5[deg].
(a) Mesh around the wing (b) Cross-section at x/c = 0.21
shows the distributions of Cp at ¼1[deg]. The shock wave of the baseline model moves downstream compared with the without-VG model although that of the other models with the VG moves upstream. CM in Fig. 9 also reflects this effect. This difference is attributed to the inter-actions among vortices discussed below.CDof the models with the VG is dominated by the drag acting on the VG itself when the angle of attack is low. That is,CDincreases with an increasing number of VGs per unit of wing area. There-fore, the lift-drag ratio of the wing with the broadly spaced VG is higher than that with the narrowly spaced VG as shown in Fig. 10, which means that the broad spacing is preferable to sustain the aerodynamic characteristics under cruise conditions.
CL of all models with the VG is lower than that of the without-VG model between ¼2and 3 [deg]. This is due to the shock wave location with regard to the double-spacing and quad-spacing models. On the other hand, the high Cp
behind the shock wave decreasesCLand markedly increases CM of the baseline model.
The models with the VG showed advantages atgreater than 4 [deg].CLof the baseline and double-spacing models
exceed that of the without-VG model, while CDvalues of these models are almost the same as that of the without-VG model, as shown in Figs. 7 and 8. However,CDof the
quad-spacing model increases markedly between ¼4 and 5 [deg], whileCLof the quad-spacing model is slightly higher than that of the without-VG model. These observa-tions are explained by Fig. 12, which showsCpdistributions at¼5[deg]. The shock wave of the baseline model moves far downstream, which enables the baseline model to have the highest maximumCL. As a result, the buffeting caused
by the shock-induced separation can be alleviated. In con-trast, the shock wave of the quad-spacing model is attached to the VG. Due to the weak interaction among VGs dis-cussed below, this model has lowerCp betweenx=c¼0:3 and 0.8 than the without-VG model, which helps to keep
CM low in Fig. 9, but increases CD in Fig. 8. The small
CM– fluctuation of the quad-spacing model is desirable for stability of the aircraft.
In addition, the interaction among vortices strongly de-pends on the VG spacing. Figure 13 shows adverse flow regions and distributions of skin friction coefficient,Cf, of each model’s upper surface. A thin boundary layer with high Fig. 7. Lift coefficients of each VG spacing.
Fig. 10. Drag polar-curve of each VG spacing. Fig. 9. Pitching moment coefficients of each VG spacing.
energy is generated by VG downwash at the downstream regions with high Cf, in Fig. 13. If the VG spacing is
nar-row, the interaction between VG downwash and upwash becomes strong, and the thin boundary layer is generated evenly in the span direction. Thus, the shock wave moves downstream (compare Fig. 13(a) and (d)), and the separa-tion region also spreads evenly (Fig. 13(a)). On the other hand, the interaction weakens and the particularly thin boundary layer is generated locally if the VG spacing is broad. As a result, the effects of the VG are propagated to a farther chord location, and the separation does not occur at the VG downwash region (Fig. 13(c)), which realizes the low Cp of the quad-spacing model behind the shock wave shown in Fig. 12. Furthermore, this attached region with the particularly thin boundary layer may act as a barrier preventing the separation caused by wing-body interference from spreading to the wing tip if the broadly spaced VGs are equipped on swept-wing aircraft. However, comparing Fig. 13(c) and (d), the separation region of the quad-spacing model spreads upstream along the VG upwash wake drained energy. The double-spacing model shown in Fig. 13(b) has
intermediate characteristics between the baseline and quad-spacing models.
Therefore, the design trade-offs among the desirable aerodynamic characteristics (low CD at low, high CL at high , barrier against separation propagation and small
CM–fluctuation) must be considered when optimization
of VG arrangements is performed.
4.1.3. Height effect
To confirm the effects of the VG height,h, model num-bers 1-1, 1-4, 1-5 and 1-6 in Table 1 are compared in this section. Figures 14 to 16 show theCL–,CD–andCM– curves of these models. The scale-down and low-height models have lower CL and CD, and higher CM than the
without-VG model and higher lift-drag ratios than the base-line model because the shock waves of these models move upstream as in the case of the double-spacing and quad-spacing models when the angle of attack is low. Only CL
of the baseline model is higher than that of the without-VG model because its ratio of the without-VG area to the wing area (lh=Dc) is the highest among all the models with the VG shown in Table 1. That is, the energy transportation caused by the VG of the baseline model is most active.
Considering the high angle of attack, there are some obvious differences in aerodynamic characteristics between the scale-down and low-height models. Figure 17 shows the
Cp distributions at ¼5[deg]. The Cp distribution of the scale-down model corresponds approximately to that of the baseline model including the shock wave location, which derives almost the same value of maximum CL as
shown in Fig. 14. On the other hand, the shock wave of the low-height model moves upstream compared with the baseline model at not only the low angle of attack but also the high angle of attack because the vortex weakens with the VG height at any angle of attack. As a result, the CL– curve of the low-height model is evenly lower than that of the baseline model as shown in Fig. 14. In addition,CD
of the scale-down and low-height models is lower than that of the without-VG model between ¼2 and 5 [deg] in Fig. 15 due to the decrease in the pressure drag generated from behind the shock wave and VG itself as shown in Fig. 17.
Fig. 11. Pressure coefficient distributions of each VG spacing at
¼1[deg].
Fig. 12. Pressure coefficient distributions of each VG spacing at
¼5[deg].
(a) Baseline
(b) Double-spacing
(c) Quad-spacing
(d) Without-VG
Fig. 13. Adverse flow regions and distributions of skin friction coeffi-cient,Cf of each VG spacing at¼5[deg].
4.2. CRM2D airfoil
4.2.1. Spacing and location effects
The effects of the VG spacing, D=h and location,xVG=c
are investigated by comparing the model numbers 2-1, 2-2, 2-3 and 2-7 in Table 2. Figures 18 to 20 represent the CL–,CD–andCM–curves, respectively. The spac-ing effect with the CRM2D airfoil is almost the same as that with the SC(2)-0518 airfoil. Figure 21 showsCp distri-butions at ¼7[deg]. The shock wave location of the baseline model moves far downstream, which enables this model to have highCLat the high angle of attack as shown in Fig. 18. The low Cp of the quad-spacing model behind the shock wave keeps CM constant in Fig. 20. However,
CL of the quad-spacing model is sufficiency higher than that of the without-VG model at ¼7[deg] in contrast with the case of the SC(2)-0518 airfoil. Additionally, CD
of the baseline model is higher than that of the without-VG model because the difference in shock wave locations between these models with the CRM2D airfoil is larger than that with the SC(2)-0518 airfoil (compare Figs. 12 and 21).
Considering the location effect, the quad-spacing model has slightly higher CL than the quad-upstream model as
shown in Fig. 18 because the vortex weakens with the dis-tance from the VG. However, in order to achieve the robust VG arrangement, it must be considered that the VG does not work at all if the VG is equipped far downstream and the shock wave moves upstream of the VG with the increment of the angle of attack and Mach number.
4.2.2. Incidence angle and aspect ratio effects
The model numbers 2-1, 2-4, 2-5, 2-6 and 2-7 in Table 2 are compared to identify the effect of the VG incidence angle, VG, and aspect ratio, l=h. Figures 22 to 24 show
the CL–,CD–andCM–curves, respectively. CL of the low-angle and high-angle models is lower than that of the baseline model in Fig. 22 because the shock waves of these models move upstream compared with that of the baseline model as shown in Fig. 25, which shows Cp distributions
at ¼7[deg]. As a result, these two models have lower
CD and higher CM than the baseline model as shown in Figs. 23 and 24. Therefore, it is confirmed that the appropri-ate incidence angle exists for generating the vortex most Fig. 14. Lift coefficients of each VG height.
Fig. 15. Drag coefficient of each VG height.
Fig. 16. Pitching moment coefficient of each VG height.
Fig. 17. Pressure coefficient distributions of each VG height at
efficiently. This appropriate angle is determined by the vortex strength and the energy loss caused by the VG. Figure 26 shows the upper surfaces of each model with the non-dimensional total pressure, Pt atx=c¼0:25, 0.35 and 0.45 and distributions of skin friction coefficient, Cf
at ¼4[deg]. Comparing Figs. 26(b) and (c), the low-angle model has higherPtaround the VG wake and lower
Cf at the VG’s downwash than the baseline model, which means that the vortex of the low-angle model is weaker be-cause the vortex strength depends on the lift acting on the VG (actually, this lift acts in the span direction).Cf of the high-angle model at the VG’s downwash is slightly higher than that of the baseline model in Figs. 26(b) and (d). How-ever, the high-angle model is not effective compared with the baseline model due to the stall of the VG itself. The especially low Pt of the high-angle model shown in Fig. 26(d) is derived by not only the vortex but also the energy loss caused by the VG stall.
In contrast to all other models with the VG, the low-aspect model shows no advantage for aerodynamic charac-teristics. CL of this model is lower than that of the
with-out-VG model at any angles of attack for two reasons. First, the vortex is too weak due to its low aspect ratio. Second, the vortex core is located far outside of the boundary layer, and the VG effect does not reach the wing surface. These tendencies are shown in Fig. 26(e) as highPtand lowCf.
5. Conclusion
A parametric study of VGs on the transonic infinite-wing was performed using CFD to investigate the effects of five parameters: height, aspect ratio, incidence angle, spacing and chord location. The present model had a single VG equipped on a super-critical infinite wing and the periodic boundary condition was adopted because CFD analysis of the three-dimensional wing with VGs required too much computational time. Two types of airfoils, SC(2)-0518 and CRM2D, were employed to confirm that the results obtained from this parametric study could be applied to actual aircraft design regardless of the airfoil differences. The thickness ratio and leading-edge radius of the SC(2)-0518 airfoil were large, while those of the CRM2D airfoil were small. Fig. 18. Lift coefficients of each VG spacing and location. Fig. 20. Pitching moment coefficient of each VG spacing and location.
Fig. 19. Drag coefficient of each VG spacing and location. Fig. 21. Pressure coefficient distributions of each VG spacing and loca-tion at¼7[deg].
The effects of the VG spacing and height were investi-gated with the SC(2)-0518 airfoil. First, it became obvious that the VG spacing significantly affects the shock wave location. If the spacing was narrow, the shock wave moved downstream, which increased the lift coefficient at high angle of attack but also increased the drag coefficient at low angle of attack. In contrast, broad spacing suppressed the fluctuation of pitching moment coefficients, while the lift coefficient decreased and the drag coefficient increased
at high angle of attack. This difference was caused by the interactions among vortices and generated the design trade-offs among VG arrangements. Second, the VG height changed the drag coefficients and was correlated with the VG spacing. The wing with the small VG showed decreased drag coefficient compared to that without the VG at high angle of attack. The maximum lift coefficients became the same if the VG heights were different and the ratios of spac-ing to height were the same, while the lift coefficients Fig. 22. Lift coefficients of each VG incidence angle and aspect ratio.
Fig. 25. Pressure coefficient distributions of each VG incidence angle and aspect ratio at¼7[deg].
Fig. 23. Drag coefficient of each VG incidence angle and aspect ratio.
Fig. 24. Pitching moment coefficient of each VG incidence angle and as-pect ratio.
(a) Without-VG (b) Low-angle (c) Baseline (d) High-angle (e) Low-aspect
Fig. 26. Non-dimensional total pressure,Ptatx=c¼0:25, 0.35 and 0.45 cross-sections and distributions of skin friction coefficient,Cf
changed evenly at all angles of attack if the VG heights were different and the values of spacing itself were the same. On the other hand, the CRM2D airfoil was employed to test the effects of the VG spacing, location, incidence angle and aspect ratio. The spacing effect with the CRM2D airfoil was almost the same as that of the SC(2)-0518 airfoil, while the results indicated that the VG was more effective for the CRM2D airfoil. The VG location had little influence, but the VG located more upstream would reduce the shock-induced separation up to larger angles of attack. It was confirmed that an appropriate incidence angle exists for generating the vortex most efficiently. This angle was determined by the vortex strength and the energy loss caused by the VG. Finally, the aspect ratio of the VG controlled the vortex strength. The VG did not work if the aspect ratio defined by the length to height was too low.
Acknowledgments
The flow conditions and the model geometry were provided by JAXA. The authors would like to thank Dr. Mitsuhiro Murayama of JAXA, Dr. Keizo Takenaka of Mitsubishi Heavy Industries, Ltd. and Mr. Keita Hatanaka of Mitsubishi Aircraft Corporation for their kind support, especially with the flow solver modification.
References
1) Wik, E. and Shaw, S. T.: Numerical Simulation of Micro Vortex Generators, AIAA Paper 2004-2697, 2004.
2) Spalart, P. R. and Allmaras, S. R.: A One-Equation Turbulence Model for Aerodynamic Flows,Recherche Aerospatiale,1(1994), pp. 5–21. 3) Dacles-Mariani, J., Zilliac, G. G., Chow, J. S. and Bradshaw, P.: Numerical/Experimental Study of a Wingtip Vortex in the Near Field,
AIAA J.,33, 9 (1995), pp. 1561–1568.
4) Menter, F. R.: Two-Equation Eddy-Viscosity Turbulence Models for Engineering Applications,AIAA J.,32, 8 (1994), pp. 1598–1605. 5) Bur, R., Coponet, D. and Carpels, Y.: Separation Control by Vortex
Generator Devices in a Transonic Channel, Shock Waves, 19, 6 (2009), pp. 521–530.
6) Huang, J., Fu, S., Xiao, Z. and Zhang, M.: Study of Separation Control of Vortex Generators on Transonic Wings,J. Fluid Sci. Technol.,6, 1 (2011), pp. 85–97.
7) Dandois, J., Brunet, V., Molton, P., Abart, J.-C. and Lepage, A.: Buffet Control by Means of Mechanical and Fluidic Vortex Generators, AIAA Paper 2010-4975, 2010.
8) Lee, B. J., Kumano, T. and Liou, M. S.: Design Exploration for Vortex Generators for Boundary-Layer-Ingesting Inlet, AIAA Paper 2010-9399, 2010.
9) Obayashi, S. and Guruswamy, G. P.: Convergence Acceleration of an Aeroelastic Navier-Stokes Solver,AIAA J.,33, 6 (1994), pp. 1134– 1141.
10) Venkatakrishnan, V.: Convergence to Steady State Solutions of the Euler Equations on Unstructured Grids with Limiters,J. Comput. Phys.,118, 1 (1995), pp. 120–130.
11) Sharov, D. and Nakahashi, K.: Reordering of Hybrid Unstructured Grids for Lower-Upper Symmetric Gauss-Seidel Computations,AIAA J.,36, 3 (1998), pp. 484–486.
12) Aupoix, B. and Spalart, P. R.: Extensions of the Spalart-Allmaras Turbulence Model to Account for Wall Roughness,Int. J. Heat Fluid Flow,24(2003), pp. 454–462.
13) Vassberg, J., Dehaan, M., Rivers, M. and Wahls, R.: Development of a Common Research Model for Applied CFD Validation Studies, AIAA Paper 2008-6919, 2008.
14) Engineering Science and Data Unit (ESDU) 93024: Vortex Generators for Control of Shock-Induced Separation Part 1: Introduction and Aerodynamics, 1993.
15) Engineering Science and Data Unit (ESDU) 93025: Vortex Generators for Control of Shock-Induced Separation Part 2: Guide to Use of Vane Vortex Generators, 1994.
16) Engineering Science and Data Unit (ESDU) 93026: Vortex Generators for Control of Shock-Induced Separation Part 3: Example of Applica-tions of Vortex Generators to Aircraft, 1995.
17) Ito, Y. and Nakahashi, K.: Direct Surface Triangulation Using Stereo-lithography Data,AIAA J.,40, 3 (2002), pp. 490–496.
18) Sharov, D. and Nakahashi, K.: Hybrid Prismatic/Tetrahedral Grid Generation for Viscous Flow Applications,AIAA J.,36, 2 (1998), pp. 157–162.
19) Ito, Y. and Nakahashi, K.: Unstructured Mesh Generation for Viscous Flow Computations, Proceedings of the 11th International Meshing Roundtable, Ithaca, NY, 2002, pp. 367–377.
20) Ito, Y. and Nakahashi, K.: Surface Triangulation for Polygonal Models Based on CAD Data,Int. J. Numer. Methods Fluids,39, 1 (2002), pp. 75–96.